Introduction
The societal lifestyle alterations observed in the last decades have led to decreased male fertility.Reference Levine, Jørgensen and Martino-Andrade1 Hypercaloric dietsReference Danielewicz, Przybyłowicz and Przybyłowicz2 and adipose tissue retention, which leads to overweight and obesity, may act negatively through either direct or indirect pathways.Reference Jensen, Andersson and Jørgensen3–Reference Shayeb, Harrild, Mathers and Bhattacharya6
Besides causing changes to the exposed generation, environmental influences may predispose descendent generations to chronic diseases, such as obesity, type 2 diabetes, cardiovascular diseases, cancer, and even behavioral disorders.Reference Wei, Schatten and Sun7 In this sense, transgenerational transmission mediated by gene expression modulation through germ cell epigenetic mechanisms, which transmit these tags to subsequent generations in the absence of environmental exposures,Reference Guerrero-Bosagna and Skinner8 could explain the propensity for these diseases, even in the absence of genetic heritability, which may endure for several generations. DNA methylation, histone changes, and the generation of non-coding RNA are feasible mechanisms that may explain the non-genetic transfer of paternal environmental information. Altered sperm DNA methylation patterns and aberrant spermatozoa histone acetylation, which may promote insufficient sperm chromatin compression during spermiogenesis, may be related mechanisms that cause unfavorable reproductive parameters.Reference Guerrero-Bosagna and Skinner8,Reference Soubry, Hoyo, Jirtle and Murphy9
Among the various experimental studies that investigate dietary intakes regarding metabolic and reproductive evaluations, most comprise only one factor in excess, such as hyperlipidic diets, and scarce studies regarding dietary patterns or food groups that mimic the modern Western diet are available.Reference Gaskins, Colaci, Mendiola, Swan and Chavarro10 These provide higher levels of more than one component, such as lipids and glycines, called “high-fat-high-sugar” (HFHS) diets.
Studies concerning maternal environmental influences on offspring health are well established. However, if male offspring whose parents have been exposed to the metabolic/reproductive dysfunction condition are able to develop the same condition, and if it can be passed on to future generations, remains uncertain.Reference Fullston, Teague and Palmer11 Understanding the role of the father in the transmission of environmental influences on descendent generations is still required, mainly due to the fact that modifications in the spermatic epigenome may be implicated in this process.Reference Soubry12
In this context, the aim of the present study was to evaluate reproductive and metabolic aspects of two generations of rats offered a paternal HFHS diet from weaning to young adulthood.
Methods
Subjects
Thirty Wistar rats provided by the Centro de Biologia da Reprodução of the Federal University of Juiz de Fora were weaned at 25 days old. The animals were maintained under standard conditions recommended by animal housing guidelines, in a proportion of five animals per mini-insulators, lined with shavings arranged in ventilated racks at a controlled temperature of 22 ± 2 °C in rooms under a controlled light/dark cycle of 12 h.
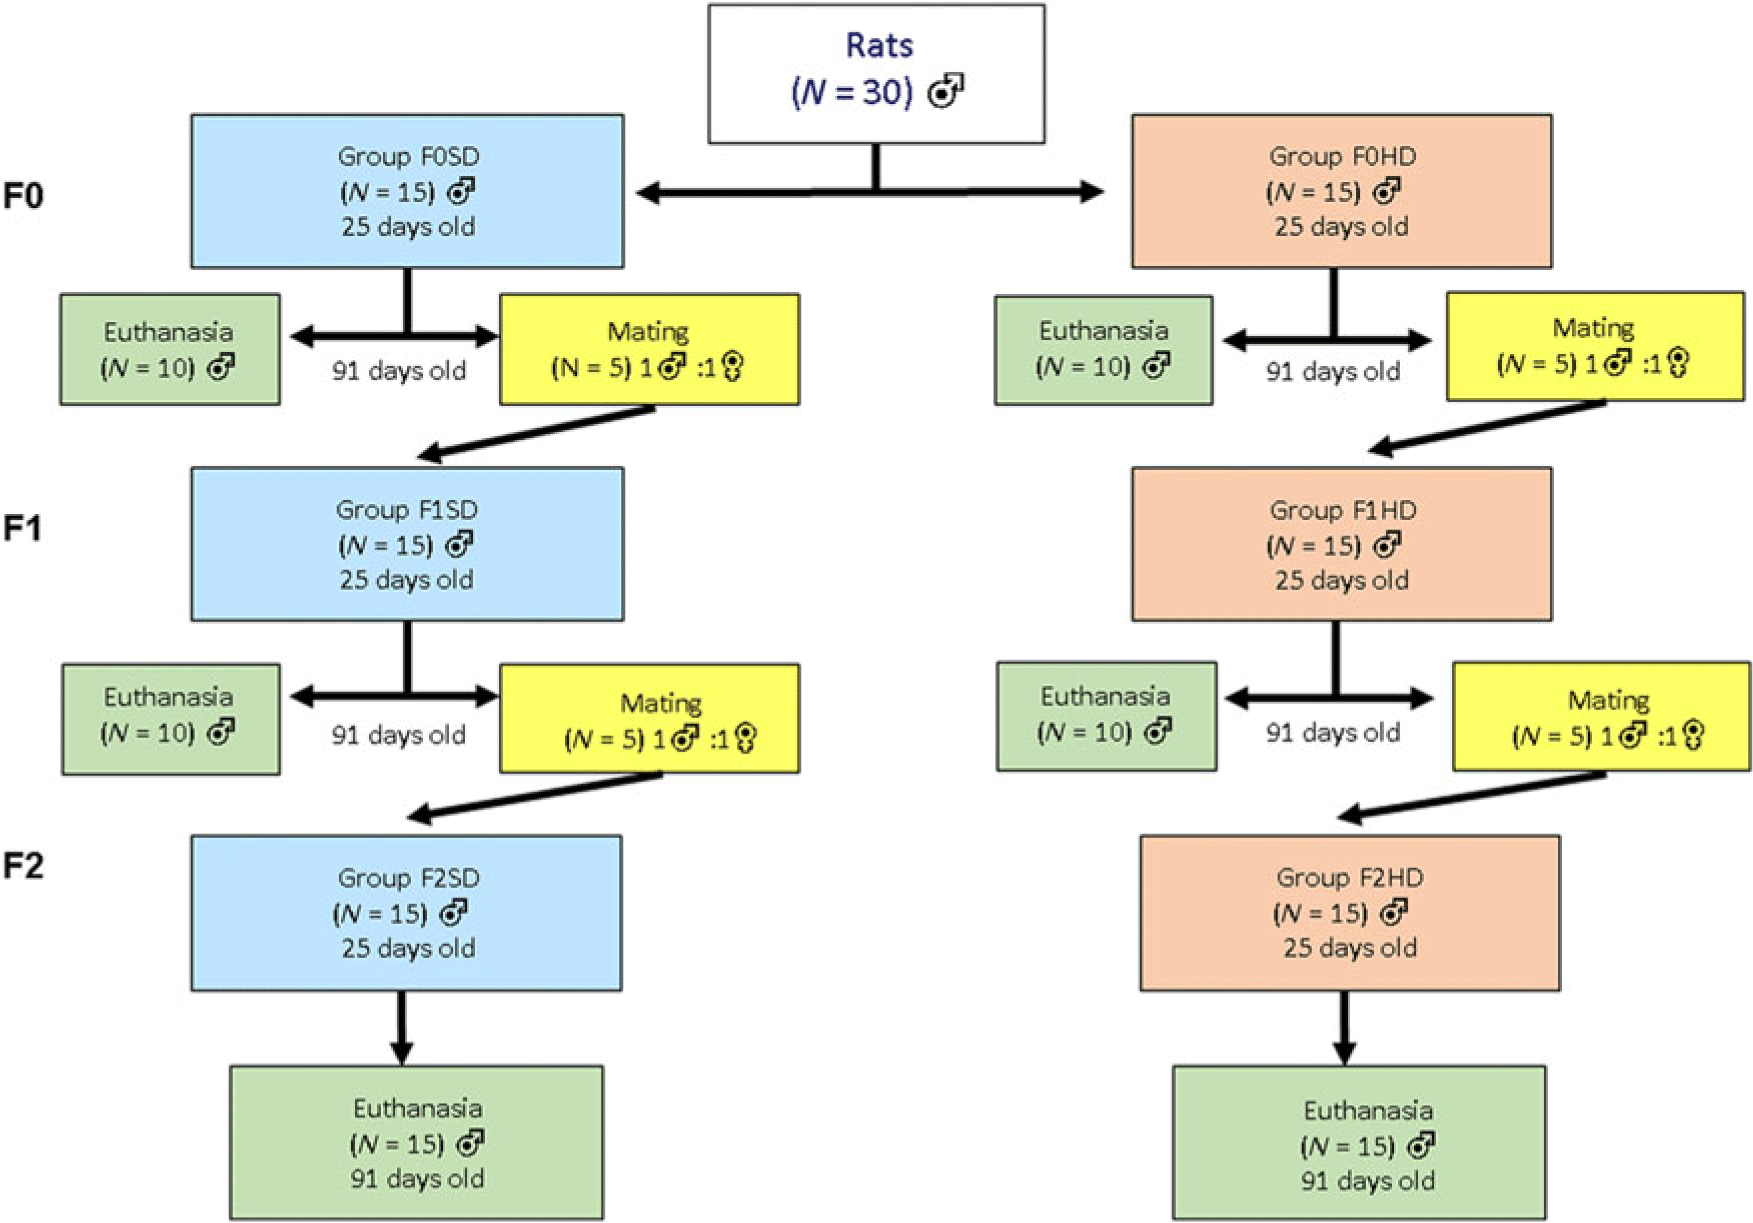
These animals comprised the F0 generation groups and were randomly distributed into 2 groups containing 15 animals each, receiving either a standard (F0SD) or hypercaloric (F0HD) diet, ad libitum, from weaning until 90 days old. Subsequently, 10 animals from each group were euthanized and 5 were randomly assigned to mate with 4-month-old fertile females, at an 1 female to each male ratio. Mating was confirmed by the presence of spermatozoa in vaginal smears, which were performed daily.
After mating confirmation, the mating males were separated from the females for 72 h for spermatic reserve recomposition and were then euthanized. During this period, the rats received their respective feeds according to their assigned groups. On the day prior to the delivery, each pregnant female animal was housed individually. Two days after the delivery, eight pups per female were sexed and standardized, comprising four males and four females. Up to 15 males per respective parental group were selected to compose the F1 generation (n = 15) from each experimental group, either F1SD or F1HD, in which three males from each mated males were taken.
F1 animals were separated into their respective groups regarding the parental generation, containing 15 animals each. All groups received a standard diet until 90 days old. Then, 10 animals from each group were euthanized following the F0 experimental design, and 5 were randomly destined to mate with fertile females, as previously described. Up to 15 males per respective parental group composed the F2 generation (n = 15), F2SD or F2HD. The F2 generation groups were fed the standard diet until 90 days of age. At this stage, all animals were euthanized (Fig. 1).
Scheme representing animal distribution into the three assessed generation experimental groups. Only the male rats of Group F0HD received hypercaloric diet (HD). The other animals received standard diet (SD).

Standard and hypercaloric diet feeds
The SD group received the normocaloric Nuvilab CR-1 irradiated feed, manufactured by Quimtia® (Curitiba, Brazil), with composition of 9% of minerals, 22% of protein, 5% of ethereal extract, 7% of fiber, and 57% of nitrogen-free extract, with a caloric density of 3.86 kcal/kg. The HD group received the high palatability hypercaloric HF 45% pelleted feed, rich in sucrose and lipids, with composition of 6.2% of mineral material, 23.7% of protein, 23.9% of ethereal extract, 4.5% of fiber and 41.7 % of nitrogen-free extract, manufactured by PragSoluções Comércio e Serviços Ltda (Jaú, Brazil), with a caloric density of 4.77 kcal/kg. The hypercaloric feed composition recommendations followed the protocols used by Park et al. Reference Park, Harrold, Widdowson and Williams13
Body weight assessments, caloric intake and energy efficiency coefficient
After weaning, male offspring (F0, F1, and F2) were evaluated weekly and data concerning total body weight (g) evolution and estimated 1-day food consumption were obtained. The energy efficiency coefficient (EEC) was determined as: EEC = (FBW − IBW)/TCI, where EEC in g/cal; FBW is the final body weight at 90 days of age (g); IBW is the initial body weight at 25 days of age (g), and TCI is the total caloric intake from 25 to 90 days of age (calories) according to Nery et al. Reference Nery, Pinheiro, Muniz, Vasconcelos, França and Nascimento14 Final weight and nasoanal length (NAL) (cm) were also taken before eutanasia.
Prepubertal age evaluations
Prepubertal development was evaluated by observing the day of occurrence of testicle descent and glans morphology of F1 and F2 rats. The latter classified as phases A, B, and C, according to Yamasaki et al. Reference Yamasaki, Sawaki, Noda, Muroi and Takatsuki15 Observation started from 18th postnatal day.
Oral glucose tolerance test
Two weeks before euthanasia, the animals were submitted to the oral glucose tolerance test (OGTT). Blood samples were obtained by means of tail sectioning by lancing using a scalpel blade as close to the tail tip as possible, in order to measure capillary glucose at T0 (time zero – 6-h fasting period). Subsequently, an intragastric dose of a 50% glucose solution at 2 g/kg body weight was administered, and blood samples were taken at T1, T2, T3, and T4 (15, 30, 60, and 120 min, respectively) according to Silva et al. Reference Silva, Santos and Franca16 All samples were analyzed on an Accu-Check® Active model glucometer (Roche, Germany). The area under the curve was measured using the Graphpad Prism® - Version 5 software (La Jolla, USA).
Insulin tolerance test
After 1 week, the animals were submitted to the insulin tolerance test (ITT). After a 6-h fasting period prior to the test, glucose was measured by means of blood collected from the tip of the tail. The animals received an NPH Novolin-Novo Nordisk® (Bagsvaerd, Denmark) insulin dose intraperitoneally at 1 IU/kg body weight. Subsequent glucose measurements were performed at T1, T2, T3, and T4 (5, 15, 30, and 45 min, respectively) from intraperitoneal administration of the insulin solution, according to Hirata et al. Reference Hirata, Alvarez-Rojas, Campello Carvalheira, De Oliveira Carvalho, Dolnikoff and Abdalla Saad17 All samples were analyzed on an Accu-Check® Active model glucometer. The glucose decay coefficient/minute (KITT) was measured using the Graphpad Prism® – Version 5 software.
Euthanasia
Adult animals were euthanized by cardiac exsanguination after anesthesia, associated with diaphragmatic rupture. The anesthetic protocol comprised a combination of ketamine at 90 mg/kg and xylazine hydrochloride at 10 mg/kg. Blood was collected by cardiac puncture, and blood serum was separated, fractionated in aliquots, and stored at −80 °C for subsequent biochemical analyses.
Adipose tissue accumulation estimates
Adipose tissue accumulation estimates were performed by weighing (g) retroperitoneal and perigonadal adipose tissues in male animals after dissection of abdominal organs and fat, which were weighed on precision scales.
Lipidemia and serum biochemical evaluations
Serum urea (URE), creatinine (CRE), alanine aminotransferase, aspartate aminotransferase and total cholesterol and fractions (HDL and LDL) and triglyceride (TRIG) levels were evaluated using commercial Roche® brand kits on a Cobas analyzer, Model C 111, also from Roche® (Indianapolis, IN, USA).
Sperm counts
Epididymal sperm counts (SC) were performed on samples obtained from the right epididymis secretion Reference Seed, Chapin and Clegg18 and placed in 50 μl of phosphate-buffered saline solution heated to 37 °C. Then, this sample was diluted 300 times in distilled water and packed in a Neubauer chamber, and spermatozoa were counted under an optical microscope at 100× magnification. Spermatozoa were counted in the four lateral quadrants of each chamber reticulum in two chamber reticula for each animal. The mean value of a lateral quadrant was applied to the formula to obtain final sperm concentrations/ml: x = a × 300 × 10,000, with x = final sperm concentration/ml; a = mean number of spermatozoa counted in eight lateral Neubauer chamber quadrants.
Sperm morphology assessments
A total of 20 μl of the epididymal secretion of the petri dish was diluted in 2 ml of phosphate-buffered saline to obtain a smear. After drying, the slide was stained by the Shorr technique for spermatozoa counting and morphological classification in order to determine abnormality indices. 19 A total of 200 spermatozoa were analyzed and classified as normal or abnormal at a 1000× magnification under a light microscope. The main assessed alterations were head defects, amorphous and double heads and tail defects, and broken and curled tails.
Organ weights
Necropsies were performed, and the following organs were removed and weighed on a precision scale: left and right testicles, right epididymis, full seminal vesicle, prostate, kidneys, liver, spleen, and left and right adrenal glands.
Histometric testicular analyses
After weighing, the testes were fixed by immersion in a modified Karnovsky fixative (4% paraformaldehyde: 4% glutaraldehyde in 0.1 ml/l phosphate saline buffer at pH 7.4). Twenty-four hours after fixation, the tunica albuginea and the testicular parenchyma of the right testicle were removed and weighed. These testicular fragments were then included in histological resin (2-hydroxyethyl methacrylate) Leica® (Heidelberg, Germany) and submitted to a microtomy (3 μm thickness) and stained with toluidine-1% sodium borate blue. The histological sections were then photographed under an optical microscope equipped with an AXIOCAM ICc3 – Zeiss® camera coupled for digital capture. The Axiovision version 4.9.1 – Zeiss® (Oberkochen, Germany) image capture program and digital measurement system were used. The following parameters were analyzed according to França and Godinho Reference França and Godinho20 and Oshio et al. Reference Oshio, Ribeiro and Marques21: volumetric density of the tubular (VDT) and intertubular (VDI) testicular compartments; volume of tubular (VTT) and intertubular (VIT) testicular compartments; tubulosomal index (TSI); diameters of the seminiferous tubule (DT) and tubular lumen (LD); height of the seminiferous epithelium (HE); total length of the seminiferous tubules per testis and per gram of testis; and volumetric density and volume of the intertubular tissue components.
Volumetric densities of the tubular and intertubular testicular compartments
A total of 2660 points were counted, using a standardized 266-point grid applied to the histological photographs available in the Image-Pro Plus® program version 4.5.0.29 (Media Cybernetics, USA), considering the line intersections in 10 photographs taken from randomly chosen fields per animal. Each point was analyzed and classified as belonging to the tubular or intertubular compartment.
The VDT and VDI testicular compartments were calculated as x = (a or b/2660) × 100, where x = volumetric density of the testicular compartment; a = total sum of the overlapping points in the tubular compartment; b = total sum of the overlapping points in the intertubular compartment.
Volumes of the tubular and intertubular testicular compartments and tubulosomal index
In order to determine the VTT and VIT compartments, a specific testicular density equal to 1 was considered. Reference Johnson, Petty and Neaves22 Thus, parenchyma weight (g) was considered as equal to its volume (ml). The applied formula was: x = (a or b × z)/100, where: x = volume of the testicular compartment (ml); z = weight of the testicular parenchyma (g); a = volumetric density of the tubular compartment and b = volume density of the intertubular compartment.
The TSI was determined as x = (a/y) × 100, where: x = TSI; a = volume of the tubular testicular compartment; y = body weight.
Diameters of the seminiferous tubule and tubular lumen and height of the seminiferous epithelium
Twenty transverse sections of the most circular seminiferous tubules possible per animal were photographed with a 10× objective lens. The DT measurements obtained from each seminiferous tubule were divided by two, to determine the tubular radius. Parallel to the measurement of the DT, two height measurements of the seminiferous epithelium were taken, in opposite positions, and the mean value of these two measures was then considered. The LD was also determined by the difference between the DT value and the sum of the two HE taken from opposite positions.
Total length of the seminiferous tubules per testis and per gram of testis
After obtaining the radius and volume of the seminiferous tubules, the total length of the seminiferous tubules was calculated Reference Attal and Courot23 as x = a/(π × r 2), where x = total length of seminiferous tubules per testis; a = volume of the tubular compartment; π = pi, as 3.14; r = seminiferous tubules radius.
The total length of the seminiferous tubules was divided by the total weight of the testicles, to obtain the length of the tubules per gram of testis.
Volumetric density and volume of the intertubular tissue components
A total of 1000 projected points was obtained from images captured from the intertubular region in the different histological sections of the testicle of each animal, at 400× magnification using a standardized 609 point grid. The points were classified and quantified as present in Leydig cells (LEY), blood vessels, lymphatic spaces (LYM), extracellular matrix (MAT), and macrophages. The volumetric density of these elements was calculated as x = (a/1000) × 100, where x = volumetric density of the intertubular compartment elements; a = total sum of the points superimposed on each intertubular compartment element.
The volume of the intertubular elements was calculated as x = (a × z)/100, where, x = volume of the intertubular element; a = volumetric density of one element of the intertubular compartment and z = volume of the total intertubular space.
Statistical analyses
Data distributions were analyzed by the Shapiro–Wilk test. Comparisons were performed between the SD and HD groups of the same generation. Student’s t-test was used when data presented a normal distribution, while the Mann–Whitney test was used for non-normally distributed data. The adopted level of significance was p < 0.05. The SPSS® software (Statistical Package for the Social Sciences), version 21 (New York, NY, USA) was used for all statistical analyses.
Results
F0, F1, and F2 metabolic evaluation results
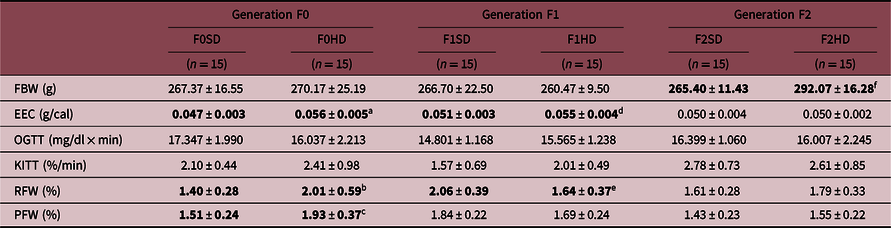
Regarding the final body weight of the animals, no statistical differences between SD and HD groups for the F0 and F1 generations were observed. However, for F2, body weights of the F2HD group presented higher means than the F2SD group (Table 1).
Final body weight (FBW) (g), energy efficiency coefficient (EEC) (g weight/calorie), oral glucose tolerance test (OGTT) (area under the curve – mg/dl glucose × 120 min), insulin tolerance test - glucose decay coefficient/min (K ITT) (% glucose decay/min), relative retroperitoneal fat weight (RFW) and relative perigonadal fat weight (PFW) of F0 generation rats receiving a standard diet (F0SD) or hypercaloric diet (F0HD) and their F1 and F2 offspring

Data are expressed as means ± standard deviation. The bold values mean the significant statistical differences.
F1SD, group of F1 animals from generation F0 that received a standard diet; F1HD, group of animals of generation F1 from the F0 generation that received a hypercaloric diet; F2SD, group of F2 generation animals from the F0 generation that received a standard diet; F2HD, group of F2 generation animals from the F0 generation that received a hypercaloric diet.
p values: a0.000, b0.002, c0.001, d0.005, e0.005, and f0.000.
Although no difference in body weight was noted, a statistically significant difference between F0SD and F0HD concerning the EEC was observed, with the F0HD group presenting a higher means. This pattern was repeated for F1, where the F1HD group presented higher means. However, no difference was observed between the F2 groups (Table 1).
No statistically significant differences between the groups and the three generations were observed regarding the OGTT and ITT assessments (Table 1).
However, increases in the mean relative weight of retroperitoneal and perigonadal fats of animals from the F0HD group were observed in relation to F0SD. Animals from the F1HD group presented lower retroperitoneal fat weight means compared to F1SD. No statistical differences were observed in the relative fat weights between the F2 studied groups.
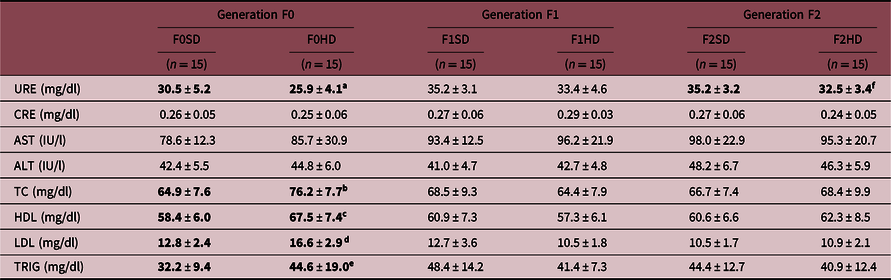
The biochemical evaluation of the animals is displayed in Table 2. Significant differences with increased means for total cholesterol and the HDL and LDL fractions were noted, as well as for TRIG levels of animals from the F0HD group in relation to the F0SD group. Decreased means related to URE concentrations were observed, with a significant difference between animals from the F0HD and F2HD groups compared to their respective control groups. No differences between the other assessed parameters were found.
Serum biochemical data of F0 generation rats receiving a standard diet (F0SD) or hypercaloric diet (F0HD) and their F1 and F2 offspring

Data are expressed as means ± standard deviation.
F1SD, group of F1 animals from generation F0 that received a standard diet; F1HD, group of animals of generation F1 from the F0 generation that received a hypercaloric diet; F2SD, group of F2 generation animals from the F0 generation that received a standard diet; F2HD, group of F2 generation animals from the F0 generation that received a hypercaloric diet; URE, serum urea concentrations (mg/dl); CRE, serum creatinine concentrations (mg/dl); TC, serum total cholesterol concentrations (mg/dl); HDL, serum cholesterol concentrations; HDL fraction (mg/dl); LDL, serum cholesterol concentrations; LDL fraction (mg/dl); TRIG, serum triglyceride concentrations (mg/dl).
p values: a0.012, b0.000, c0.001, d0.001, e0.031, and f0.033.
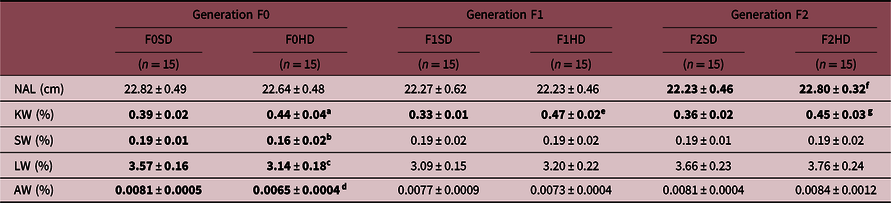
A significant difference was observed regarding relative spleen and liver weights and mean relative adrenal weight of F0HD animals in relation to F0SD animals. The mean relative kidney weight (KW) presented statistically significant differences in all three generations with higher means in the groups offered a HD. One of the morphometric determinations NAL presented increased means in animals from the F2HD group.
Reproductive evaluations of the F0, F1, and F2 generations
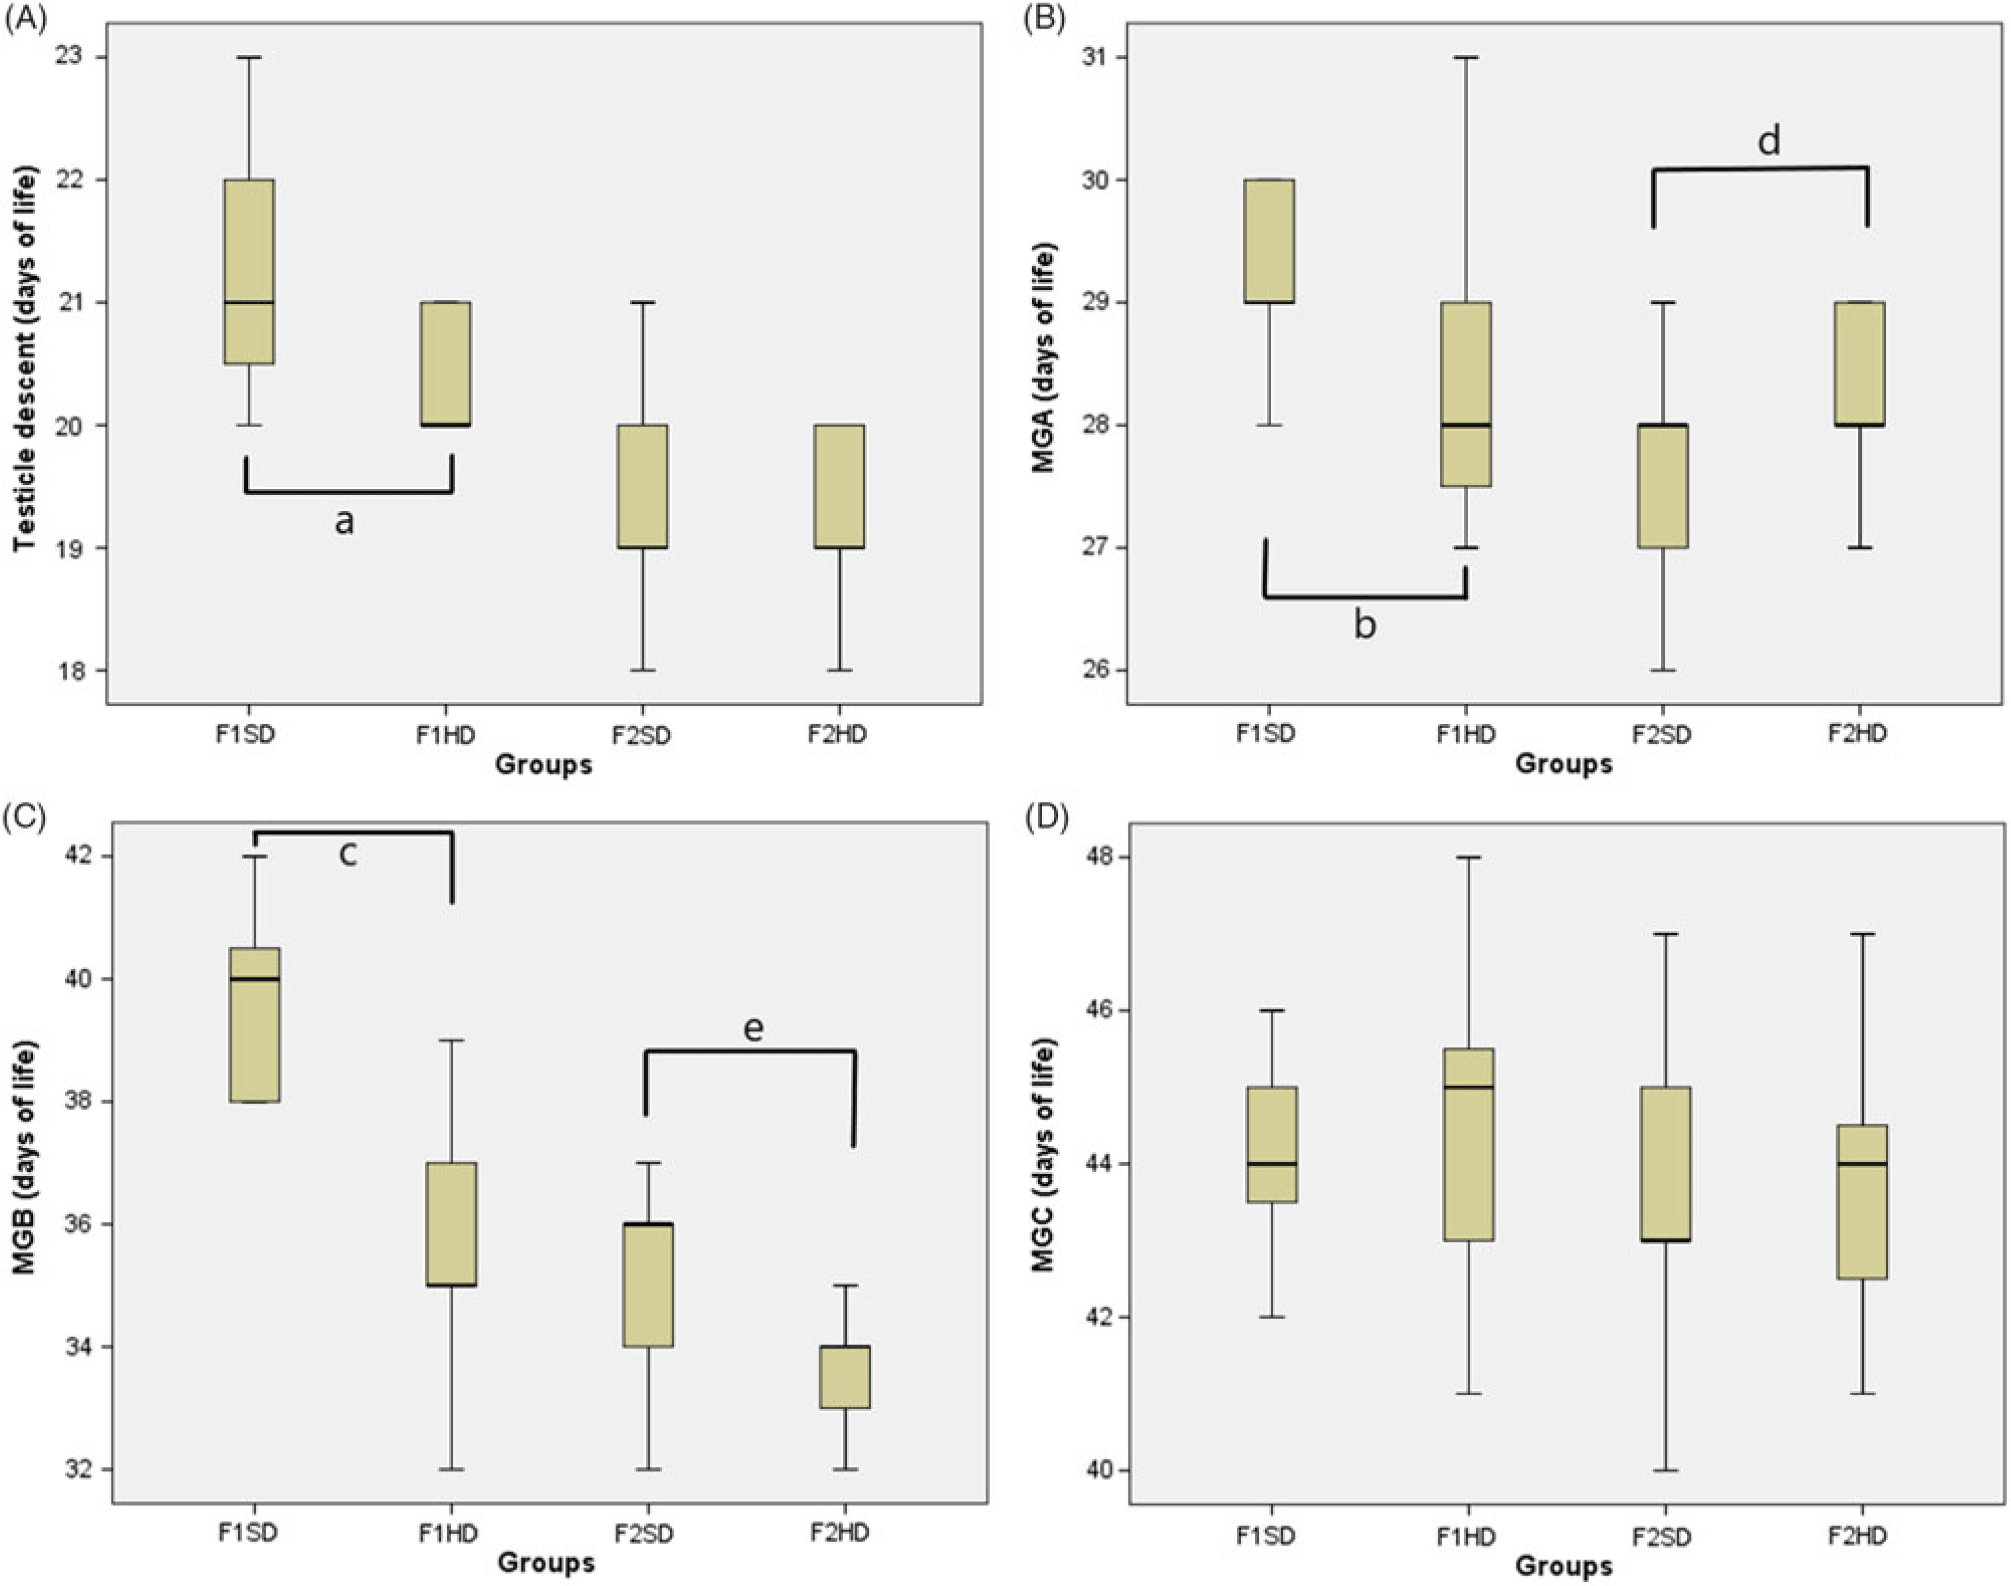
Prepubertal development evaluation results are displayed in Fig. 2. Animals from the F1HD group presented lower mean testis (TD) descent age (Fig. 2A) and A (MGA) and B (MGB) phases penile glans morphology ages in relation to the F1SD group (Fig. 2B and 2C, respectively). No statistical difference concerning occurrence age of phase C glans morphology (MGC) (Fig. 2D) was noted. A delay in the occurrence of phase A (Fig. 2B) and precocity in phase B (Fig. 2C) was noted for the F2HD group compared to the F2SD.
Prepubertal development of F1 and F2 descendant Wistar rats from paternal generation rats receiving either a standard diet (F0SD) or hypercaloric diet (F0HD). The data are related to the age (days) of testicle descent and penile glans morphology development, specified as the age (days) of the beginning of phases A, B and C. Data are expressed as box plots.

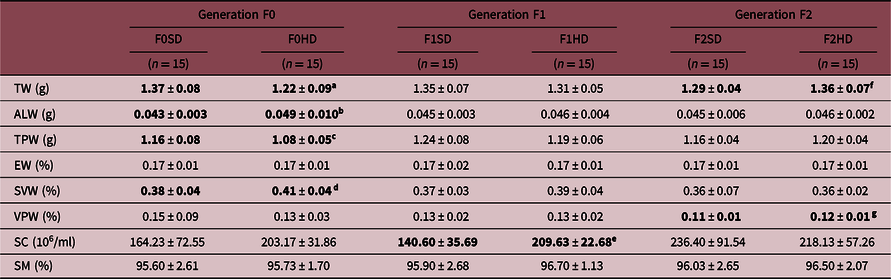
Regarding reproductive system evaluations, decreases in the mean absolute weights and testicular parenchyma were observed, as well as increases in testicular albuginea tunic weights and relative seminal vesicle weights in the F0HD group in relation to F0SD. An increase in the mean absolute weight of the testes of animals from the F2HD group was also observed. No statistical differences between the observed means of F0 generation counts were noted, although an increase in the F1HD group was presented. No statistical differences between the observed means for sperm morphology of the groups belonging to the three generations were observed (Table 3).
Weights of the organs and male reproductive system annex glands in F0 Wistar rats receiving a standard (F0SD) or hypercaloric (F0HD) diet and their F1 and F2 descendants

Data are expressed as means ± standard deviation.
F1SD, group of F1 animals from generation F0 that received a standard diet; F1HD, group of animals of generation F1 from the F0 generation that received a hypercaloric diet; F2SD, group of F2 generation animals from the F0 generation that received a standard diet; F2HD, group of F2 generation animals from the F0 generation that received a hypercaloric diet; TW, mean absolute weight of the testicles (g); ALW, weight of the testicular albuginea (g); TPW, weight of the testicular parenchyma (g); EW, relative weight of the right epididymis (%); SVW, relative weight of the seminal vesicle (%); VPW, relative weight of the ventral prostate (%); SC, sperm count (106/ml); SM, spermatic morphology (% of normal sperm).
p values: a0.000, b0.027, c0.016, d0.034, e0.000, f0.004, and g0.012.
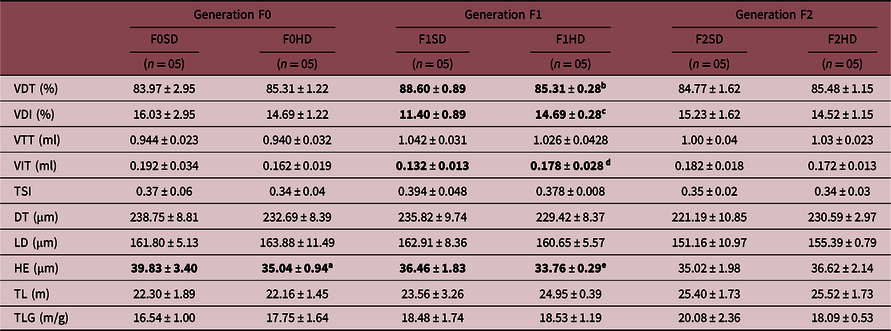
A decrease in the epithelium heights of F0HD animals was observed in comparison to the F0SD group. This was also observed in F1, with a lower means in the F1HD group (Table 4). No differences were observed between histometric parameters, such as volumetric density and volume of testicular compartments, while lower values related to the seminiferous tubules in animals from the F0 generation were also noted (Table 4). In the F1 generation, a reduction in the volumetric density of the tubular testicular compartment and an increase in the volumetric density and volume of the intertubular testicular compartment in the F1HD group were observed in relation to the F1SD group. Changes in the volume and volumetric density variables and the other controls related to the seminiferous tubules of F2 animals were not evidenced (Table 4).
Volumetric density and volume of testicular compartments, tubulosomal index (TSI) and histometric data of seminiferous tubules of Wistar rats receiving a standard diet (F0SD) or a hypercaloric diet (F0HD) and their F1 and F2 offspring

Data are expressed as means ± standard deviation
F1SD, group of F1 animals from generation F0 that received a standard diet; F1HD, group of animals of generation F1 from the F0 generation that received a hypercaloric diet; F2SD, group of F2 generation animals from the F0 generation that received a standard diet; F2HD, group of F2 generation animals from the F0 generation that received a hypercaloric diet; VDT, volumetric density of the tubular testicular compartment; VDI, volumetric density of the intertubular testicular compartment; VTT, volume of the tubular testicular compartment (ml); VIT, volume of the intertubular testicular compartment (ml); TSI, tubulosomal index; DT, diameter of the seminiferous tubules (µm); LD, luminal diameter of the seminiferous tubules (µm); HE, height of the seminiferous epithelium (µm); TL, total length of the seminiferous tubules per testis (m); TLG, length of seminiferous tubules per gram of testis (m/g).
p values: a0.009, b0.009, c0.009, d0.010, and e0.009.
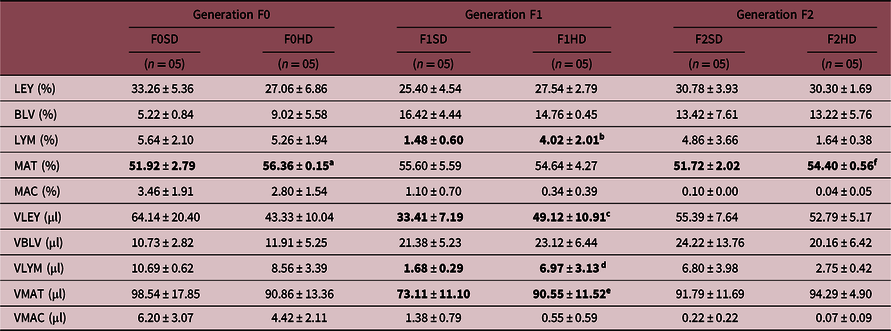
Regarding the evaluation of the intertubular testicular compartment components, a significant statistical difference was observed only for MAT volume density, with higher means in the F0HD group in relation to F0SD (Table 5). The F1 generation displayed an increase in the volume and volumetric density means of this compartment, reflected in increased LYM volumetric density, and LEY and MAT volumes in the F1HD group when compared to the F1SD group (Table 5). MAT volumetric density also displayed a significant increase in means in the F2HD group when compared to the F2SD group (Table 5).
Volumetric density and volume of intertubular testicular compartment components of F0 generation Wistar rats receiving a standard diet (F0SD) or a hypercaloric diet (F0HD) and their F1 and F2 offspring

Data are expressed as means ± standard deviation.
F1SD, group of F1 animals from generation F0 that received a standard diet; F1HD, group of animals of generation F1 from the F0 generation that received a hypercaloric diet; F2SD, group of F2 generation animals from the F0 generation that received a standard diet; F2HD, group of F2 generation animals from the F0 generation that received a hypercaloric diet; LEY, Leydig cell volumetric density; BLV, volumetric density of blood vessels; LYM, volumetric density of lymphatic space; MAT, volumetric density of the extracellular matrix; MAC, volumetric density of macrophages; VLEY, volume of Leydig cells (µl); VBLV, volume of blood vessels (µl); VLYM, lymphatic space volume (µl); VMAT, extracellular matrix volume (µl); VMAC, macrophage volumes (µl).
p values: a0.023, b0.045, c0.028, d0.009, e0.041, and f0.021.
Discussion
This study aimed to evaluate a paternal exposure to a HD from infancy to young adulthood of Wistar rats and the effects on two descendent generations, as this is noteworthy among the several environmental influences that may affect and cause damage to the male reproductive system.
Although the HD group presented higher EEC in the F0 and F1 generations, no statistical differences in body weight regarding the F0HD group in relation to the F0SD group or between F1HD group in relation to F1SD group were observed. Therefore, the assessed diet led to a greater conversion of ingested calories to weight gain in the F0HD group, especially concerning increasing fat mass, corroborating the findings reported by Fullston et al. Reference Fullston, Teague and Palmer11,Reference Fullston, Palmer, Owens, Mitchell, Bakos and Lane24 who studied two generations of C57Bl/6 mice, as well as Chambers et al., Reference Chambers, Morgan and Heger25 who evaluated rats.
Animal adiposity was evidenced by increased relative weights of perigonadal and retroperitoneal fat, albeit with no statistical differences of the means concerning final body weight. Although higher adiposity was noted in the F0HD group, this was not observed for the F1HD and F2HD groups. This demonstrates that this may not be passed on to descendent generations in the applied experimental model. Thus, higher EEC may be a phenotypic trait transmitted to the F1 generation, whose parents were offered the hypercaloric feed, although no conversion to adipose tissue occurred.
Contrary to what was observed for the F0 and F1 generations, the F2HD group presented higher body weight and NAL means and did not present significant differences regarding EEC or adiposity compared to F2SD. Epigenetic studies performed by King et al. Reference King, Dakin and Liu26 demonstrated that broods of F2 generation mice whose maternal progenitors received a HD displayed decreased glucocorticoid receptor gene expression, which is also related to body growth control. Thus, epigenetic changes in this gene in gametes may be responsible for the increased body size of the F2 generation, although this was not observed in the F1 generation and could explain the observed leap of this phenotypic characteristic between generations.
However, OGTT and ITT alterations were not observed between HD and SD groups in F0, F1, and F2 generations as opposed to the data reported by Fullston et al. Reference Fullston, Teague and Palmer11,Reference Fullston, Palmer, Owens, Mitchell, Bakos and Lane24 who verified higher glycemia and insulin resistance levels in C57Bl/6 mice of descendent generations, indicating transgenerationally present and transmissible characteristics. Dunn and Bale Reference Dunn and Bale27 also described that a high-fat maternal diet led to overweight, diabetes, and insulin resistance in male offspring, with a second generation transmission that was also resistant to insulin even without the presence of obesity mediated by epigenetic alterations. However, Chambers et al. Reference Chambers, Morgan and Heger25 indicated results similar to the present study, of no changes in the glycemic metabolism observed thought the OGTT in Sprague–Dawley rats submitted to a hyperlipid diet and their F1 descendants. These results may indicate that changes in glycemic metabolism in experimental models using rats may not be a transmissible phenotypic trait.
Chambers et al. Reference Chambers, Morgan and Heger25 did not observe increased TRIG and total cholesterol levels and their fractions in the paternal generation and F1 and F2 offspring of rats exposed to a hyperlipidic diet containing 45% fat. In the present study, an increase in mean serum concentrations of total cholesterol and its HDL and LDL and TRIG fractions in the F0HD generation was evidenced when compared to F0SD, which proves these diets efficiency in promoting dyslipidemia in the F0 generation. However, no changes in the F1 and F2 generations were noted, indicating that dyslipidemia does not appear to be a transmissible trait.
The evaluation of relative viscera weight can be a preliminary measure of functional activity. Reference Sellers, Morton and Michael28 Thus, F0 groups exposed to the HD presented statistical differences regarding decreased liver, spleen, and adrenal weight means and increased kidney weight (Table 6). This may indicate alterations in the organic functionality of the F0HD generation, although no clear scenario regarding serum and body weight evaluations was identified. The same visceral relative weight change pattern was not observed in F1 and F2 animals. However, an evident increase in the mean relative weight of the kidneys in the three evaluated generations (F0HD, F1HD, and F2HD) was observed (Table 6), albeit with no effect on serum CRE, which is commonly altered in cases of renal damage (Table 2). The observed changes in the mean F0HD and F2HD urea concentrations may not be biologically significant, as CRE concentrations did not follow the same pattern. Nevertheless, it was not measured arterial pressure in this work, and the effects of the HD on kidney could include the hypertension. Thus, more specific renal assessments are necessary to further understand the role of a paternal HD on renal offspring physiology.
Nasoanal length and relative organ weights of F0 generation rats receiving a standard diet (F0SD) or hypercaloric diet (F0HD) and their F1 and F2 offspring

Data are expressed as means ± standard deviation.
F1SD, group of F1 animals from generation F0 that received a standard diet; F1HD, group of animals of generation F1 from the F0 generation that received a hypercaloric diet; F2SD, group of F2 generation animals from the F0 generation that received a standard diet; F2HD, group of F2 generation animals from the F0 generation that received a hypercaloric diet; NAL, nasoanal length (cm); KW, relative mean weight of the kidneys (%); SW, relative spleen weight (%); LW, relative liver weight (%); AW, relative mean adrenal weight (%).
p values: a0.000, b0.000, c0.000, d0.000, e0.000, f0.00, and g0.000.
Regarding reproductive evaluations, it was evidenced that the hypercaloric feed led to alterations in reproductive organ weights of the F0HD group, with decreased total mean weights of the testicles and the testicular parenchyma, associated with an increase in the weight of the testicular albuginea and the relative weight of the seminal vesicle. Although no changes in the weights of other accessory sex glands were noted, decreased testicular weight was reflected in the testicular histometric evaluation, in which a decrease in the thickness of the HE was observed, demonstrating that spermatogenic activity may have been compromised by the effects caused by the applied diet, although without any reflection on sperm production capacity. In the case of paternal obesity, the involved pathways according to Sanchez-Garrido et al. Reference Sanchez-Garrido, Ruiz-Pino and Velasco29 are changes in the hypothalamic pathways in the Kiss1 offspring system that may be compromised by hyperleptinemia and consequently alter the dynamics of the hypothalamic-pituitary-gonadal axis.
In a study carried out by Esmaili-Nejad et al. Reference Esmaili-Nejad, Babaei and Kheirandish30 mice that received exogenous leptin doses presented lower relative testicle weight, as well as HE reduction. Haron et al. Reference Haron, D’Souza, Jaafar, Zakaria and Singh31 also verified that exogenous hyperleptinemia promoted a reduction in the SC of adult rats. Zhao et al. Reference Zhao, Zhai, Liu, Wu and Xu32 found that hyperleptinemia associated with increased expression of reactive oxygen species. These findings demonstrate that hyperleptinemia may be a pathway that may compromise spermatogenesis may be the pathway responsible for low testosterone concentrations and hypogonadism in mice that received a high-fat diet. Although the concentrations of both hormones were not determined herein, hormonal mechanisms may be involved, since HE reduction was also evidenced in the F0DH and F1DH generations.
In humans, a dietary intake rich in fatty acids has been correlated with reduced SC. Reference Chavarro, Mínguez-Alarcón, Mendiola, Cutillas-Tolín, López-Espín and Torres-Cantero33 Rato et al. Reference Rato, Alves and Dias34 reported that the ingestion of a hyperlipidic diet results in a greater amount of fatty acids that can accumulate in testicular cells and impair local lipid metabolism and, thus, deregulate the spermatogenesis and testosterone synthesis events. Thus, the greater lipid content associated with the dyslipidemia caused in animals belonging to F0HD could also be the mechanism involved in the testicular histometric findings of this group.
Concerning rats, Chambers et al. Reference Chambers, Morgan and Heger25 did not observe changes in testicular weight and fertility parameters in the paternal generation submitted to a hyperlipidic diet. However, in the experimental model used herein, an HFHS-type diet was able to cause alterations in the mean absolute weight, parenchyma and testicular tunica albuginea, in addition to histometric alterations such as reduction of HE. The results are similar to those reported by Ibáñez et al. Reference Ibáñez, Erthal and Ogo35 who also verified HE and SC reductions in Wistar rats that received a hyperlipidic diet from the juvenile period. However, reproductive changes that may be associated with possible tubular damage and spermatogenesis were observed associated with the hypercaloric diet used in the experimental model, although no changes in sperm concentration and morphology were observed. Since changes in male fertility promoted by obesity tend to manifest in the long term, Reference Jia, Feng and Ge36 one explanation for this may be the shorter animal evaluation time, ending in the young adult stage. A limitation of the present study was that it ended in the young adult phase and it would be interesting to observe the metabolism and fertility of the animals until their late phase.
The relative weight gain of the seminal vesicle may indicate fluid retention or increased secretion or increased activity of androgen hormones. As decreased testicular parenchyma in F0DH animals was observed, the increase in the weight of the seminal vesicle may be due to content retention due to insufficient contraction, related to alterations in sympathetic innervations or hypogonadism. Reference Revenig, Leung and Hsiao37
In the present study, the advancement of glans morphology may indicate that animals in the F1DH and F2DH groups became pre-pubescent at a younger age, which may be due to changes in secretion and/or action of androgenic hormones. Yamasaki et al. Reference Yamasaki, Sawaki, Noda, Muroi and Takatsuki15 reported precocity in the occurrence of these phases in animals exposed to androgenic drugs, which may result in puberty onset in rats. Léonhardt et al. Reference Léonhardt, Lesage, Croix, Dutriez-Casteloot, Beauvillain and Dupouy38 found that litters of rats from mothers who were submitted to food restrictions presented late prepubertal development, correlated with reduced levels of leptin. Thus, it was hypothesized that altered levels of this hormone in F1 and F2 could also justify the observed found, with higher inherited levels explaining the observed precocity.
A reduction of the HE in the F1HD generation was observed, similar to what occurred in the F0HD generation, but unaccompanied by weight reduction of the male reproductive system components. With regard to the histometric analysis, increased VDI and VIT in the descending generation F1 were observed, reflected in increased LYM, VLYM, and VLEY which is associated with a greater amount of smooth endoplasmic reticulum and also correlates with an increase in serum testosterone concentration, Reference Ewing, Zirkin, Cochran, Kromann, Peters and Ruiz-Bravo39,Reference Zirkin, Ewing, Kromann and Cochran40 as well as an increase in lymphatic space correlates with testosterone secretion. Reference Mendis-Handagama, Zirkin and Ewing41 Although this hormone was not determined, it can be related to the precocity of modification of the penile glans morphology of F1 animals in early development stages.
The F1 generation also, paradoxically, displayed decreased SC in the F1SD group. This is associated with a greater variability of SC than biological significance, as it was not accompanied by changes in the weight of the testicular parenchyma, albuginea, and other male reproductive system components and morphological spermatozoa evaluations.
Regarding F2, the mean testis weight of the F2HD group also displayed higher mean values, although unaccompanied by similar alterations in other histometric evaluations or in the weights of the other male reproductive system components, as well as in SC and morphology, thus not considered biologically relevant.
In studies evaluating transgenerational influences on male fertility, Navya and Yajuverdi Reference Navya and Yajurvedi42 observed transgenerational alterations in male reproductive disorders mediated by maternal obesity in rats exposed to a HD from pre-mating to lactation. Descendants presented obesity, decreases in the number of rounded spermatids and epididymal spermatozoa and reduction in serum testosterone and serum leptin levels. However, experimental studies concerning paternal factors are still scarce. Fullston et al. Reference Fullston, Teague and Palmer11 indicated change in reproductive health, in which male C57Bl/6 mice were fed a high-fat diet. The authors observed that induced obesity led to reproductive changes in the paternal generation, comprising increased expression of reactive oxygen species and spermatic morphological damage.
Although the present study did not observe similar results, the changes in gonadal weight noted in the F0HD group alongside the histometric changes evidenced in the F1HD groups may indicate alterations in the spermatogenic process.
Conclusion
A high calorie diet rich in fats and carbohydrates was efficient in promoting dyslipidemia, leading to a higher EEC, in turn reflected in increased adiposity in Wistar rats. In addition, male reproductive system alterations were also noted, as well as organic alterations. The rats descending from the HD demonstrated precocity at the onset of prepubertal development and histometric testicular changes which may indicate impairment. No changes in the relative weight of fats in the offspring or in the glycemic metabolism of animals from the three generations were observed.
Acknowledgments
Centro de Biologia da Reprodução of Federal University of Juiz de Fora
Financial Support
This work was supported by the Redes Mineiras de Bioterismo e Toxicologia - TOXIFAR – from the Fundação de Amparo à Pesquisa de Minas Gerais – FAPEMIG.
Conflicts of Interest
None.
Ethical standards
The authors assert that all procedures contributing to this work comply with the ethical standards of the relevant national guides on the care and use of laboratory animals of CONCEA (Conselho Nacional de Controle de Experimentação Animal) of Brazil and has been approved by the Ethics Committee on the Use of Animals of the Federal University of Juiz de Fora. The methodology applied in this study was approved and registered under number 03/2016.