Global ceramic coating materials production was 13.26 billion m2 in 2016, increasing to 13.55 billion m2 in 2017. Turkey was the eighth highest-producing country of ceramic coating materials, producing 355 million m2 of ceramic coating materials in 2017 (Cement, Glass, Ceramics and Soil Products Exporters' Association, 2018). Rapid urbanization and rapid population growth have accelerated the growth of the ceramic industry (Ministry of Development T.C., 2015). The selection of raw materials in the tile industry, one of the main subsectors of the ceramic industry, depends on the appearance requirements of the tiles, such as colour and behaviour after firing, which are related to mineralogical and chemical composition and particle-size distribution (Dondi et al., Reference Dondi1999).
An important set of parameters in tile characterization are the optical properties of the tile. Levels of solar reflection of traditional roof coverings have been studied extensively (Berdahl & Bretz, Reference Berdahl and Bretz1997; Bretz & Berdahl, Reference Bretz and Akbari1997; Prado & Ferreira, Reference Prado and Ferreira2005). There is insufficient quantitative information on the reflection of solar radiation of most roofing materials, so it is difficult for building designers to select appropriate tile materials. With increasing levels of urbanization, the absorption of solar radiation by tiles is just as important as their reflection of solar radiation.
The wavelength of incoming solar radiation varies between ~300 and 2500 nm. Ultraviolet (UV) radiation consists of radiation with wavelengths <400 nm, while infrared (IR) radiation consists of radiation with wavelengths >800 nm. UV-C (200–280 nm) radiation is absorbed significantly in the atmosphere, while UV-B (280–320 nm) and UV-A (320–400 nm) radiation may reach the Earth's surface. Exposure to UV radiation has negative effects on skin, causing skin cancer, burns, etc. (Barnes et al., Reference Barnes, Williamson, Lucas, Robinson, Madronich and Paul2019). Nevertheless, to our knowledge, the absorption of IR radiation by tiles has not yet been studied. In this study, we report the impacts of tiles, made from schist materials, on the absorption of solar radiation through their absorption of the visible, near-IR (NIR) and far-IR (FIR) wavelength regions.
Previous studies have examined various raw materials in tile production, including quartzite and granite sludges (Torres et al., Reference Torres, Manjate, Quaresma, Fernandes and Ferreira2007), epiclastic rocks (Di Gennaro et al., Reference Di Gennaro, Dondi, Cappelletti, Cerri, de' Gennaro and Guarini2007), fly ash (Rajamannan et al., Reference Rajamannan, Sundaram, Viruthagiri and Shanmugam2007), tabique wall samples (Sa et al., Reference Sa, Pereira, Soares, Pinto, Lanzinha and Paiva2016), rock dust (Sultana et al., Reference Sultana, Ahmed, Zaman, Rahman, Biswas and Nandy2015) and ceramic sludges (De Silva & Mallwattha, Reference De Silva and Mallwattha2018). Most of these studies have not produced applications for industry because they were performed in laboratory settings and did not perform scaling up of their findings. As an alternative to the clay raw materials, which are frequently used in tile production, schists may also be used. Schists are metamorphic rocks with large particle sizes derived from the metamorphism of mudstones or shales. Schists have been used as alternatives to claystones in cement production (Korkmaz & Hacıfazlıoğlu, Reference Korkmaz and Hacıfazlıoğlu2019). In addition, the usability of schists as filling materials (Korkanç et al., Reference Korkanç, Sener, Doğan and Baskara2017), the mineralogy of schists (Çağatay & Arda, Reference Çağatay and Arda1979), the properties of slates (schists) (Yagiz, Reference Yagiz2011), the colour changes depending on the degree of decomposition of schists (Saroglou et al., Reference Saroglou, Marinos and Tsiambaos2004) and the optical properties of schists (Afouxenidis et al., Reference Afouxenidis, Stefanaki, Polymeris, Sakalis, Tsirliganis and Kitis2007) have been studied. As the nature of schists is better established, their use in various industries will increase.
In this study, the chemical, physical and optical properties and industrial usability of schist raw materials in tile production were investigated. The tiles obtained from schists may be suitable for industry, and so their compliance with quality standards was investigated. We report the absorption of the visible, NIR and FIR wavelength regions by tiles made from schist materials. In addition, the properties of the tiles and their absorption of solar radiation were examined. In particular, the tiles’ absorption of UV and IR radiation was evaluated, as this could have beneficial applications for human health and the environment.
Materials and methods
The schist used in this study was obtained from the Rızapasa province of Bilecik in Turkey. The working area is located at 39°54'42"N, 30°14'09"E, as determined using a GPSMAP® 60CSx (Garmin, UK).
The mineralogical composition of the schist was determined using X-ray diffraction (XRD) with a Panalytical Empyrean X-ray diffractometer (Malvern, UK). The determination of the mineralogical composition provides important information regarding the raw materials used in production (Bayazit et al., Reference Bayazit, Adsan and Genc2020). The chemical composition of the schist was determined using X-ray fluorescence (XRF) spectrometry with a Panalytical Axios Max XRF spectrometer. The particle-size distribution of the schist was examined using dry sieving. All material was passed through a 1 mm sieve. In addition, information regarding the size-distribution ranges and surface topography of the schist was obtained using field-emission scanning electron microscopy (FESEM) with a Regulus 8230 FESEM instrument (Hitachi, Japan).
Humidity levels were determined using a moisture analyser. Small rectangular samples were obtained using a vacuum press device specially produced for Hatipoglu Gunes Tile and Brick Industry by Sermak Makina (Turkey). Samples were dried at 80°C (Ref-San brand, Ceramic Furnaces Industry, Turkey) and then fired in an electric laboratory oven (Ref-San brand, Ceramic Furnaces Industry) at 900°C, 950°C and 1000°C. After firing, the colour, water absorption and compressive strength values of the samples were determined and their compliance with today's TS EN 1304 (2016) standard was evaluated. The calibration of all devices used in tile production was approved by the Turkish Standards Institute.
Fourier-transform IR (FTIR) spectra of the schist tiles were collected using a Bruker Vertex 80v FTIR spectrometer at the Nanoboyut Research Laboratory (Turkey). A Globar-SiC 1100°C source lamp, KBr/deuterated lanthanum α-alanine-doped triglycine sulfate (DLaTGS) D301 detector operating at room temperature and a KBr beam splitter were used in measurements in mid-wave IR (MWIR), long-wave IR (LWIR) and FIR wavelength regions (2.5–25.0 μm). For optical measurements in the NIR (1.0–2.85 μm) wavelength region, background and sample spectra were collected using a tungsten lamp, an indium gallium arsenide (InGaAs) detector and a Ge-CaF2 beam splitter. Most IR radiation is absorbed by the gases in the atmosphere. For example, radiation with wavelengths of 5.5–7.5 μm is absorbed by H2O molecules. Therefore, measurements across the whole wavelength range under assessment of 2.5–25 μm were obtained under vacuum.
Results and discussion
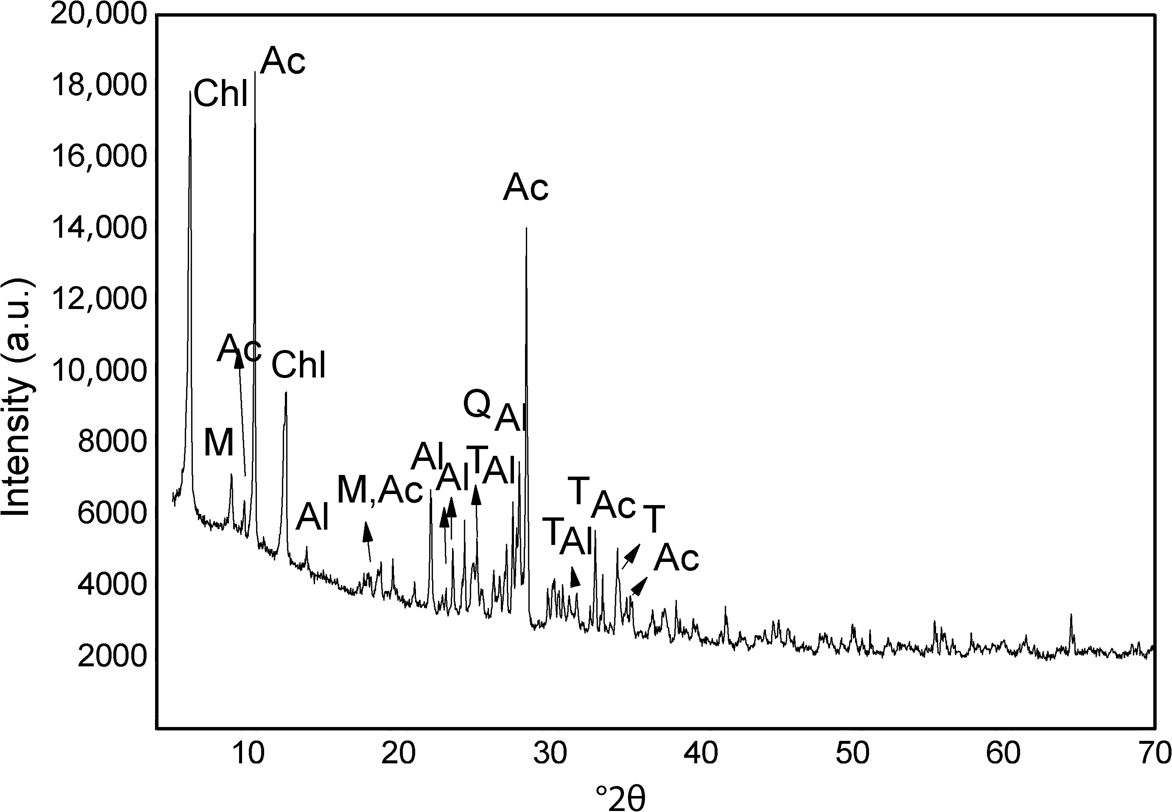
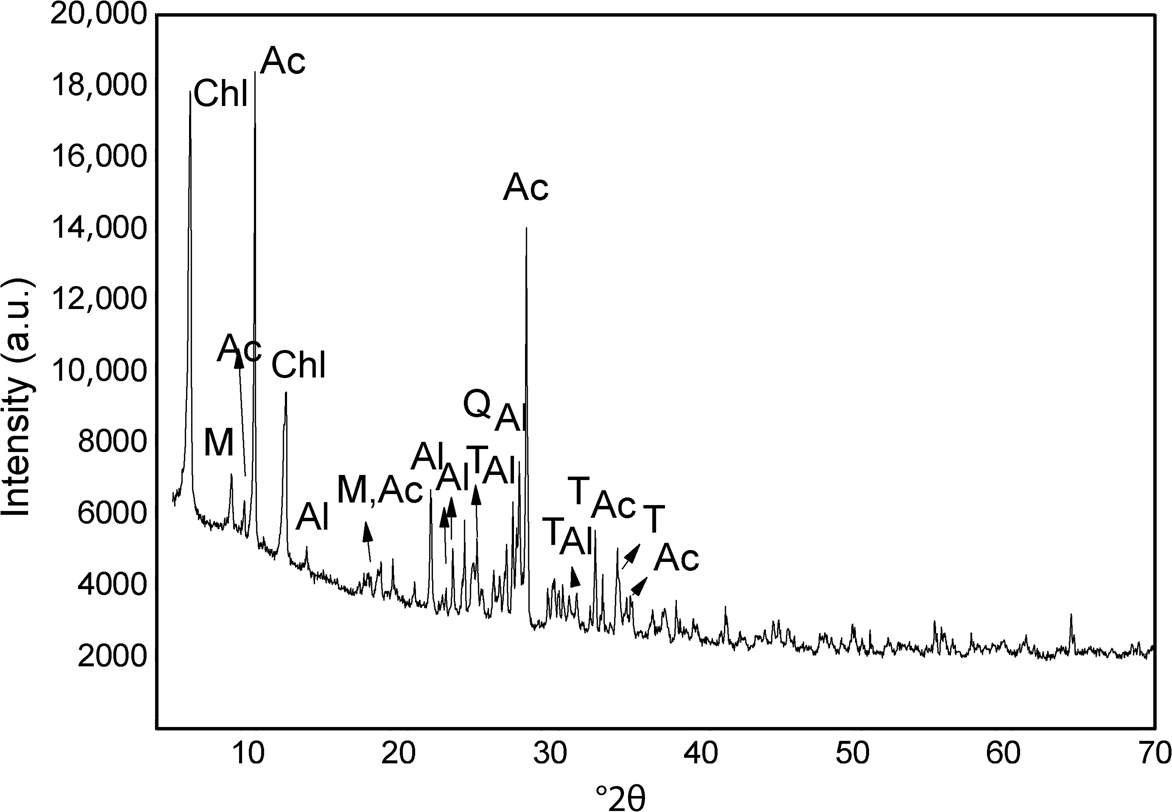
The XRD trace of the Rızapasa schist is shown in Fig. 1. The schist consists of chlorite (Ch), albite (Al), mica (M), titanite (Ti). quartz (Q) and actinolite (Ac). Similar mineralogical compositions have been determined in ceramic raw materials (Bayazit et al., Reference Bayazit, Adsan and Genc2020; Jordán et al., Reference Jordán, Meseguer, Pardo and Montero2020; Mousavi et al., Reference Mousavi, Tavakoli, Moarefvand and Rezaei2020). Significant increases in tensile strength, hardness and Young's modulus were observed as albite particle content increased (John, Reference John1992; Heinz & Haszler, Reference Heinz and Haszler2000). The abundance of quartz decreases with increasing firing temperatures of clay materials (Jordán et al., Reference Jordán, Meseguer, Pardo and Montero2020). Heating of albite increases the tensile strength and reduces the softness of ceramics (Doel & Bowen, Reference Doel and Bowen1996)
XRD trace of the Rızapasa schist. Ac = actinolite; Al = albite; Chl = chlorite; M = mica; Q = quartz; T = Al-rich titanite; V = Mg-vermiculite.
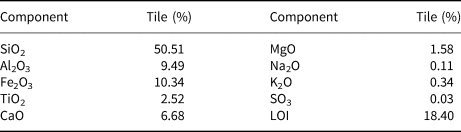
The chemical composition of the Rızapasa schist is listed in Table 1. The main chemical components are SiO2, Al2O3, Fe2O3 and CaO. At 700°C, CaCO3 begins to decompose to CaO, accompanied by the evolution of CO2, and porosity increases. The CaO reacts with the amorphous phase, which is derived from the decomposition of mica at increasing firing temperatures. An increase in water absorption is observed due to the release of CO2, which increases porosity (Sadik et al., Reference Sadik, El Amrani and Albizane2013).
Chemical composition of the Rızapasa schist determined using XRF spectroscopy.

LOI = loss on ignition.
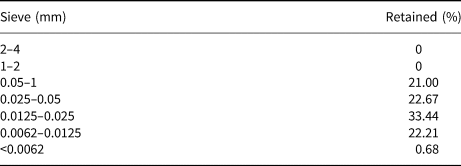
The particle-size distribution of the schist sample determined according to ASTM C 136 (2019) is listed in Table 2. The proportion of material capable of passing through a 63 μm sieve is 0.68%. The size fraction to be used in tile production includes particles of between 63 and 1000 μm.
Particle-size distribution of the Rızapasa schist.

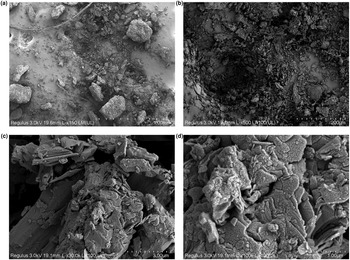
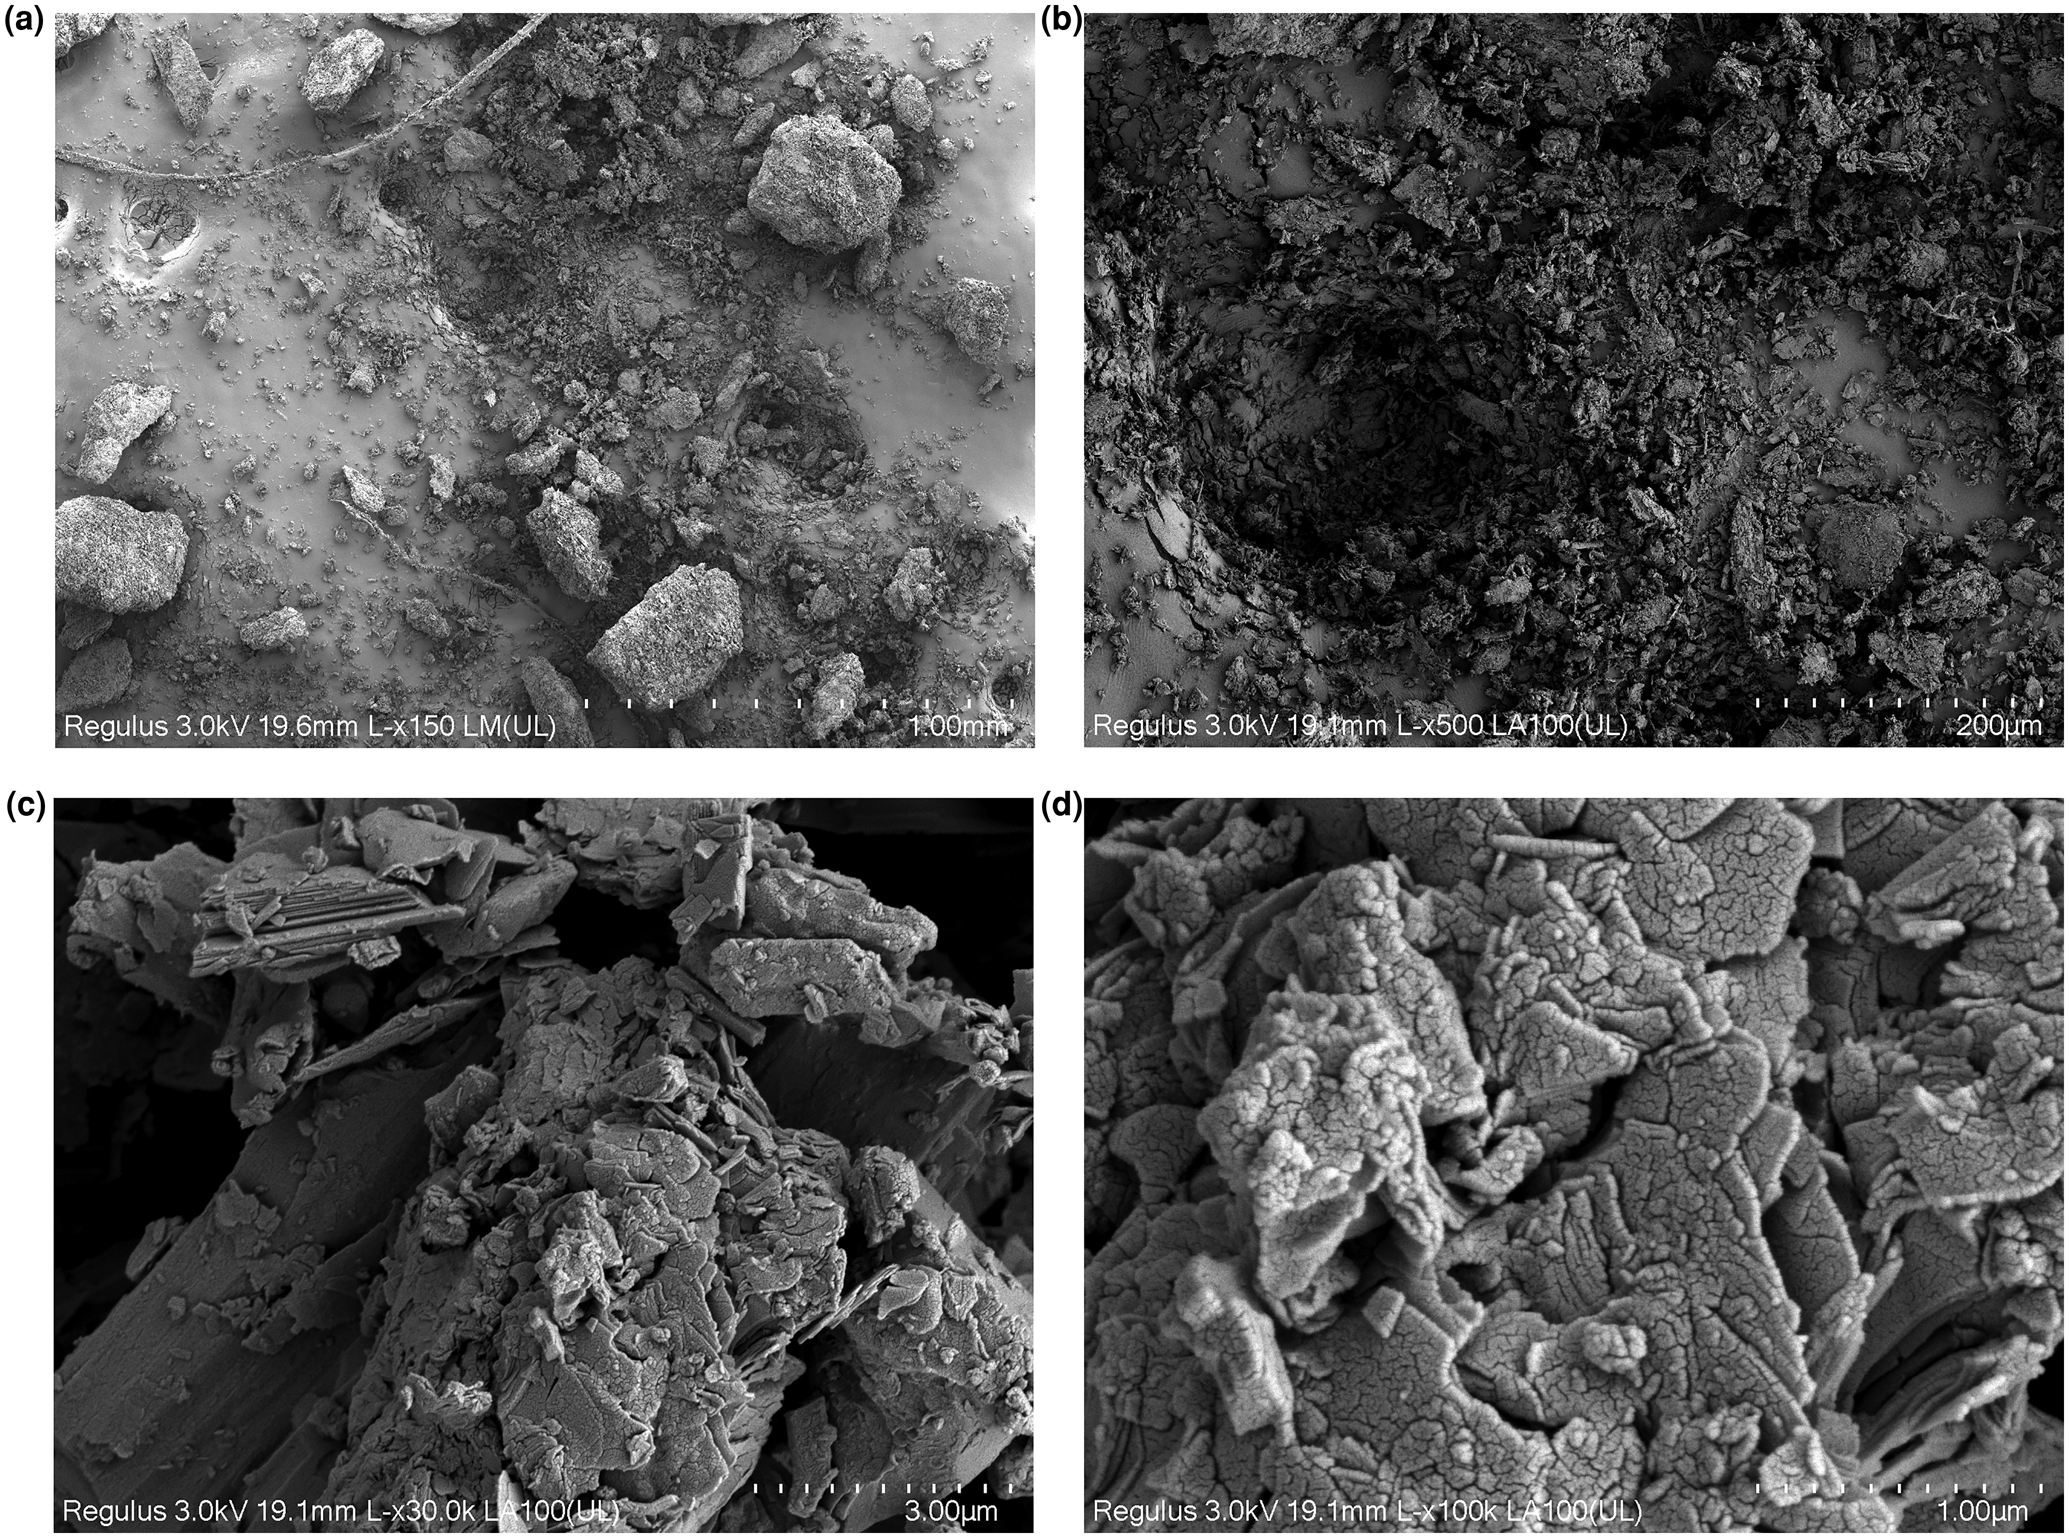
The surface topography of the Rızapasa schist sample is shown in Fig. 2. At low magnifications, the sample consists of particles ranging in size from 2.7 to 356 μm (Fig. 2a,b). Observations at higher magnifications reveal the presence of small cracks on the surface. The FESEM analysis shows that the particle size of the schist is suitable for tile production. In a similar study, clays consisting of particles of 200 μm in size produced a glassy phase and pore modification after firing at 995–1150°C (Jordán et al., Reference Jordán, Meseguer, Pardo and Montero2020). Ceramic materials with lower porosity are more resistant to compressive strength (Bressiani et al., Reference Bressiani, Genova and Bressiani2013; de Oliveira Piccolo et al., Reference de Oliveira Piccolo, Zaccaron, Teixeira, de Moraes, Montedo and de Oliveira2022).
FESEM images of the Rızapasa schist at (a) 150× magnification, (b) 500× magnification, (c) 30,000× magnification and (d) 100,000× magnification.
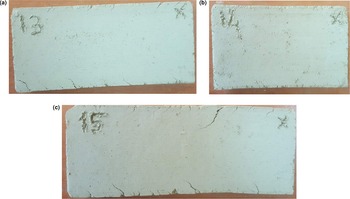
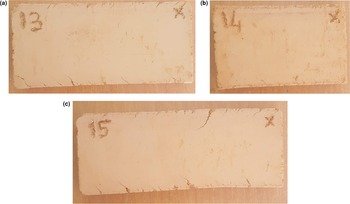
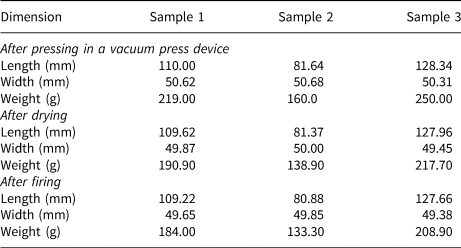
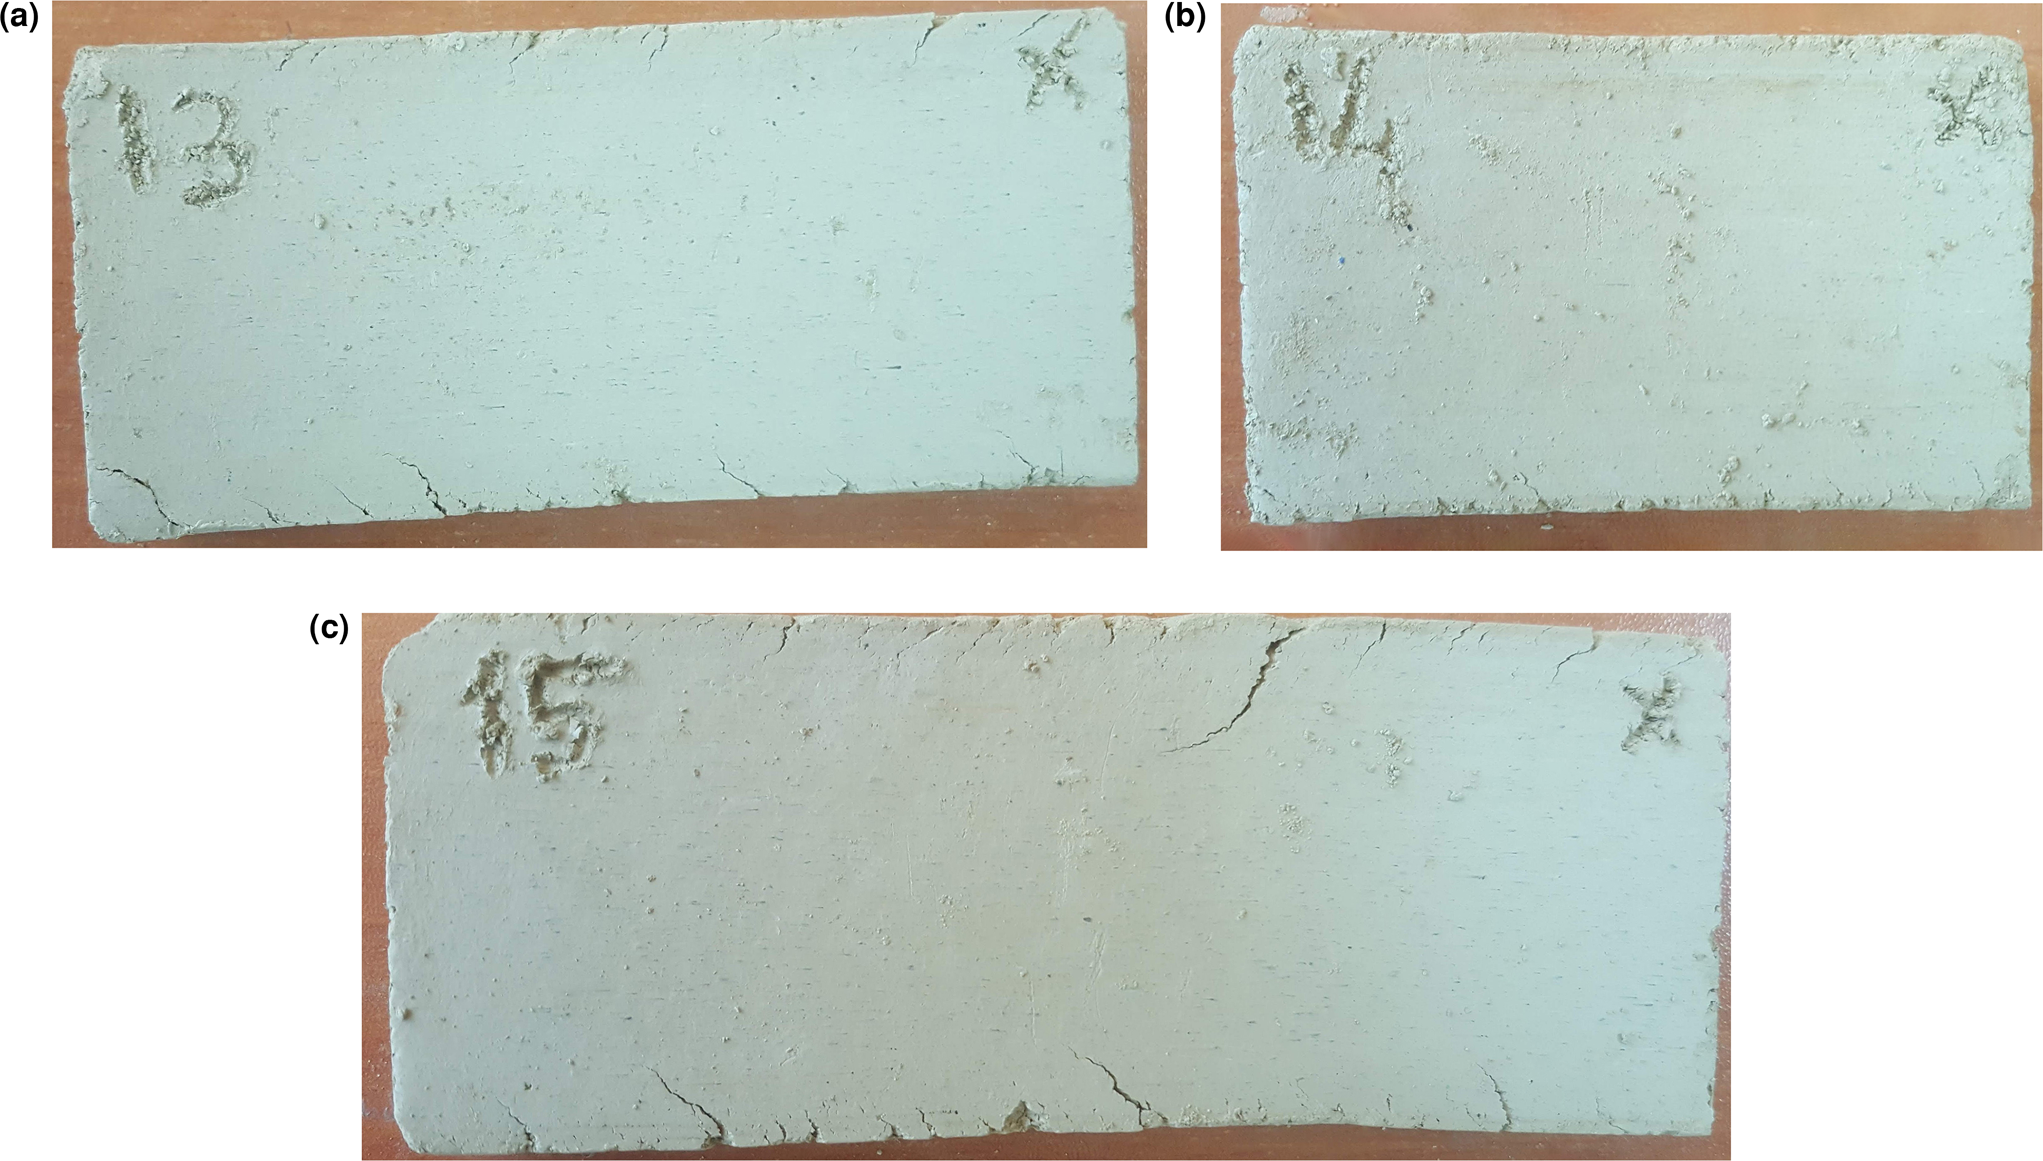
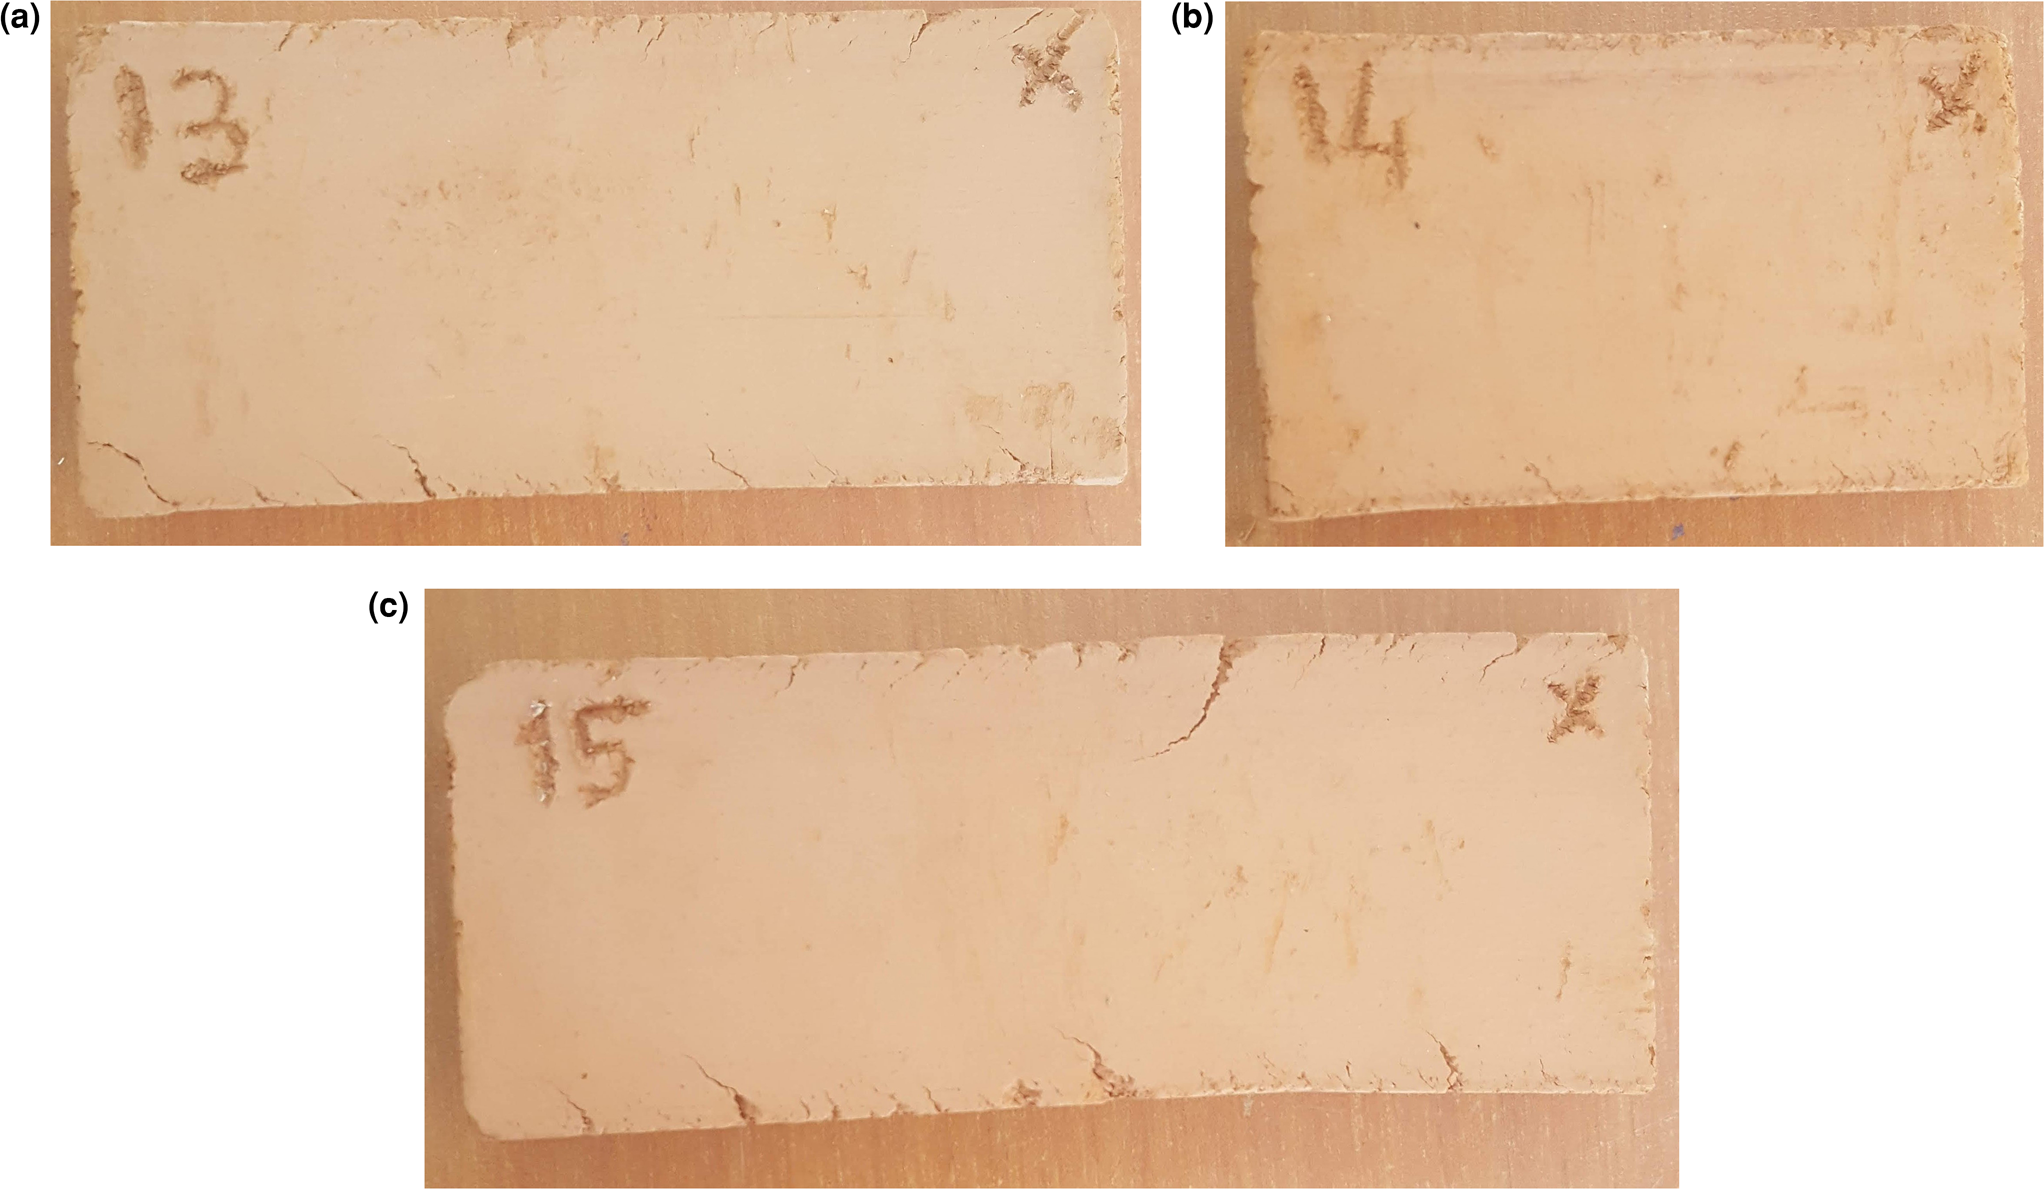
The moisture content of the schist was 16.73% as measured using the moisture analyser. Test specimens of ~5 cm × 10 cm were prepared by adding the schist and water mixture to a vacuum press device. The physical properties of the samples are listed in Table 3. Drying shrinkage values were determined by recording the physical length measurements (Wi) and weight measurements of the samples (We) after drying at 80°C (Table 3). Drying did not produce cracks on the surfaces of the samples (Fig. 3). Samples 1, 2 and 3 were then fired at 900°C, 950°C and 1000°C, respectively, and the influence of firing on compressive strength was recorded. The fired samples (Wf) did not show cracks on their surfaces (Fig. 4). Various firing cycles and transformations as well as particle morphologies are important in the formation of microcracks on ceramic structures and in the control of such microcracks (Cabrera et al., Reference Cabrera, Montins, Solsona and Sala2012; de Oliveira Piccolo et al., Reference de Oliveira Piccolo, Zaccaron, Teixeira, de Moraes, Montedo and de Oliveira2022).
Photographs of the schist samples after drying. (c) All samples were dried at 80°C.
Photographs of the schist samples after firing at (a) 900°C, (b) 950°C and (c) 1000°C.
Shrinkage values of the Rızapasa schist samples after drying and firing.

The drying and firing shrinkage values were calculated according to Equations 1 and 2 (Bacıoglu & Bacıoglu, Reference Bacıoglu and Bacıoglu2013) and are listed in Table 3.


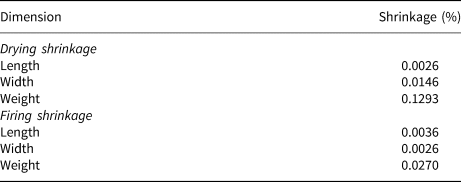
From these calculations, the average shrinkage values are given in Table 4.
Average shrinkage values of the Rızapasa schist samples after drying and firing.

The samples were placed in water for 24 h to allow the macropores and micropores of the samples to adsorb water (Bureau of Indian Standards, 2002; ASTM C1492, 2003; ASTM C830-00, 2016). Wet (Ww) and dry (Wd) sample weights were recorded and the water absorption rates (Wa) were calculated according to Equation 3 (ASTM C1492, 2003; De Silva & Mallwattha, Reference De Silva and Mallwattha2018).

The schist's average water absorption was calculated as 14.6%. Significant water penetration can lead to the growth of algae, green colouration, etc. Therefore, it is recommended that the water absorption of fired tiles should not exceed 18% (Bureau of Indian Standards, 2002; De Silva & Mallwattha, Reference De Silva and Mallwattha2018).
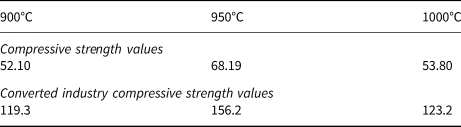
The effects of various firing temperatures on the compressive strength of the schist samples are shown in Table 5. To convert these results to those relevant for industrial production conditions, a conversion factor is used, which, in this case, is the ratio between the compressive strength values used in industry and the compressive strength values used in the laboratory. The converted industry compressive strength values for obtaining tile products from schist raw materials are also listed in Table 5. The breaking load of the furnace tile according to TS EN ISO 10545-4 (2019) and TS EN 1304 (2016) standards should exceed 120 kg m–2. The tiles obtained from schist raw materials meet standard requirements after firing at 950°C and 1000°C. Due to the lack of previous studies on the production of tiles from schists originating from Rızapasa or similar locations, these compressive strength values were compared with those recommended in tile production standards. Topolář et al. (Reference Topolář, Kocáb, Šlanhof, Schmid, Daněk and Nováček2020) placed a mechanical load on a reinforced concrete tile in increments of 5 kN m–2, starting from 10 kN m–2 (0.10 kg cm–2). When the mechanical load on the concrete tile reached 35 kN m–2, the stress on the structure increased with further increase of the load. The compressive strength measurements obtained from the schist in the present study are satisfactory when compared to the compressive strength measurements recorded for red clays (Guimarães et al., Reference Guimarães, dos Santos, da Cruz Thedoldi and de Lima2021).
Temperature-dependent and converted industry compressive strength values of the Rızapasa schist samples (kg cm–2).

Due to the fact that clay raw materials have a significant impact on the productivity and the physical, chemical, biological and physicochemical properties of soils, strict regulations make it difficult for mining investors to obtain environmental and zone permits (Ministry of Development T.C., 2015).
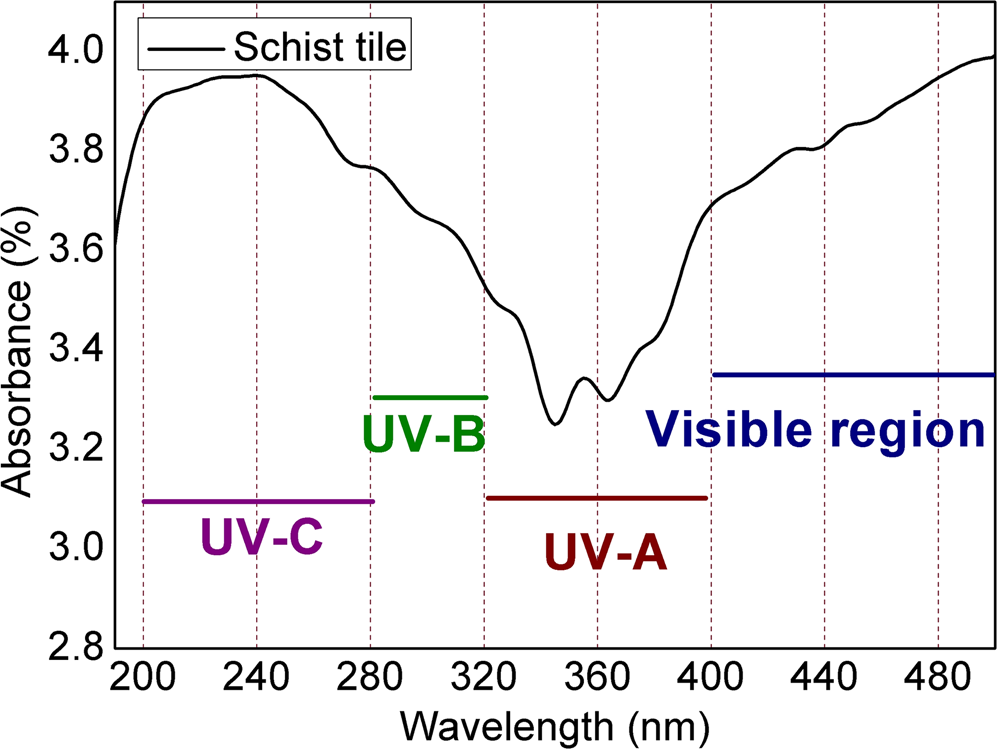
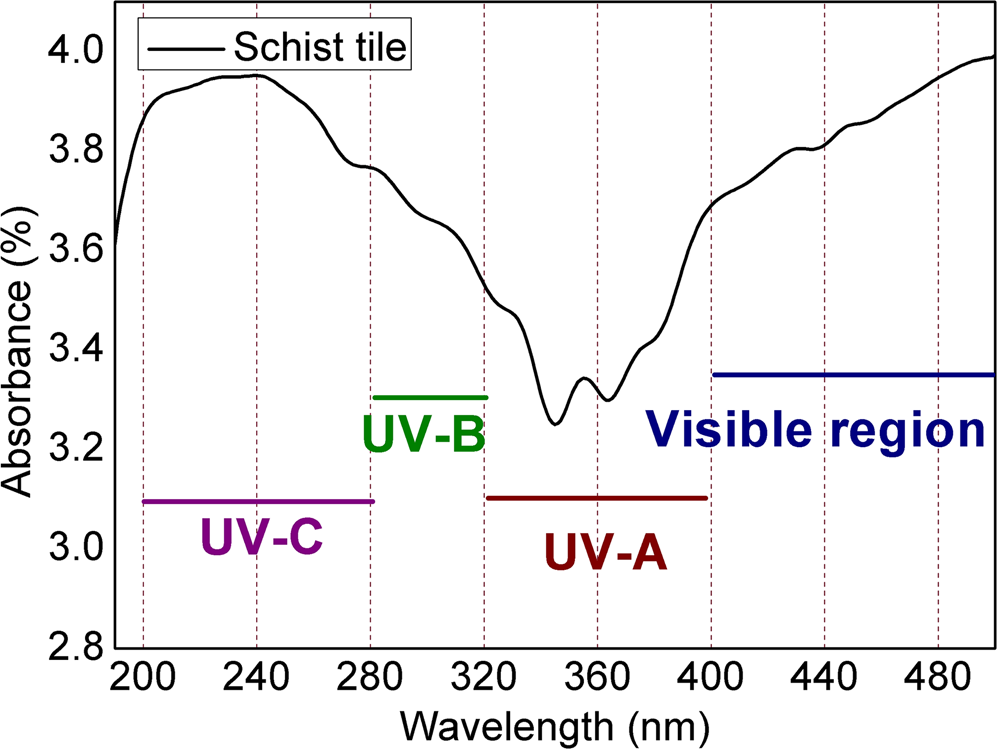
The tiles produced from schist materials absorb in the UV wavelength region (Fig. 5). UV-C (200–280 nm) radiation is absorbed significantly in the atmosphere, while UV-B (280–320 nm) and UV-A (320–400 nm) radiation may reach the Earth's surface. In addition, harmful UV-A (320–400 nm) radiation is not absorbed by the atmosphere, but schist materials absorb a portion of UV-A radiation. The effect of exposure to UV-A radiation leading to skin cancer attracted a lot of attention after this was first reported 30 years ago (Setlow et al., Reference Setlow, Grist, Thompson and Woodhead1993). It has since been demonstrated that UV-A radiation has a much more significant impact on the development of melanoma than was understood previously (Wood et al., Reference Wood, Berwick, Ley, Walter, Setlow and Timmins2006; Barnes et al., Reference Barnes, Williamson, Lucas, Robinson, Madronich and Paul2019).
Absorption of IR radiation by the schist in the UV wavelength region.
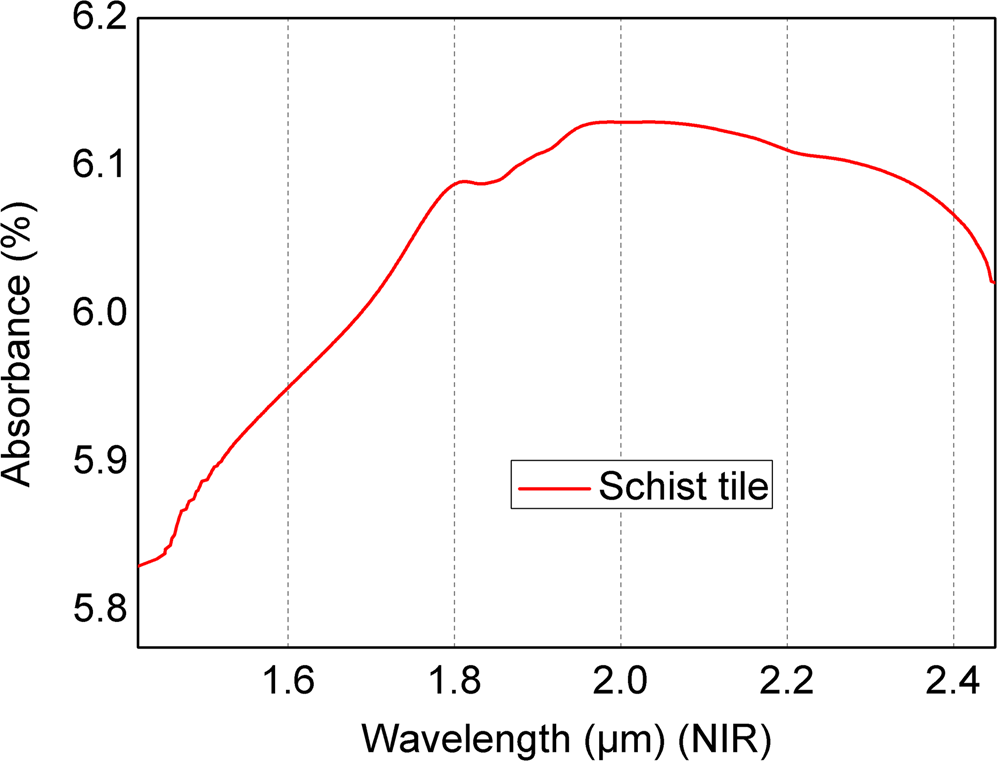
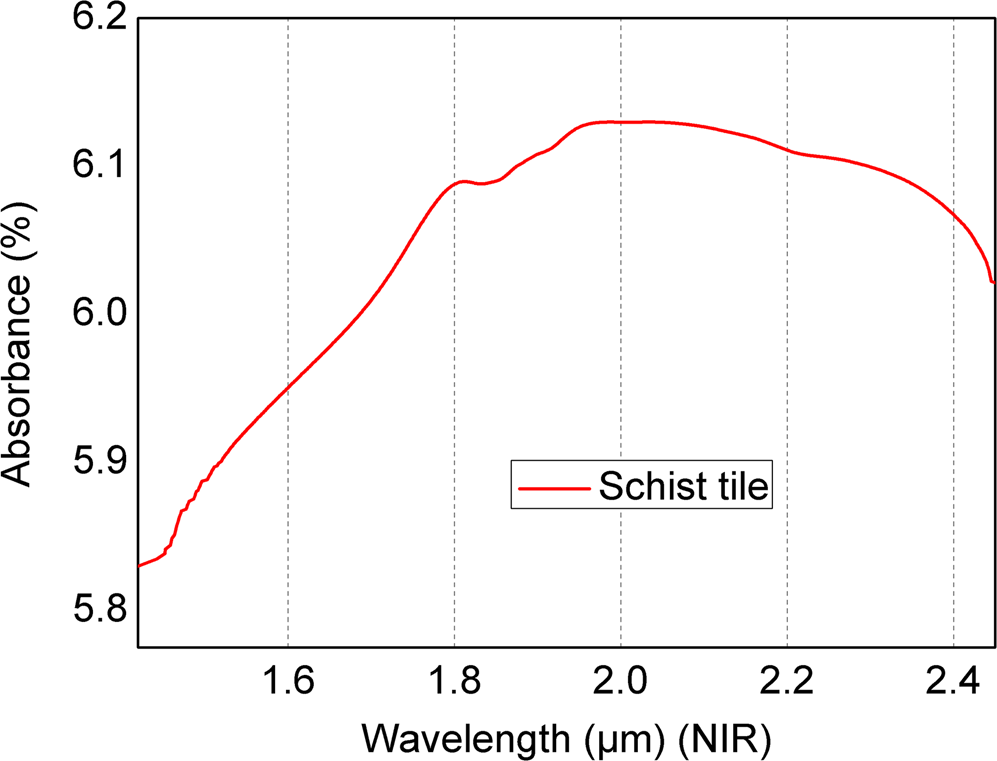
The ozone layer absorbs radiation in the NIR wavelength region. Because of its IR radiation absorption, ozone is an important greenhouse gas. When Fig. 6 is examined, it can be seen that the schist tile could contribute to reducing the human-induced greenhouse effect through its absorption of the NIR wavelength region.
Absorption of IR radiation by the schist in the NIR wavelength region.
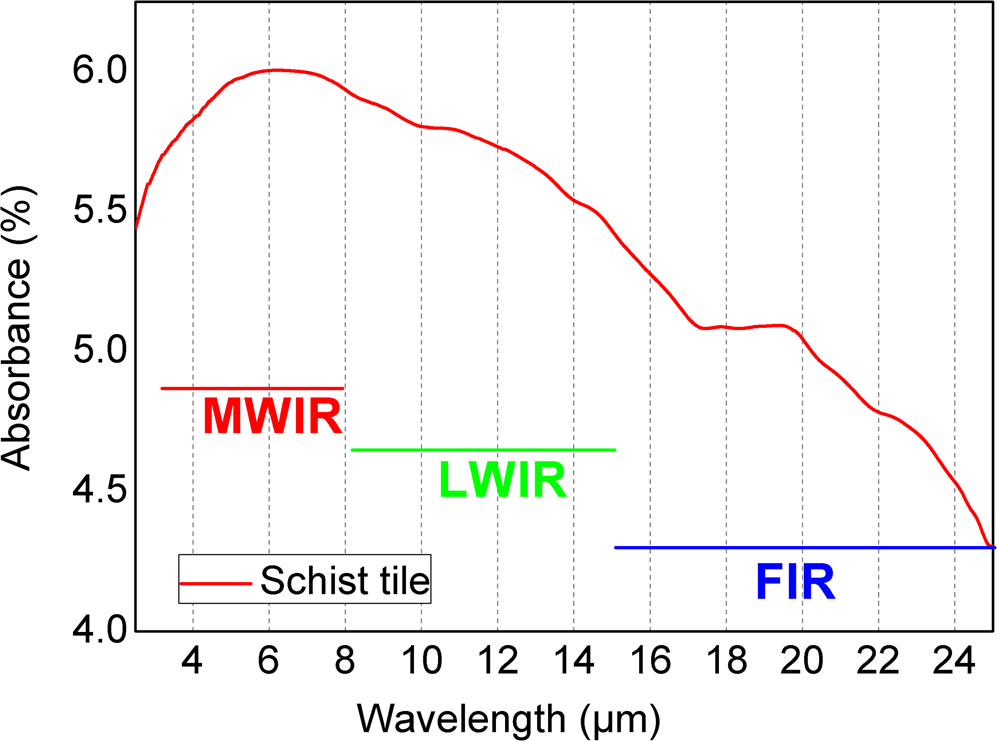
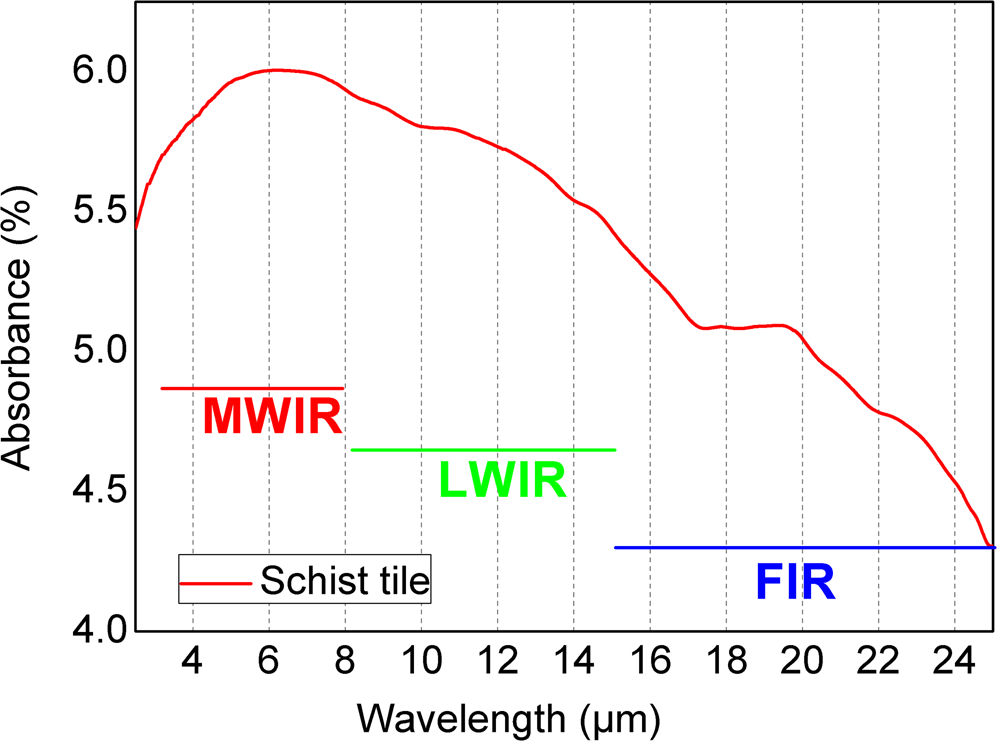
The schist tiles absorb in the MWIR, LWIR and FIR wavelength regions (Fig. 7). FIR radiation is a type of radiation that heats objects without heating the air. Apart from heating, it provides many physiological benefits to the human body (Barnes et al., Reference Barnes, Williamson, Lucas, Robinson, Madronich and Paul2019).
Absorption of IR radiation by the schist in the MWIR, LWIR and FIR wavelength regions.
Due to the high atmospheric absorption of IR radiation, the experiments in this study were performed under vacuum (Figs 6 and 7).
Conclusions
The Rızapaşa schist, which is used as a raw material in the tile industry, is a useful material for various stages in the tile-production process. The compressive strength values of the samples fired at various temperatures render them suitable for industrial production according to the current industry standard (TS EN 1304, 2016). The level of water absorption was also acceptable. This work is significant due to the lack of studies on the production of tiles from schist materials.
Since the problem of lime explosion on the surface of the tile caused by coarse-grained carbonates is encountered frequently in tiles produced from clays, the introduction of clays into a separator machine to make such products more marketable increases production and transportation costs and thus affects competition in international markets. An important advantage of the Rızapasa schist is that it does not require the use of a separator machine. This reduces production costs.
Environmental pollution arises due to the significant dust emissions that occur when loading raw clay materials onto the transportation vehicles. Such dust can reduce occupational safety and increase occupational diseases. The Rızapasa schist produced much less dust compared to that produced by clays.
The schist tiles in this study absorb harmful UV-A radiation that the ozone layer cannot absorb. In addition to their use in tile production, schist materials are also open to development in many areas such as health due to their absorption in the FIR region of the electromagnetic spectrum.
Acknowledgements
The authors thank Hatipoglu Gunes Tile and Brick Industry, Inc., in Kutahya for the use of their tile production laboratory in this study and Professor Dr Ugur Serincan for the opportunity to take FTIR measurements of the samples at Nanoboyut Research Laboratory, Eskisehir.
Conflict of interest
The authors declare none.