INTRODUCTION
Federal systems are defined by divisions of powers, and representatives in these systems are responsible for addressing only those issues that fall within their areas of jurisdiction. But how do representatives in federal systems behave in practice? Are they willing to cross jurisdictional boundaries to represent their constituents? How do they respond to requests for help in shared issue areas where jurisdictional boundaries are blurry or non-existent?
Political representatives perform many different roles (e.g. Eulau and Karps Reference Eulau and Karps1977; Mansbridge Reference Mansbridge2003; Montanaro Reference Montanaro2012; Pitkin Reference Pitkin1967). In this paper, we focus on service representation, or the constituency-level work that representatives do to help individuals negotiate government programs and services (Eulau and Karps Reference Eulau and Karps1977). Although very different from conventional notions of policy representation, service representation has become an important part of the elected representative’s job (Herrick Reference Herrick2011; Ellickson and Whistler Reference Ellickson and Whistler2001), and scholars have identified a number of factors associated with practices of service representation (e.g. Freeman and Richardson Jr Reference Freeman and Richardson1996; Jewell Reference Jewell1982; Ellickson and Whistler Reference Ellickson and Whistler2001; Johannes Reference Johannes1980; Halligan et al. Reference Halligan, Krause, Williams and Hawker1988; Herrick Reference Herrick2011; Thomas et al. Reference Thomas, Loewen and MacKenzie2013).
In this study, we use data from a field experiment to examine how representatives in Canada respond to appeals for help that fall (1) within their jurisdiction; (2) outside their jurisdiction; and (3) within shared issue areas. More specifically, this paper seeks to answer two related research questions:
1. Are representatives willing to cross jurisdictional boundaries to serve their constituents?
Representatives may be inclined to adhere to jurisdictional boundaries because their time and resources are limited, and they may therefore be unable to respond to all requests with equal attention. If they expect fewer electoral benefits from helping individuals in areas outside their jurisdiction, they are likely to focus their attention on requests that fall within their areas of responsibility. In addition, representatives may refrain from addressing issues outside their jurisdiction out of respect for constitutional divisions of powers.
Alternatively, representatives may be inclined to actively help constituents whenever possible, regardless of jurisdictional constraints. Representatives from different levels of government in a federal or multilevel system do not compete against each other directly for votes, but they may have incentives to help voters access government services even if those services are not in their jurisdiction. These incentives are likely to exist because, from the perspective of a representative, a voter is a voter and it does not matter if the individual is seeking services from one level of government or another. In either case, helping the voter access services might help the representative win votes in the next election. In short, whenever citizens fail to make distinctions between levels of government, there are incentives for elected officials to respond in kind.
In Canada, the boundaries between federal and provincial jurisdictions are blurred in the minds of many voters (Franks Reference Franks2007; Cutler Reference Cutler2008), and representatives often receive requests for help in areas outside their jurisdictions (Docherty Reference Docherty2005). Only 10% of the representatives surveyed by Docherty (Reference Docherty2005) said they would never try to help citizens with issues that fall outside their jurisdiction. Based on these findings, we expect representatives to respond to requests for help, even when these fall outside their jurisdictional areas.
2. Are representatives willing to cross jurisdictional boundaries to serve their constituents?
Shared issue areas represent a potential pitfall for effective representation in federal systems, or indeed in any system of multilevel governance. Where jurisdictional boundaries are not clearly established, representatives who are pressed for time may be inclined to shirk their duties if they believe other representatives will take up the slack. Shared issue areas therefore have the potential to create coordination failures and less than optimal practices of representation. If each representative is inclined to leave the task to someone else, requests for help in shared issue areas may go unanswered. This might be called a ‘free rider response.’
Alternatively, representatives might adopt a ‘competitive response.’ They might strive to respond as quickly and helpfully as possible to requests in shared issue areas, knowing that they may have to work harder to be recognized as helpful if citizens have access to other representatives who also have jurisdiction in those areas. In this case, rather than creating coordination failures, shared issue areas (or overlapping representational responsibilities of other types), might incentivize representatives to pay as much or more attention to requests for help in these areas.
Although these questions have not been studied extensively in federal systems, scholars have examined practices of service representation in multimember electoral districts (MMDs). Shared jurisdictions in federal systems and MMDs create similar incentives. In both cases, representatives have to decide whether to respond to inquiries themselves or leave them to others with jurisdiction in the same issue areas. Results from studies of service representation in MMDs are mixed (Snyder and Ueda Reference Snyder and Ueda2007). Freeman and Richardson Jr (Reference Freeman and Richardson1996), for example, find that representatives in MMDs report spending more time helping citizens than those in single member districts. This provides some support for the competitive response hypothesis.
Likewise, Snyder and Ueda (Reference Snyder and Ueda2007) find that metropolitan areas received less money in intergovernmental transfers from the state after they switched from MMDs to single member districts. Although they do not have data about the behavior of individual representatives, Snyder and Ueda (Reference Snyder and Ueda2007) argue that their findings provide evidence that challenges the free-rider hypothesis. They argue that representative in MMDs may be better positioned, and incentivized, to work together to secure intergovernmental transfers that will benefit the city (or county) as whole.
In contrast, Herrick (Reference Herrick2011) finds that representatives in MMDs are less likely to spend time on service work, not more—at least when the legislature is in session. When the legislature is not in session, representatives in MMDs spend less time on constituency work than those in single member districts, but the differences are negligible (119–120). These findings provide some support for the free-rider response hypothesis.
The studies cited above rely on either aggregate-level policy outcomes or on the self-reported behaviors of representatives. By contrast, our study uses experimental methods to examine the actual behavior of representatives and their offices. We also shift the focus from MMDs to areas of shared jurisdiction in federal systems. This shift is of interest because it suggests that the incentives facing representatives in MMDs may be less context specific than they are often thought to be. Like those in MMDs, representatives in federal or multilevel systems may face strong incentives to either work harder or shirk in areas of shared jurisdiction. To our knowledge, ours is the first study to use experimental methods to examine the free-rider hypothesis as it applies to the politics of representation in a federal system.
Our findings can be summarized briefly. Representatives in our study were willing to cross jurisdictional boundaries to help individuals obtain government services, but they were not equally helpful in each issue area. They were systematically less helpful on issues that fall outside their jurisdiction. Nevertheless, they were equally helpful on shared issues as on those within their own jurisdictions. These findings indicate that, although there is a potential for coordination failures, representatives are not inclined to shirk their duties or leave tasks to others in shared issue areas. In short, federalism does not appear to impair effective practices of service representation, even in share issue areas.
CASE SELECTION
This study was conducted among 202 randomly selected Canadian elected officials at both the federal and provincial levels. Each was randomly assigned to receive two realistic emails from fictional constituents, each containing a request for help in one of three issue areas: access to family doctors (an exclusive provincial domain), access to employment insurance (an exclusive federal domain), or access to student loans (a shared issue area).
Canada is well suited to a study of this sort. While divisions of powers between the federal and provincial governments are clearly defined in the constitution,Footnote 1 there are both areas of shared jurisdiction and much shared activity in otherwise exclusive areas of responsibility. Student loans fall into the latter category: although education is a provincial responsibility student loans may be obtained from either level of government, or both.
EXPERIMENTAL DESIGN
The following are the details of our experimental design:
1. Selection of representatives: A total of 202 subjects were randomly selected from the population of elected representatives in Canada. A total of 101 were drawn from the population of federal Members of Parliament—this equals approximately one-third of the 308 seats in the Canadian House of Commons. Another 101 representatives were drawn from nine of ten provincial legislatures.Footnote 2 At the federal level, representatives were selected in proportion to each provinces’ share of the seats in the House of Commons. Provincially, the number of representatives drawn from each province was a function of the number of provincial politicians in the province divided by the total number of provincial politicians in the country.
2. Assignment of treatment: Each representative received two emails, one in each of two separate waves. The first wave was sent on February 11, 2010. The second wave was sent on May 4, 2010.Footnote 3 There were four treatment areas, each of which was assigned randomly and independently:
a. Issue area: In the first wave, each representative received an email request for help in one of three issue areas: health care (provincial responsibility); employment insurance benefits (federal); or student loans (shared).
Each email was accordingly classified as being IN a representative’s jurisdiction, OUT of a representative’s jurisdiction, or in the SHARED area of jurisdiction. In the second wave, each representative in the sample received a second email request for help in one of the two other issues areas.
b. Email format: Two email formats were used, to ensure that the two emails received by each member in the two separate waves would be distinct from each other. Both formats conveyed similar information in slightly different ways, and both made a polite but urgent plea for help at the beginning of message as well as an expression of thanks near the end.
c. Sender: The emails were sent from 15 fictional constituents. Each representative was randomly assigned to receive an email from one of these 15 constituents in the first wave and a different sender in the second wave of the study. To reflect the cultural and linguistic diversity of Canada, five constituent names were chosen to be easily identified English names (e.g. Brent Moore, Brenda Smith), five were chosen as easily identified French names (e.g. Marie-Eve Desjardins, Patrick Bastien-Bodet), and the remaining five were selected as ethnic names that might be familiar in minority communities (e.g. Hosne Patel, Zan Wong).
d. Indication of support: In addition to these other treatments, each email either contained or did not contain a positive indication of past support. Each representative received one of these treatments in the first wave of the study and the other treatment in the second wave.Footnote 4
Balance tests of the issue area and the non-treatment variables suggest that they are statistically unrelated (see Section C).
Table 1 presents the number of members in each condition, by level of government.
Treatment Assignment by Level of Governmenta

a The table demonstrates the number of federal and provincial politicians assigned to each treatment by round. The N is 101 politicians per level. Raw numbers thus correspond closely to the percentages of subjects within each row within each round.
Dependent Variable
Our principal dependent variable is an evaluation of the helpfulness of a subjects’ response, scored from 0 to 5. Each score is the average of two scores, produced independently by two research assistants. Prior to evaluations, the sender and the recipient of the email were blinded, as was any indication of support for the politician. The coders were instructed simply to assess the helpfulness of each email on a scale of 0 to 5, and to score non-responses as 0. They were not familiarized with the randomization schedule or the objectives of the study. Each assistant provided a score for every response.
Evaluation of the coding suggests broad agreement between the coders: scores are highly correlated (r = 0.84), internally consistent (α = 0.91), and differences in scores are unrelated to the treatments contained in the email (likelihood ratio χ2 = 1.48, p = 0.48). In Appendix 1, we conduct robustness checks with individual scores as the dependent variable, and our results largely hold.
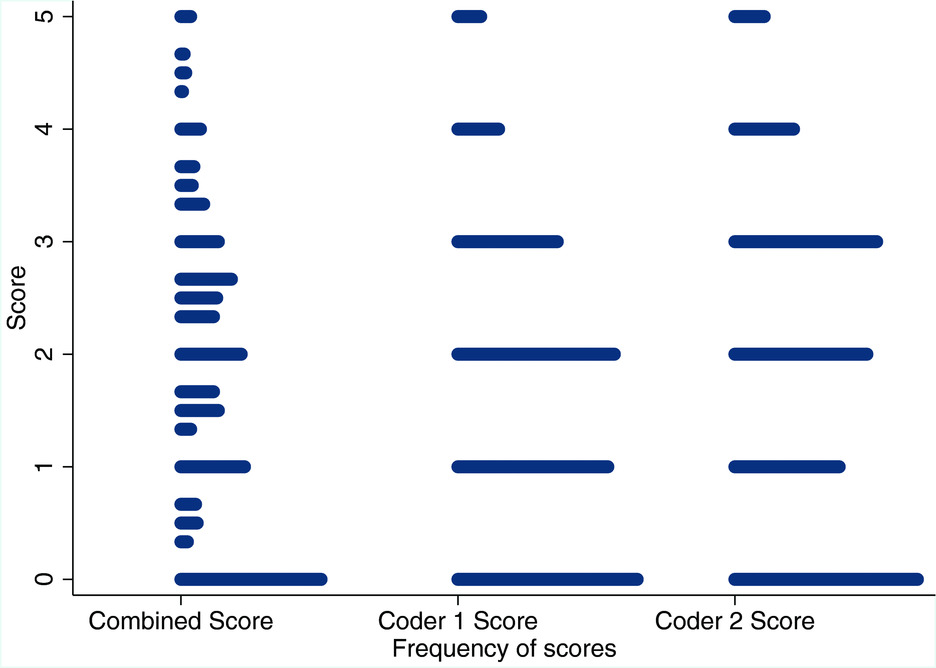
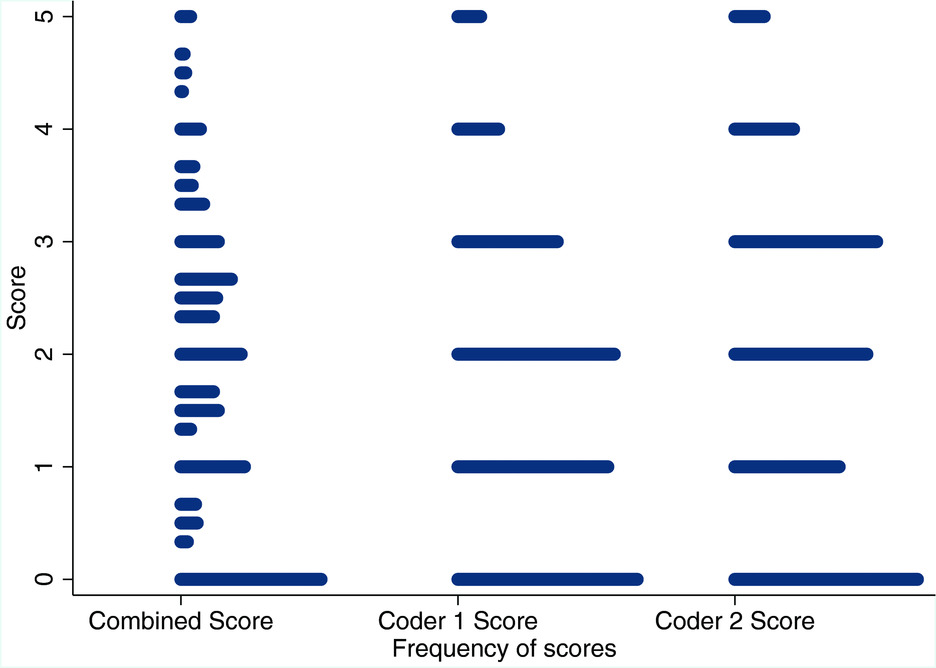
The mean score is 1.76 (95% CI 1.63, 1.89) with a full range of 0 to 5. The distribution of both scores and the combined scores is provided in Figure A1 in Appendix 1.
Empirical Strategy
For our first hypothesis, we simply examine the average level of helpfulness for requests outside of an MPs jurisdiction. If these return a positive and significant score, then there is some evidence of helpfulness.
To assess our second hypothesis, we estimate a regression of the form:
 $$\begin{equation}
Y_{ij}=\alpha +\beta _{1}In_{j}+\beta _{2}Out_{j}+X_{i}\gamma _{i}+X_{j}\gamma _{j} +\varepsilon _{ij}
\end{equation}$$
where Y ij is the helpfulness of representative j in response to sender i. Our key variables are captured by In and Out, which indicate whether representative j received a request for help in a jurisdiction which is exclusively inside or outside of their jurisdiction. Requests for assistance in a domain that is shared by national and provincial politicians thus constitute a comparison group. We also include a series of control variables indicating characteristics of representative j and the email sender i, captured by the vectors γj and γi, respectively. All estimates rely on robust standard errors, clustered by member.
We compare the values on the In and Out coefficients. If the “competitive mechanism” is operative, representatives should be equally responsive to appeals for help in issues of shared and exclusive jurisdictions, as they compete with their counterparts at the other level of government. This would be evidence that federal systems can function to enhance representation in ways suggested by some theorists of federalism.
If the “free ride mechanism” dominates, representatives may be less responsive or less willing to help citizens with appeals that fall exclusively within the purview of other representatives or within areas of shared jurisdiction. This would suggest that federal systems do not enhance service representation and may be beset by collective action problems when it comes to providing active representation in areas of shared responsibility.
RESULTS
The average helpfulness score for in, shared, and out jurisdictions was 1.85 (95% CI 1.61, 2.08), 1.91 (95% CI 1.69, 2.14), and 1.54 (95% CI 1.32, 1.76), respectively. Unpaired t-tests suggest that helpfulness scores for out of jurisdiction requests are significantly lower than those requests for in jurisdiction help (t = 1.90, p = 0.06) and shared jurisdiction help (t = 2.37, p = 0.02). There is no difference in scores between in jurisdiction and shared jurisdiction requests (t = 0.40, p = 0.69). These results do suggest, however, that representatives are willing to cross jurisdictional boundaries to help constituents.
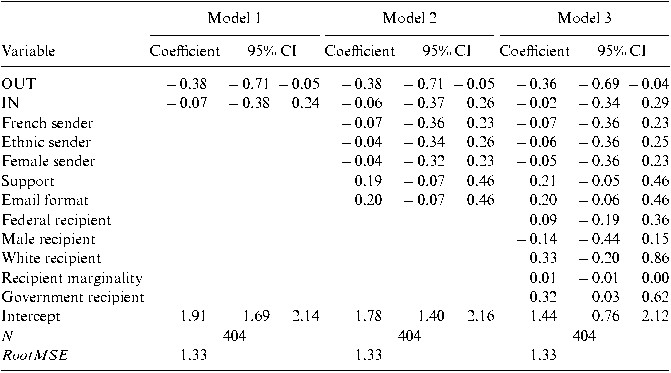
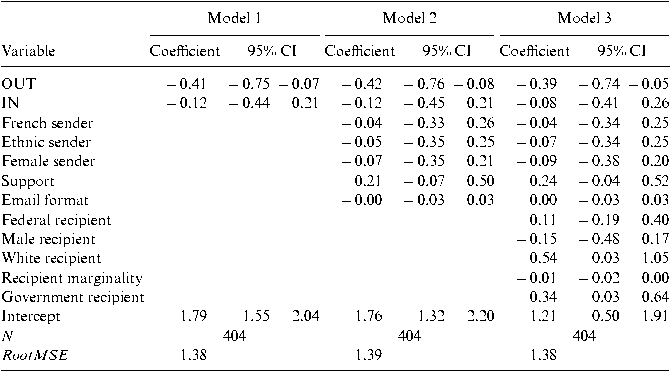
Table 2 presents our main results using three models. In each model, we include an indicator variable for whether the constituent’s request for help was in the politician’s jurisdiction (IN) or out of the politician’s jurisdiction (OUT). Consequently, the respective point estimates and confidence intervals indicate whether helpfulness is significantly different from when a representative receives a request in an area of shared jurisdiction. Model 1 includes the treatment variables only. Model 2 adds controls for sender characteristics, and Model 3 includes additional recipient controls, including whether the receiving politician is white, is a member of a governing party, and her margin of victory in the last election.
Helpfulness by Issue Areaa
a Model is ordinary least squares linear regression. N = 404. Standard errors are clustered on members. Tests of OUT = IN are (F(1, 201)2.89, p = 0.057), (F(1, 201)3.96, p = 0.048), (F(1, 201)4.41, p = 0.037 respectively).
The results in Model 1 suggest that politicians are significantly less helpful when an issue is outside of their jurisdiction than when it is in their shared jurisdiction. There is no difference, however, between issues exclusively in their jurisdiction and those in a shared jurisdiction. Furthermore, a test of equality between the OUT and IN coefficients suggests that politicians appear to be more helpful with in-jurisdiction issues than out-of-jurisdiction issues (F(1, 201) = 3.66, p = 0.057). This indicates that politicians do not shirk on issues of shared jurisdiction.
Our coefficient estimates for IN and OUT are virtually unchanged in both Models 2 and 3, and remain significantly different from one another (F(1, 201) = 3.96, p = 0.048 in Model 2, F(1, 201) = 4.43, p = 0.037 in Model 3). Email sender characteristics are not statistically related to the degree of helpfulness, suggesting that constituency discrimination on ethnic or gender lines is not affecting politicians’ responses. Helpfulness is also statistically unrelated to most recipient characteristics, save a significant increase in helpfulness if the recipient is a member of the governing party in her legislature.
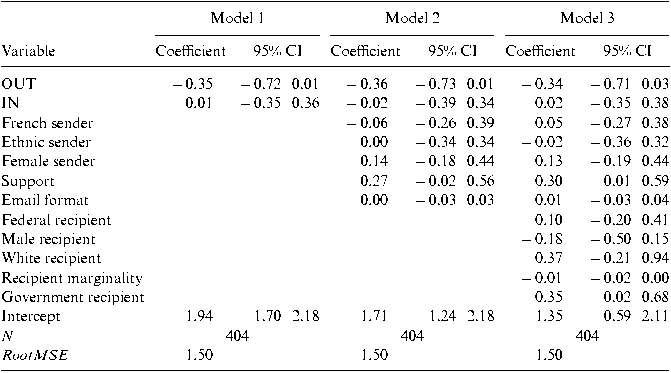
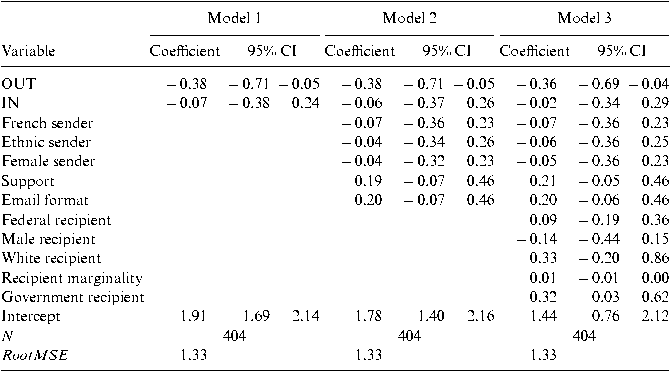
Appendix 1 reports three different sets of robustness checks. We first estimate models in which the number of responses is treated dichotomously (Table A1) or as a count (Table A2). Both of these specifications present results consistent with our the findings in Table 2, though tests of significance between in and out jurisdiction emails do not always achieve conventional levels of significance. Second, we re-estimate our principal findings using individual coder’s scores (Tables A3 and A4). We again return consistent results. Taken together, these results suggest that our findings are not a function of systematic error between coders or of faulty construction of the dependent variable.
LIMITATIONS AND CONCLUSIONS
This study is among a small but growing number of audit experiments in political science. At fielding it was, to our knowledge, the first to examine behavioral responses of representatives to questions of jurisdiction. Nevertheless, our work has at least two limitations. First, our results were generated in Canada, which is exceptional in its degree of decentralization, and in the frequent intentional blurring of jurisdictional lines outside of constitutional changes. Whether our findings extend to other countries is therefore an open question. This analysis might therefore serve as a starting point for studies of representation in other federal countries and to systems of multilevel government more generally. Second, our data examine only a rather thin slice of all the various types of representational work that politicians undertake. Responding to requests for information about how to obtain government services is one small but important component of a representative’s role. Nonetheless, the current analysis marks an important contribution to our understanding of one aspect of representation in a federal system.
In this paper, we have presented results from an experiment into the helpfulness of politicians in a federal system. Our results demonstrate—at least in the Canadian case—that a competitive mechanism is at work, whereby service representation is enhanced by providing citizens seeking information about government services access to more than one representative. This is most clearly the case on issues in shared jurisdictions. In these cases, there are no institutional stipulations about who is supposed to help whom, and we find that representatives actively seek to effectively help citizens with equal vigor on both shared issues and those within areas of their own exclusive domain. Citizens are significantly less likely to receive helpful responses when they ask for information from representatives on issues which are clearly outside their own exclusive domains.
From one perspective, our results make perfect sense: representational resources are scarce and they should be conserved when possible and spent where they might make the most impact. From another perspective, representatives should be eager to help where and whenever they can regardless of the subject of the request, because responding to requests for help in obtaining government services is an activity with relatively high potential political payoffs but few, if any, potential pitfalls. This is a theoretical expectation that our results contradict.
Far from simply leaving shared issues unaddressed in a neglected common space, we find that representatives actively seek to effectively help citizens with equal vigor on both shared issues and those within areas of their own exclusive domains.
At the same time, representatives are inclined to respect federal boundaries where these are clearly circumscribed. Our results show that citizens are less likely to receive helpful responses when they ask for information from representatives on issues which are clearly outside their own exclusive domains. From one perspective, this make perfect sense. Representational resources are scarce and they should be conserved when possible and spent where they might make the most impact. From another perspective, representatives should be eager to help where and whenever they can regardless of the subject of the request.
As Simeon (Reference Simeon2001) has argued, citizens care more about receiving government services than they do about the details—or “niceties”—of federal systems. What is more, providing advice to citizens on how to obtain government services is an essentially non-partisan task, regardless of the subject of the request. Responding to requests for help in obtaining government services is an activity with relatively high potential political payoffs but few, if any, potential pitfalls. Given this, one might expect federal systems to provide citizens with recourse to more than one representative on all issues of public concern whether shared or clearly defined jurisdictionally. That we find differences in the level of service representation suggests that federal jurisdictions do serve to constrain the behavior of politicians, but in a manner which ultimately increases aggregate representation.
APPENDIX A: FIGURES AND ROBUSTNESS CHECKS
A1: Robustness Checks
To check the robustness of our findings, we undertake three different sets of tests. In the first two tests, we present different operationalizations of our dependent variable. In the third test, we examine the reliability of our coders. All checks are presented in Appendix 1.
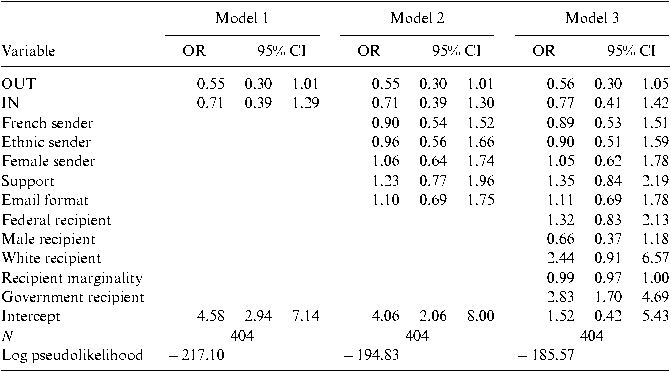
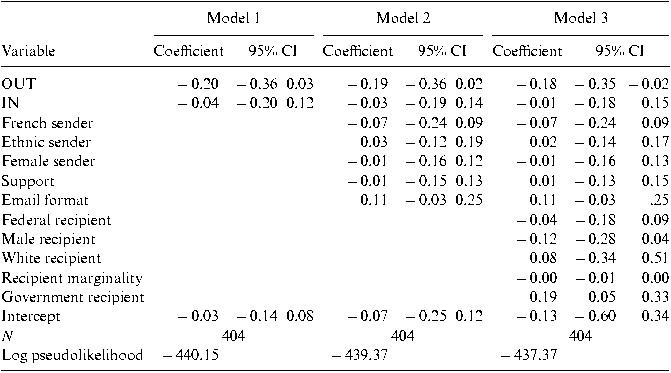
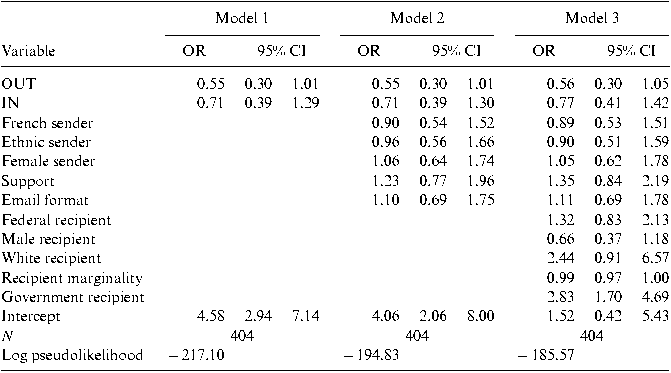
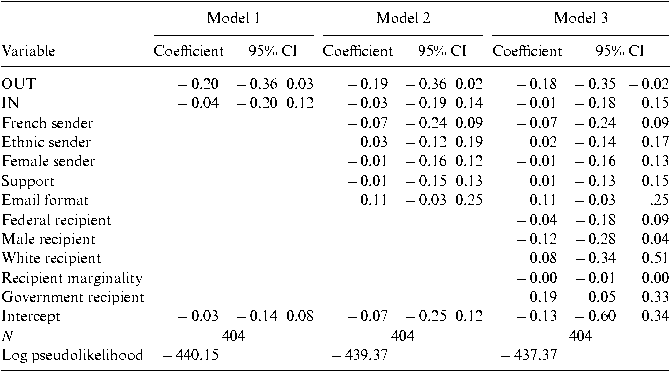
Our first check (Table A1) considers only a dichotomous response variable indicating whether the politician responded at all.Footnote 5 The results in all three models suggest that politicians are less likely to respond at all to requests for help outside of their jurisdiction, compared to those from shared jurisdictions. However, contrary to the results above, we fail to uncover significant differences in response rates to out and in jurisdiction requests. Our second check (Table A2) considers the number of responses to email requests. The variable ranges from 0 to 3, with a mean of 0.90 (95% CI 0.84, 0.96). In each of the three models, the average number of responses to out of jurisdiction emails is lower than for shared issues, reaching conventional statistically significant levels in Model 3. The number of responses to shared and in jurisdiction issues is never significantly different. The tests noted in the foot of the table demonstrate that the number of responses to in jurisdiction issues is significantly higher than for out jurisdiction issues.
Distribution of Helpfulness Scores. This Graph Shows the Distribution of a Combined Helpfulness Score and the Individual Scores Produced by Coder 1 and 2.
Robustness Checks, Dichotomous Responsea
Robustness Checks, Response Counta
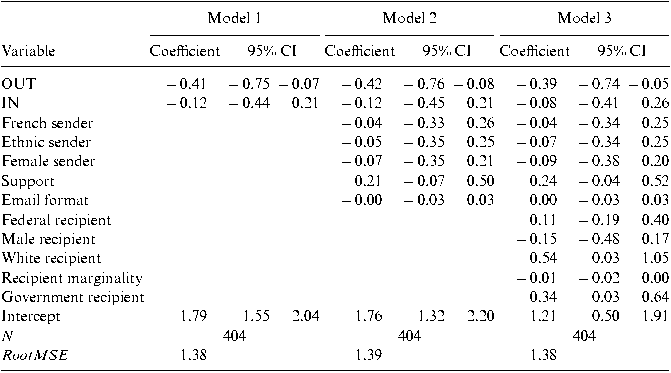
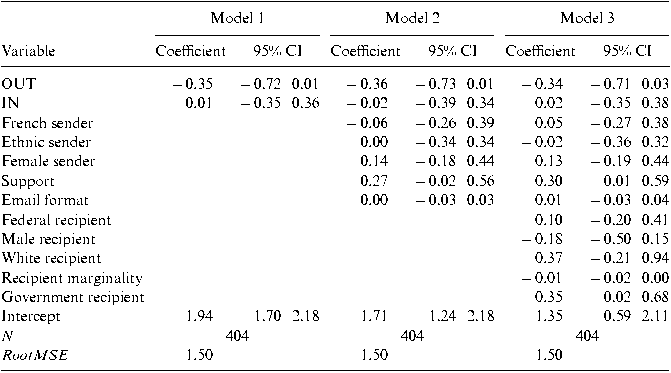
Our third set of checks tests whether our results hold across both of our codings of helpfulness. Despite the blinded nature of our scoring system, it is possible that our results are driven by systematic errors by one of our coders. Tables A3 and A4 replicate results for Table 2 for each of our coders. As can be seen, the results of both coders are similar both in terms of effect sizes and statistical significance. Taken together, these checks suggest that our results are not a function either of systematic error between our coders, or a faulty operationalization of helpfulness.
APPENDIX B: TREATMENTS
The following is the text of our email treatments. For a complete explanation of the randomization scheme, see Section 3.
Dear [XYZ],
Helpfulness by Issue Area, Coder 1a
Helpfulness by Issue Area, Coder 2a
[Version A] I would like your help with a problem and thought your office would be the best place to look for information.
[Version B] I have a problem and I don’t know how to solve it, and I was hoping that you might be able to help me find a solution.
FEDERAL ISSUE: Can you please tell me how many hours I need to have worked in the last year to qualify for Employment Insurance? What happens if I lose my job? Can I get it right away? My employer may soon have to lay me off and I worry about making ends meet.
SHARED ISSUE: Can you please tell me how my kids can apply for a student loan? Can they apply for a loan to any university or college? And how far ahead of the school year should they apply? I worry about making ends meet when they are at school and could use some help.
PROVINCIAL ISSUE: Can you please tell me how I can get on a list for a family doctor? If none are available, where else can I go for care? Can I go to an emergency room for a checkup, or should I go somewhere else? I worry about not having someone for regular checkups. dI like to know how to get a family doctor.
[Version A] Id greatly appreciate any information you can give me!
[Version B] I would like to thank you in advance for help that you can provide me with!
[Past Support] By the way, I was very happy to see you win the last election. I look forward to voting for you in the next election!
[No Support] All the best to you and your staff!
[Constituent name]
[END]
APPENDIX C: BALANCE TESTS
To evaluate balance, we estimate a multinomial logit of assignment to treatment condition on all variables employed in Models 2 and 3 in Table 2. Code for these tests is available in the replication file. These tests suggest that the joint distribution of variables in Models 2 and 3 is unrelated to treatment (Model 2 likelihood ratio chi 2 = −437.7, p = 0.27, Model 3 likelihood ratio chi 2 = −434.4, p = 0.25).