





Introduction
The unique climate and ecology of Türkiye contribute to its ability to produce an extensive variety of plant and fruit species (Eken et al. Reference Eken, Isfendiyaroğlu, Yeniyurt, Erkol, Karataş and Ataol2016; Önen Reference Önen2010; Tuncer and Kaya Reference Tuncer and Kaya2010). Horticultural crops contribute significantly to Türkiye’s economy (Özcan Reference Özcan2012), and one of the most important is grape (Vitis vinifera L.) in the family Vitaceae. In 2023, Türkiye ranked sixth globally in grape production area (377,843 ha) and eighth in total grape production (3.4 × 10⁹ kg) (FAO 2023). The province of Elazığ is one of the most important grape-producing regions of Türkiye, where more than 10,442 ha produce 8.49 × 10⁷ kg of grapes (TÜİK 2024).
Weeds compete with crop plants for light, space, nutrients, and water, resulting in significant losses in crop yield and quality (Oerke Reference Oerke2006). Furthermore, weeds facilitate the spread of diseases and pests by serving as hosts (Holmes and Froud-Williams Reference Holmes and Froud-Williams2005; Macharia et al. Reference Macharia, Backhouse, Wu and Ateka2016). Many weeds also produce many seeds (Özer et al. Reference Özer, Kadıoğlu, Önen and Tursun2001). Not all weed seeds germinate in the growing season. Some remain viable but dormant for many years at various soil depths (Bozdağan et al. Reference Bozdağan, Furkan, Karaman, Demirtaş, Kemal and Tursun2019), forming a persistent seedbank (Christoffoleti and Caetano Reference Christoffoleti and Caetano1998). This persistent seedbank is problematic because it requires growers to manage weeds not only during a single growing season, but also for many seasons, which complicates long-term weed management strategies (Özer Reference Özer2010; Santín-Montanyá et al. Reference Santín-Montanyá, Martín-Lammerding, Zambrana and Tenorio2016; Schwartz-Lazaro and Copes Reference Schwartz-Lazaro and Copes2019).
Effective weed management requires that weeds be accurately identified and their abundance determined both aboveground and in the soil seedbank (Monteiro and Santos Reference Monteiro and Santos2022; Nkoa et al. Reference Nkoa, Owen and Swanton2015). In many cases, weed community composition and abundance will reflect management practices such as tillage (Ahmad et al. Reference Ahmad, Shafi, Liaqat, Jan and Refan2018; Brandsæter et al. Reference Brandsæter, Bakken, Mangerud, Riley, Eltun and Fykse2011). Although previous studies have determined the weed species commonly found in vineyards in different regions in Türkiye (Ata Reference Ata2019; Kaçan Reference Kaçan2014; Kaçar Reference Kaçar2017; Özcan Reference Özcan2016; Topçu Reference Topçu2011), limited information exists about soil seedbank composition at various depths in the soil profile or the relationships between soil seedbanks, aboveground weed communities, and tillage practices.
Our study aimed to determine the frequency and density of weed species in 25 vineyards in Elazığ Province. The soil seedbank at each vineyard was evaluated at two depths (0 to 7.5 cm and 7.5 to 15 cm). Tillage practices used for weed control in the vineyards were systematically documented to assess their potential association with the composition of both aboveground and belowground weed communities. Our hypotheses were that 1) more weed seeds would be found at shallower soil depths, 2) there would be strong overlap between the weed seedbank and aboveground weed community, and 3) weed community composition would vary with the tillage practice employed.
Materials and Methods
Study Area
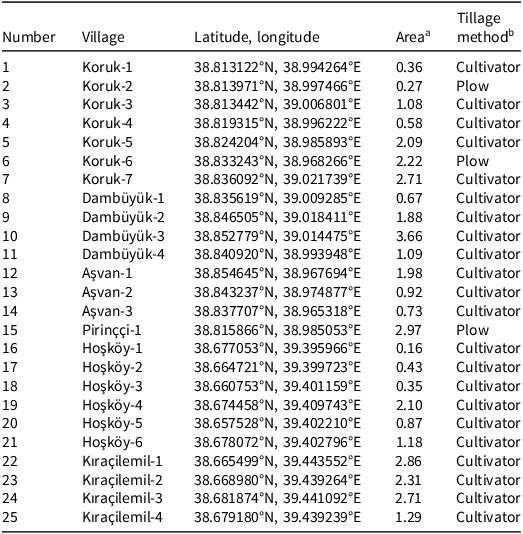
Seedbank and field surveys were conducted in 2023 and 2024 at 25 vineyards situated in the villages of Aşvan, Dambüyük, Hoşköy, Kıraçilemil, Koruk, and Pirinççi. These villages are in central Elazığ Province (Figure 1). Grapes from the Hoşköy and Kıraçilemil villages are grown primarily as table grapes, whereas those from Aşvan, Dambüyük, Koruk, and Pirinççi are grown for wine production. Most vineyards were approximately 10 to 15 yr old. Row spacing was typically 3.5 to 4.0 m between rows and 1.5 to 2.0 m within rows. Tillage practices employed in the vineyards were recorded by contacting the vineyard owners. Practices included shallow tillage with a hand-held cultivator tool and deep tillage with a mechanical plow, applied in the interrow areas for weed control. The coordinates and tillage practices of the surveyed vineyards are shown in Table 1.
A: Location of Elazığ Province, Türkiye. B and C: Satellite view of the study area and locations of the surveyed vineyards. Maps were prepared by the authors using satellite imagery and geographic data from Google Maps (A) and the General Directorate of Mapping, Türkiye (B and C).

Location, area under vineyard cultivation, and tillage method used by vineyard owners.

Table 1. Long description
A table with 25 rows and 5 columns detailing vineyard locations, coordinates, areas, and tillage methods. Columns are labeled Number, Village, Latitude, longitude, Area, and Tillage method. Row 1: Number, 1; Village, Koruk-1; Latitude, longitude, 38.813122°N, 38.994264°E; Area, 0.36; Tillage method, Cultivator. Row 2: Number, 2; Village, Koruk-2; Latitude, longitude, 38.813971°N, 38.997466°E; Area, 0.27; Tillage method, Plow. Row 3: Number, 3; Village, Koruk-3; Latitude, longitude, 38.813442°N, 39.006801°E; Area, 1.08; Tillage method, Cultivator. Row 4: Number, 4; Village, Koruk-4; Latitude, longitude, 38.819315°N, 38.996222°E; Area, 0.58; Tillage method, Cultivator. Row 5: Number, 5; Village, Koruk-5; Latitude, longitude, 38.824204°N, 38.985893°E; Area, 2.09; Tillage method, Cultivator. Row 6: Number, 6; Village, Koruk-6; Latitude, longitude, 38.833243°N, 38.968266°E; Area, 2.22; Tillage method, Plow. Row 7: Number, 7; Village, Koruk-7; Latitude, longitude, 38.836092°N, 39.021739°E; Area, 2.71; Tillage method, Cultivator. Row 8: Number, 8; Village, Dambüyük-1; Latitude, longitude, 38.835619°N, 39.009285°E; Area, 0.67; Tillage method, Cultivator. Row 9: Number, 9; Village, Dambüyük-2; Latitude, longitude, 38.846505°N, 39.018411°E; Area, 1.88; Tillage method, Cultivator. Row 10: Number, 10; Village, Dambüyük-3; Latitude, longitude, 38.852779°N, 39.014475°E; Area, 3.66; Tillage method, Cultivator. Row 11: Number, 11; Village, Dambüyük-4; Latitude, longitude, 38.840920°N, 38.993948°E; Area, 1.09; Tillage method, Cultivator. Row 12: Number, 12; Village, Aşvan-1; Latitude, longitude, 38.854645°N, 38.967694°E; Area, 1.98; Tillage method, Cultivator. Row 13: Number, 13; Village, Aşvan-2; Latitude, longitude, 38.843237°N, 38.974877°E; Area, 0.92; Tillage method, Cultivator. Row 14: Number, 14; Village, Aşvan-3; Latitude, longitude, 38.837707°N, 38.965318°E; Area, 0.73; Tillage method, Cultivator. Row 15: Number, 15; Village, Pirinçi-1; Latitude, longitude, 38.815866°N, 38.985053°E; Area, 2.97; Tillage method, Plow. Row 16: Number, 16; Village, Hoşköy-1; Latitude, longitude, 38.677053°N, 39.395966°E; Area, 0.16; Tillage method, Cultivator. Row 17: Number, 17; Village, Hoşköy-2; Latitude, longitude, 38.664721°N, 39.399723°E; Area, 0.43; Tillage method, Cultivator. Row 18: Number, 18; Village, Hoşköy-3; Latitude, longitude, 38.660753°N, 39.401159°E; Area, 0.35; Tillage method, Cultivator. Row 19: Number, 19; Village, Hoşköy-4; Latitude, longitude, 38.674458°N, 39.409743°E; Area, 2.10; Tillage method, Cultivator. Row 20: Number, 20; Village, Hoşköy-5; Latitude, longitude, 38.657528°N, 39.402210°E; Area, 0.87; Tillage method, Cultivator. Row 21: Number, 21; Village, Hoşköy-6; Latitude, longitude, 38.678072°N, 39.402796°E; Area, 1.18; Tillage method, Cultivator. Row 22: Number, 22; Village, Kıraçilemil-1; Latitude, longitude, 38.665499°N, 39.443552°E; Area, 2.86; Tillage method, Cultivator. Row 23: Number, 23; Village, Kıraçilemil-2; Latitude, longitude, 38.668980°N, 39.439264°E; Area, 2.31; Tillage method, Cultivator. Row 24: Number, 24; Village, Kıraçilemil-3; Latitude, longitude, 38.681874°N, 39.441092°E; Area, 2.71; Tillage method, Cultivator. Row 25: Number, 25; Village, Kıraçilemil-4; Latitude, longitude, 38.679180°N, 39.439239°E; Area, 1.29; Tillage method, Cultivator.
a Vineyard cultivation in hectares.
b Tillage method was reported by vineyard owners. Cultivator means the owner used a hand-held cultivation tool to till the soil, which resulted in shallow tillage (≤15 cm). Plow means the owner used a mechanical plow for soil tillage, which resulted in deep tillage (≥25 cm).
Seedbank Analysis
Soil samples were collected from vineyards during November 2023 after tillage operations were completed for the season. At each vineyard, soil samples were collected from three randomly selected locations. At each location, two soil samples were collected using a pointed shovel: one from the 0- to 7.5-cm depth, and one from the 7.5- to 15-cm depth, resulting in six samples per vineyard (three samples per depth). Each soil sample measured approximately 35.35 cm long, 35.35 cm wide, and 7.5 cm deep, corresponding to a soil volume of approximately 9,372 cm3 (0.125 m2 surface area). As with all weed surveys, it is unlikely that the samples we took captured every species in all 25 vineyards. The three samples from each depth were kept separate and analyzed individually. The samples were placed in polyethylene bags labeled with collection date, field/orchard, latitude and longitude coordinates, and sampling depth. Soil samples had a high moisture content at the time of collection, so they were dried for 14 d at room temperature in the Weed Science Laboratory at Dicle University in Diyarbakır. The dried soil samples were cleaned of large stones, soil clumps, and plant residues before being sieved through four different sieve sizes: 2.24 mm, 1 mm, 63 μm, and 45 μm. The use of multiple sieves enabled efficient separation of weed seeds from the soil across a wide range of seed sizes. The coarser sieves (2.24 mm and 1 mm) removed plant residues, stones, and larger organic material, whereas the finer sieves (63 μm and 45 μm) facilitated the separation of small-seeded species from the mineral soil fraction, helping to recover seeds across a wide range of sizes. Soil samples retained on the 2.24 mm and 1 mm sieves were examined under light using a hand magnifier to detect seeds. Soil samples collected by the other two sieves were washed under running water until they were free of soil particles. Once the water became clear, the samples were spread on drying paper and left to dry for 7 d (Konstantinović et al. Reference Konstantinović, Meseldžija, Korać and Konstantinović2011). The dried samples were then examined under light using a hand magnifier. In addition, each sample was placed in a container filled with water, and seeds that floated on the surface were collected. This water flotation step was used to recover small or partially hidden seeds that might have been overlooked during sieving, taking advantage of the fact that many weed seeds are less dense than water and rise to the surface. This step helped provide a more complete and accurate estimate of the seedbank.
To identify seeds detected through sieving and flotation, seeds were compared with reference specimens. A total of 150 seed samples previously identified and preserved at the Weed Science Laboratory at Dicle University were used as reference. Seeds that could not be identified using this approach were germinated in plastic trays, and seedlings were identified using keys and descriptions found in the book Flora of Turkey and the East Aegean Islands (Davis Reference Davis1965).
Field Surveys
Field surveys were conducted in 2024 at the same 25 vineyards sampled in 2023. The surveys were conducted in the same vineyards, although they were not restricted to the exact points where soil samples had been collected in 2023. Surveys were carried out during spring (May) and summer (August) 2024. Weed species were counted within a square quadrat (1 m by 1 m). The number of quadrats was determined according to orchard size, with four quadrats used for areas under 0.5 ha, six quadrats for 0.5 to 1.0 ha, and eight quadrats for areas larger than 1.0 ha (Önen et al. Reference Önen, Akdeniz, Farooq, Hussain and Özaslan2018). Surveys were conducted 10 m from the orchard edge to eliminate edge effects, and quadrats were placed diagonally across the vineyard to ensure representative sampling of the entire area (Önen et al. 2018). The weed species were identified by Cumali Özaslan at Dicle University, who used Flora of Turkey and the East Aegean Islands (Davis Reference Davis1965). The accepted names and synonyms of the recorded weed species were checked with the World Flora Online plant list (https://wfoplantlist.org/), and any duplicates were removed.
Statistical Analysis
The density and frequency of occurrence of seeds were calculated separately for the two seedbank sampling depths (Odum Reference Odum1971). Density was calculated by first determining the average number of seeds per sample (0.125 m2 surface area) at each depth, then converting this value to seeds per square meter by multiplying by eight. For aboveground surveys, density was defined as the number of plants counted per 1-m2 quadrat. Frequency of occurrence was computed for both seedbank samples and aboveground weed surveys using Equation 1. Because seed viability was not assessed, seed density values represent recovered seeds rather than confirmed viable seeds.
 $Frequency{\rm{\;}}of{\rm{\;}}occurrence{\rm{\;}}\left( {\rm{\% }} \right) = {{n}\over{N}} \times 100$
where n = the number of seedbank samples or aboveground quadrats in which a species occurred, and N = total number of samples or quadrats.
The establishment rate, representing the ratio of emerged weed density in 2024 to weed seed density in 2023 (expressed as a percentage), was calculated using Equation 2. For this calculation, weed seed density was combined across the two soil depths to obtain a single value per species. Because the numerator and denominator were derived from different survey years and sampling units, this ratio is an approximate index rather than a demographic rate, and values may exceed 100%.
 $Establishment{\rm{\;}}rate{\rm{\;}}\left( {\rm{\% }} \right) = {{{Weed{\rm{\;}}density{\rm{\;}} \times {\rm{\;}}100{\rm{\;}}}}\over{{Seed{\rm{\;}}density}}}$
Differences between the two soil depths (0 to 7.5 cm and 7.5 to 15 cm) were evaluated for total seed density, species richness, and Shannon-Wiener diversity (H′) using paired t-tests, with each vineyard serving as the pairing unit. Because the two tillage types were highly unbalanced (22 cultivator vs. 3 plow vineyards), differences between tillage types were examined only tentatively using a Welch t-test, which does not assume equal variances. Given that only three vineyards were managed with plow tillage, these comparisons should be interpreted with caution, as the results are highly sensitive to the values of individual plowed vineyards. Statistical significance was evaluated at the α = 0.05 level. The data were analyzed and visualized using XLSTAT 2023 software (Addinsoft, New York, NY).
Results and Discussion
Meteorological Data
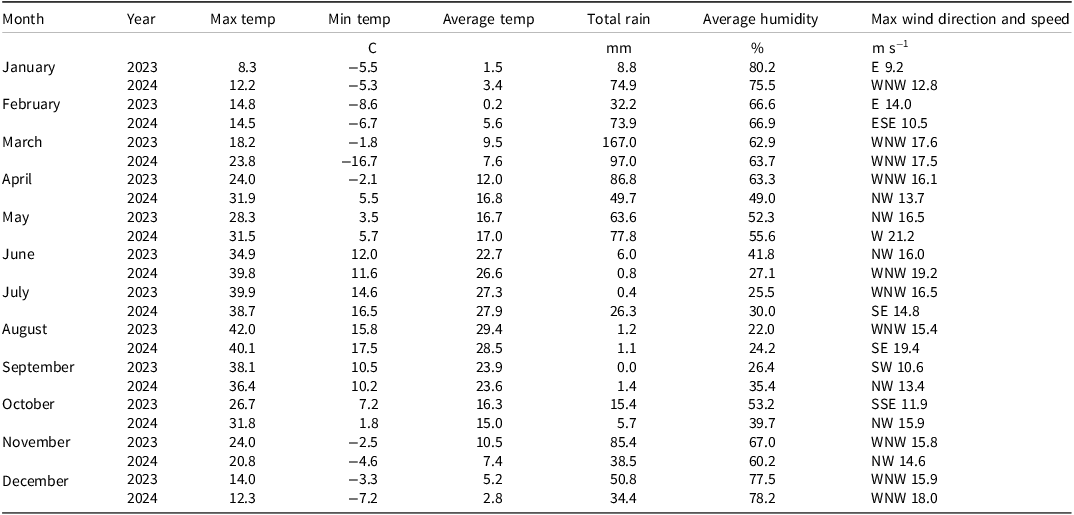
Meteorological data for Elazığ Province were obtained from the Turkish State Meteorological Service (MGM 2025) and are presented in Table 2. Soil samples for seedbank analysis were collected in November 2023, when the average temperature was 10.5 C and total precipitation was 85.4 mm. Spring surveys were conducted in May 2024, when the average temperature was 17.0 C and total precipitation was 77.8 mm. The summer surveys were conducted during August 2024, when the average temperature was 28.5 C and total precipitation was markedly low at 1.1 mm.
Weather in Elazığ Province during 2023 and 2024.a

Table 2. Long description
A table comparing weather data for Elaz Province during 2023 and 2024. The table has 12 rows and 7 columns. The columns are labeled Month, Year, Max temp, Min temp, Average temp, Total rain, Average humidity, and Max wind direction and speed. The rows are labeled with months from January to December. Each row contains data for the years 2023 and 2024. The data includes maximum temperature, minimum temperature, average temperature, total rainfall, average humidity, and maximum wind direction and speed. For example, in January 2023, the maximum temperature was 8.3 C, the minimum temperature was -5.5 C, the average temperature was 1.5 C, the total rainfall was 8.8 mm, the average humidity was 80.2 percent, and the maximum wind direction and speed were E 9.2 m/s. In January 2024, the maximum temperature was 12.2 C, the minimum temperature was -5.3 C, the average temperature was 3.4 C, the total rainfall was 74.9 mm, the average humidity was 75.5 percent, and the maximum wind direction and speed were WNW 12.8 m/s.
a Source: MGM (2025).
Soil Seedbank
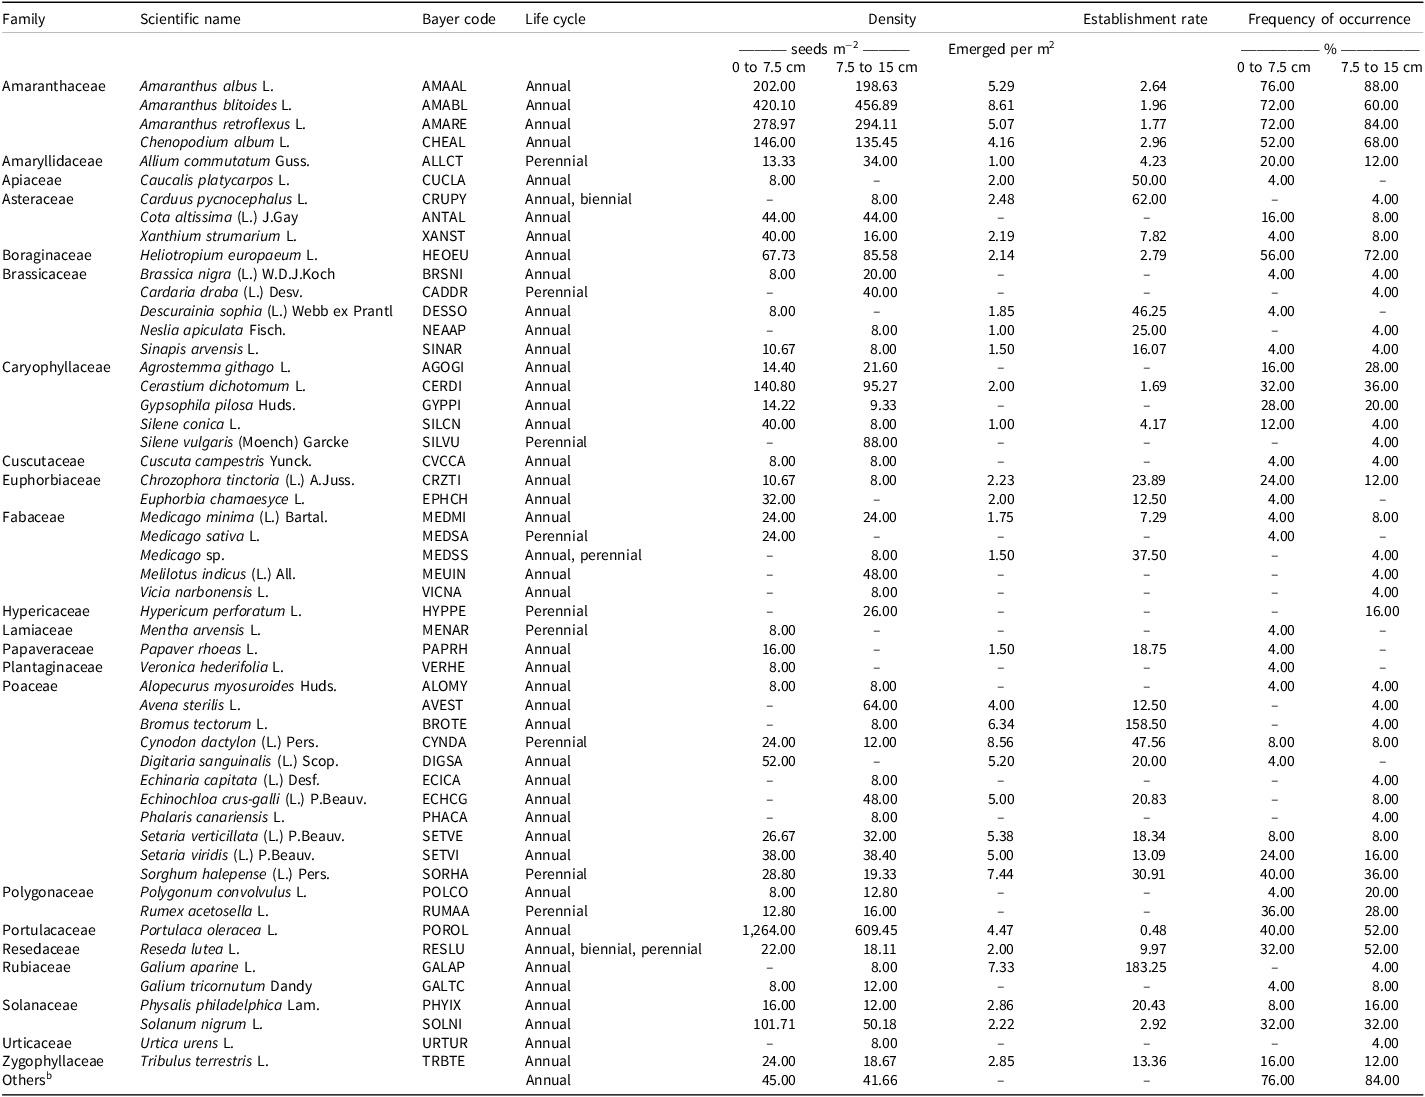
A total of 53 weed species belonging to 46 genera and 22 families were recorded in the soil seedbank (Table 3). The weed species with the greatest seed density at a soil depth of 0 to 7.5 cm were common purslane (Portulaca oleracea L.; 1,264 seeds m−2), prostrate pigweed (Amaranthus blitoides L.; 420 seeds m−2), and redroot pigweed (Amaranthus retroflexus L.; 279 seeds m−2). The weed species with the greatest seed density at the 7.5- to 15-cm depth were also common purslane (609 seeds m−2), prostrate pigweed (457 seeds m−2), and redroot pigweed (294 seeds m−2).
Weed species recorded in the soil seedbanks of 25 vineyards in Elazığ Province.a

Table 3. Long description
A table listing weed species recorded in vineyard soil seedbanks, detailing their scientific names, life cycles, densities, and occurrence frequencies. The table has 21 columns and 53 rows. Column headers include Family, Scientific name, Bayer code, Life cycle, Density (with sub-columns 0 to 7.5 cm, 7.5 to 15 cm), Establishment rate (with sub-columns 0 to 7.5 cm, 7.5 to 15 cm), and Frequency of occurrence. Row labels include the scientific names of the weed species. Notable trends include high densities of common purslane, prostrate pigweed, and redroot pigweed at both soil depths. The table provides detailed data on the density and frequency of various weed species in the soil seedbanks of vineyards.
Emerged per m2 is the aboveground plant density recorded in 2024, used in Equation 2.
a A dash (–) indicates that the species was not recorded for the corresponding depth or parameter.
b Others includes seeds that could not be identified.
Annual species accounted for 75.5% of the taxa identified in the soil seedbank. This pattern is typical of disturbed agricultural systems, where annual weeds tend to predominate due to their high reproductive output and rapid establishment. In addition, annuals and other early successional weeds are more dependent on persistent seedbanks (Buhler et al. Reference Buhler, Hartzler and Forcella1997; Davis Reference Davis2006; Grundy and Jones Reference Grundy, Jones and Naylor2002). Perennial weeds comprised 18.9% of the species, with the remaining species exhibiting a mixture of life cycles (Figure 2A). Dominant plant families included Poaceae (20.8% of the recorded species), followed by Brassicaceae, Caryophyllaceae, and Fabaceae, each comprising 9.4% of the recorded species (Figure 2B).
Distribution of the observed weed species in the soil seedbank sampled in November 2023 according to life cycle (A) and plant family (B).

The most frequently observed seeds at the 0- to 7.5-cm soil depth belonged to tumble pigweed (Amaranthus albus L.; 76%), unidentified species (76%), prostrate pigweed (72%), redroot pigweed (72%), European heliotrope (Heliotropium europaeum L.; 56%), and common lambsquarters (Chenopodium album L.; 52%). Similarly, the most frequently observed seeds at the 7.5- to 15-cm soil depth were those of tumble pigweed (88%), redroot pigweed (84%), others (84%), European heliotrope (72%), common lambsquarters (68%), prostrate pigweed (60%), common purslane (52%), and yellow mignonette (Reseda lutea L.) (52%).
Among the species observed in both the seedbank and aboveground surveys, catchweed bedstraw (Galium aparine L.) had the greatest plant establishment rate (183%), followed by cheatgrass (Bromus tectorum L.; 159%), Italian plumeless thistle (Carduus pycnocephalus L.; 62%), and carrot bur parsley (Caucalis platycarpos L.; 50%). The species with the lowest plant establishment rate were common purslane (0.5%), followed by forked chickweed (Cerastium dichotomum L.; 1.7%), redroot pigweed (1.8%), prostrate pigweed (2.0%), and tumble pigweed (2.6%). Twenty species observed in the seedbank were not observed in aboveground surveys, so the establishment rate could not be calculated for these species (Table 3). The establishment rate represents the ratio of aboveground weed density in 2024 to weed seed density in 2023, and may be influenced by multiple factors. Biological factors include seed dormancy, germination, establishment, and mortality. Experimental factors include sampling timing, sampling scale, and sampling location, given the likelihood of temporal and spatial heterogeneity in both aboveground and belowground weed communities. Values exceeding 100%, as observed for catchweed bedstraw (183%) and cheatgrass (159%), do not indicate that more plants emerged than seeds were present. Rather, they arise because the seedbank and aboveground surveys were conducted in different years, at different spatial scales, and using different sampling units; thus, the two densities are not directly comparable. Species with large, transient seedbanks and high germination fractions, or species whose seeds were under-recovered by the germination-based method used here, will tend to produce ratios above 100%. The establishment rate should therefore be regarded as a coarse, relative index for comparing species within this data set, and not as a direct measure of seedling emergence, recruitment, or survival.
Slightly more seeds were recorded at the 0- to 7.5-cm soil depth (3,265 seeds m−2) compared with the 7.5- to 15-cm soil depth (2,753 seeds m−2). However, the paired t-test indicated that mean total seed density did not differ significantly between the two depths (202 vs. 170 seeds m−2; t = 1.01, P = 0.324). In contrast, species richness was significantly greater at the deeper layer than at the shallower layer (8.9 vs. 7.8 species per vineyard; t = −2.27, P = 0.032). The Shannon-Wiener diversity index did not differ significantly between depths (P = 0.249). These results indicate a relatively uniform distribution of seed density across the soil profile; however, species richness was greater in the deeper layer. Reduced exposure to germination cues at depth is one possible explanation, although this was not directly tested in the present study. Tillage practices are known to influence the vertical distribution of weed seeds within the soil profile. Conventional tillage redistributes weed seeds across the soil profile, often burying them 25 to 38 cm deep, whereas most weed seeds remain concentrated on the soil surface in no-till systems (Zamljen et al. Reference Zamljen, Rovanšek and Leskovšek2024). All surveyed vineyards use some form of tillage practices for weed management (Table 1). Because no no-till vineyards were included in this survey, the range of vertical seed distributions represented here is necessarily narrow; surveys including no-till systems may reveal greater differences between soil depths.
Field Surveys
A total of 85 weed species distributed across 73 genera and 22 families were recorded during the spring 2024 field surveys (Table 4). The weed species with the highest densities were prostrate pigweed (11.5 plants m−2), bermudagrass [Cynodon dactylon (L.) Pers.; 9.2 plants m−2], and large crabgrass [Digitaria sanguinalis (L.) Scop.; 8.5 plants m−2. Annual species accounted for 62% of the identified taxa, while perennial species comprised 14%, with the remaining species exhibiting a mix of life cycle strategies (Figure 3A). The life form system developed by Raunkiær classifies plants according to the position of their perennating buds during the unfavorable season, and can be used to characterize how plant communities respond to climate, land use, and agricultural practices (Raunkiær 1934). The predominance of therophytes (annual plants that survive unfavorable seasons as seeds) in these vineyards reflects the repeated soil disturbance and weed control associated with vineyard management, which favors short-lived species that rely on the seedbank for regeneration. Analysis based on the Raunkiær system indicated that therophytes were the predominant category (62%), followed by therophytes + hemicryptophytes (18%), hemicryptophytes + geophytes (9%), and hemicryptophytes (7%). Geophytes, chamephytes, and chamephytes + geophytes were each represented by a single species (Figure 3B). Poaceae and Asteraceae were the most prevalent families (15 species each), followed by Brassicaceae (11 species) and Apiaceae (5 species) (Figure 3C). The species with the highest frequency of occurrence were field bindweed (Convolvulus arvensis L.; 84%), prickly lettuce (Lactuca serriola L.; 72%), Johnsongrass [Sorghum halepense (L.) Pers.; 68%], cheatgrass (60%), and flixweed [Descurainia sophia (L.) Webb ex Prantl; 52%].
Weed species observed in the vineyards during spring field surveys with densities and frequencies of occurrence.

Table 4. Long description
A table listing weed species observed in vineyards during spring field surveys, including their densities and frequencies. The table has 22 columns and 85 rows. Column headers are Family, Scientific name, Bayer code, Life cycle, Raunkiaer life form, and Density. Row labels are the names of different weed species. Each row provides details on the family, scientific name, Bayer code, life cycle, Raunkiaer life form, density, and frequency of each weed species. Notable species include prostrate pigweed with the highest density of 11.5 plants per square meter, bermudagrass with 9.2 plants per square meter, and large crabgrass with 8.5 plants per square meter. Annual species account for 62% of the identified taxa, while perennial species comprise 14%, with the remaining species exhibiting a mix of life cycle strategies.
a Source: Raunkiær (Reference Raunkiær1934).
Distribution of weed species recorded in the vineyards during spring 2024 surveys according to life cycle (A), Raunkiær life form (B), and plant family (C).

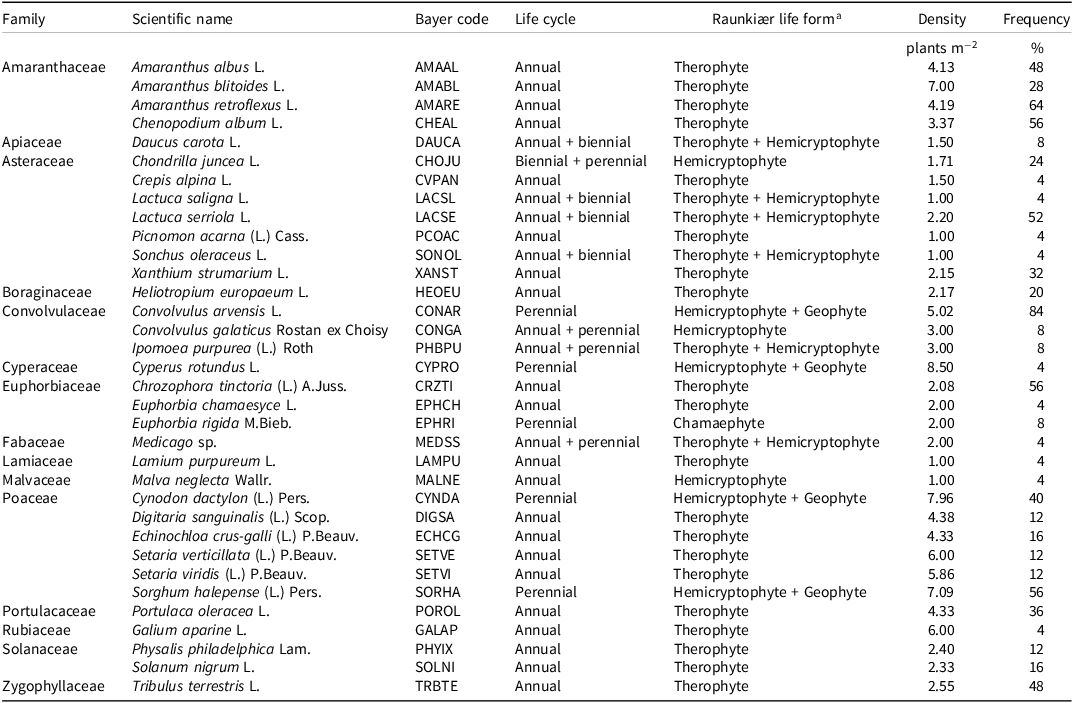
A total of 34 weed species distributed across 28 genera and 15 families were recorded during summer 2024 field surveys (Table 5). The weed species with the highest densities were purple nutsedge (Cyperus rotundus L.; 8.5 plants m−2), bermudagrass (8.0 plants m−2), and Johnsongrass (7.1 plants m−2). Annual species were the most prevalent (59%), followed by perennial species (15%), annual + biennial species (15%), annual + perennial species (9%), and biennial + perennial species (3%) (Figure 4A). For Raunkiær life forms, therophytes were the most common (59%), followed by therophytes + hemicryptophytes (21%), hemicryptophytes + geophytes (12%), and hemicryptophytes (6%) (Figure 4B). Asteraceae was the most represented family with seven species, followed by Poaceae with six species, and four Amaranthaceae species (Figure 4C). The species with the highest frequencies of occurrence were field bindweed (84%), redroot pigweed (64%), lambsquarters (56%), dyer’s croton [Chrozophora tinctoria (L.) A. Juss.; 56%], Johnsongrass (56%), and prickly lettuce (52%). Of the 34 weed species found in the summer surveys, only rush skeletonweed (Chondrilla juncea L.) and small spurge (Euphorbia chamaesyce L.) had not been observed in the spring surveys. The remaining 32 weed species observed in summer surveys represented a subset of the 85 species observed in spring surveys.
Weed species observed in the vineyards during summer field surveys with densities and frequencies of occurrence.

Table 5. Long description
A table listing weed species observed in vineyards during summer field surveys. The table has 34 rows and 7 columns. Column headers are Family, Scientific name, Bayer code, Life cycle, Raunkiær life form, Density, and Frequency. Row labels include weed species names. The table provides detailed information on each species’ scientific name, Bayer code, life cycle, Raunkiær life form, density per square meter, and frequency of occurrence in percent. Notable species include Amaranthus albus with a density of 4.13 per square meter and a frequency of 48 percent, and Cyperus rotundus with the highest density of 8.5 per square meter.
a Source: Raunkiær (Reference Raunkiær1934).
Distribution of weed species recorded in the vineyards during summer 2024 surveys according to life cycle (A), Raunkiær life form (B), and plant family (C).

The weed communities we observed are consistent with previous research from the region. Poaceae and Asteraceae were the most abundant families in traditional and organic vineyards in Manisa Province (Kaçan Reference Kaçan2014). Bermudagrass and field bindweed were the most frequent and abundant species in traditional vineyards. Bermudagrass was also among the most frequent and abundant species in organic vineyards (Kaçan Reference Kaçan2014). In parts of Adıyaman, Kahramanmaraş, and Şanlıurfa provinces where pistachio (Pistacia vera L.) and grapes are grown, the most problematic weeds were in the Poaceae (16 species) and Asteraceae (16 species) families (Özcan Reference Özcan2016). Johnsongrass and field bindweed were the most frequent and abundant species (Özcan Reference Özcan2016). In vineyards in Tokat Province, field bindweed was the most frequent and abundant species (Topçu 2011). In vineyards in Diyarbakır Province, wild barley (Hordeum spontaneum L.) was the most abundant species (Kaçar Reference Kaçar2017).
Weed Communities and Tillage
Two distinct tillage practices, shallow tillage with a cultivator and deep tillage with a plow, were used for weed management in the vineyards evaluated in the current study. Cultivators were used at 22 sites (88%), whereas a plow was used at three sites (12%). A Welch t-test of mean seed density between the two tillage types did not reveal a significant difference (182 seeds m−2 vs 213 seeds m−2 for cultivator and plow vineyards, respectively; P = 0.796), although the very small number of plow-tilled vineyards means this result should be regarded as exploratory rather than conclusive. In the spring field survey, 62 weed species were recorded in the vineyards where a cultivator was used, but not where a plow was used. Conversely, five weed species were associated with plowing. In the summer field survey, 24 weed species were observed only in the vineyards where a cultivator was used, and no species were observed where a plow was used.
The greater number of weed species associated with cultivation method is most plausibly attributable to the fact that most sampled vineyards had been tilled with cultivators (22 vs. 3 vineyards) rather than to an effect of tillage implement per se. Nonetheless, deep tillage by plows may also be less favorable for the persistence of some weed species. For example, a study of wheat in Çanakkale Province found that deeper tillage with a plow reduced weed emergence relative to reduced tillage methods (Yaz Reference Yaz2023). Weed density and aboveground biomass have been reported to be 50% less with deep tillage (25 cm) than shallow tillage (15 cm) (Brandsæter et al. Reference Brandsæter, Bakken, Mangerud, Riley, Eltun and Fykse2011). Deep tillage often buries weed seeds below their optimal germination zone, inhibiting germination, especially of smaller-seeded weeds, whereas shallow tillage may allow more weed diversity to persist (Steponavičienė et al. Reference Steponavičienė, Marcinkevičienė, Butkevičienė, Skinulienė and Bogužas2021; Travlos et al. Reference Travlos, Cheimona, Roussis and Bilalis2018). It is also possible that differences in tillage depth contributed to differences in observed weed communities, although the unbalanced survey design prevents firm conclusions.
Seed viability was not assessed in this study. Reported densities therefore reflect seeds recovered from soil samples rather than confirmed viable seeds, and a portion of the recovered seeds may have been nonviable at the time of sampling. This should be considered when comparing our density estimates with studies that report viable seed densities.
Practical Implications
Vineyards in Elazığ Province hosted a varied weed flora, with 85 species identified in spring and 34 in summer. The soil seedbank contained 53 species, mostly annuals. Because all surveyed areas were managed with tillage, this finding indicates that tillage alone may be insufficient for long-term weed control. Given the functional diversity of observed weed communities in these vineyards, it is unlikely that any single management practice will be sufficient to suppress all species. Instead, vineyard managers should pursue an integrated weed management practice that includes tactics such as cover crops and mulching to suppress diverse weed species across their life cycles. This practice will help maintain crop productivity and profitability over time.
Acknowledgments
This manuscript has been prepared from the PhD dissertation of Bilal Eşitmez. The authors are indebted to the Diyarbakır Plant Protection Research Institute, Directorate of Provincial Agriculture and Forestry, Elazığ, and Elazığ Fisheries Research Institute for the use of available facilities and laboratories.
Funding
This research received no external funding.
Competing interests
The authors declare they have no competing interests.





 Open access

