I. INTRODUCTION
Nanoscale mechanical properties’ measurements are a critical part of the development of new nanostructures and nanoscale devices with applications in electronics,Reference Duan, Niu, Sahi, Chen, Parce, Empedocles and Goldman1–Reference Xu, Lu and Zhu3 optics,Reference McAlpine, Friedman, Jin, Lin, Wang and Lieber2, Reference Huang, Duan and Lieber4 electromechanical devices,Reference He and Yang5, Reference Feng, He, Yang and Roukes6 biomedicine,Reference Kotov, Winter, Clements, Jan, Timko, Campidelli, Pathak, Mazzatenta, Lieber, Prato, Bellamkonda, Silva, Kam, Patolsky and Ballerini7 and energy conversion.Reference Wang and Song8, Reference Tian, Zheng, Kempa, Fang, Yu, Yu, Huang and Lieber9 Mechanical tests of elastic and plastic deformation, fracture, toughness, creep, and fatigue provide key information in selecting appropriate materials and structures for reliable and high-performance functionality of such emerging nanoscale devices. Due to its extensive use in electronics, the mechanical properties of “bulk” Si have received long-term attention; challenging requirements arising from the current and ongoing shrinking of features in nanoscale components require new tests and procedures to measure the “nanoscale” mechanical properties of Si. Readily fabricated in top-downReference Huang, Fang and Zhu10, Reference Peng, Zhang, Lu, Wong, Zhang and Lee11 and bottom-upReference Morales and Lieber12, Reference Hochbaum, Fan, He and Yang13 systems, Si nanowires (NWs) are one-dimensional Si single crystals that provide excellent vehicles for testing the mechanical properties of Si at the nanoscale.Reference He and Yang5, Reference Hoffmann, Utke, Moser, Michler, Christiansen, Schmidt, Senz, Werner, Gösele and Ballif14–Reference Stan, Krylyuk, Davydov and Cook17
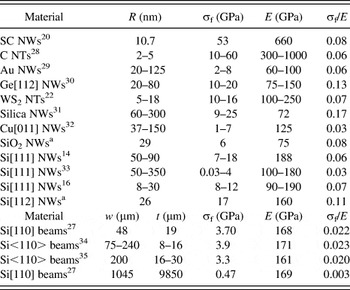
Due to the large surface area-to-volume ratio of nanostructures, some mechanical properties that are intrinsic material characteristics at the macroscale become strongly size dependent at the nanoscale. Theoretical and experimental studies have shown that the elastic moduli of various types of NWs change significantly compared with their bulk counterparts due to surface contributions. In the case of Si NWs, a size-dependent behavior for the elastic modulus (decreased with respect to the bulk elastic modulus) was found from atomistic computationsReference Lee and Rudd18, Reference Leu, Svizhenko and Cho19 for NWs with radii smaller than 2.5 and 10 nm (depending on their crystallographic orientation) and from measurementsReference Zhu, Xu, Qin, Fung and Lu16 for NWs with radii smaller than 10 nm. Fracture strength is another quantity of interest that is an important characteristic of the mechanical response of nanostructuresReference Wong, Sheehan and Lieber20–Reference Zhu, Li, Ogata and Yip23 and is a measure of the maximum stress sustainable by a component before fracture. In the absence of defects, the ideal fracture strength is approximately one-tenth of the elastic modulus of a material.Reference Felbeck and Atkins24, Reference Kelly and Macmillan25 However, as is the case for most materials, bulk Si wafers and diced chips exhibit fracture strengths one or two orders of magnitude smaller than the ideal limits due to fabrication and processing-induced defects.Reference Cook26 On the other hand, as single crystals of reduced size, Si NWs are expected to exhibit enhanced fracture strengths due to the reduced number of NW structural defects. Indeed, an increase of a factor of 20–40 in the bending strength of Si beams was observed as their size was reduced from millimeters down to nanometers.Reference Namazu, Isono and Tanaka27 A few examplesReference Hoffmann, Utke, Moser, Michler, Christiansen, Schmidt, Senz, Werner, Gösele and Ballif14, Reference Zhu, Xu, Qin, Fung and Lu16, Reference Wong, Sheehan and Lieber20, Reference Kaplan-Ashiri, Cohen, Gartsman, Ivanovskaya, Heine, Seifert, Wiesel, Wagner and Tenne22, Reference Yu, Lourie, Dyer, Moloni, Kelly and Ruoff28–Reference Richter, Hillerich, Gianola, Mönig, Kraft and Volkert32 for which the ultimate fracture strength of various NWs and nanotubes (NTs) was found close to that of a perfect crystal are listed in the upper part of Table I. Also, as can be seen in the middle and lower parts of Table I, the fracture strength of Si NWs indicates a significant enhancement compared with measurements at millimeter and micrometer scales.Reference Hoffmann, Utke, Moser, Michler, Christiansen, Schmidt, Senz, Werner, Gösele and Ballif14, Reference Zhu, Xu, Qin, Fung and Lu16, Reference Namazu, Isono and Tanaka27, Reference Gordon, Baron, Dhalluin, Gentile and Ferret33–Reference Wilson, Ormeggi and Narbutovskih35
Fracture strength, σf, and elastic modulus, E, measurements of various nanowires (NWs) and nanotubes (NTs).

a This work.
SC, silicon carbide; R, the radius of NWs or NTs; w, the width of beams; t, the thickness of beams.
Due to the difficulties associated with nanoscale accessibility and manipulation, tests for nanoscale mechanical property measurements continue to be challenging and require further developments and improvements. Most existing tensile and bending methods for measuring the mechanical responses of NWs were adapted from those used on macrosize specimens. In conventional tensile tests on NWs and NTs, gripped specimens were stretched between two probesReference Zhu, Xu, Qin, Fung and Lu16, Reference Kaplan-Ashiri, Cohen, Gartsman, Ivanovskaya, Heine, Seifert, Wiesel, Wagner and Tenne22, Reference Yu, Lourie, Dyer, Moloni, Kelly and Ruoff28, Reference Brambilla and Payne31 inside a scanning electron microscope (SEM) or transmission electron microscope (TEM) to determine the ultimate strength values from stress–strain responses. Various bending tests in the form of cantilever configurations,Reference Hoffmann, Utke, Moser, Michler, Christiansen, Schmidt, Senz, Werner, Gösele and Ballif14, Reference Wong, Sheehan and Lieber20, Reference Gordon, Baron, Dhalluin, Gentile and Ferret33 loops between two manipulators,Reference Smith, Holmberg and Korgel36 or three-point bending tests (stretching bridged filaments)Reference Wu, Heidelberg and Boland29, Reference Ngo, Almecija, Sader, Daly, Petkov, Holmes, Erts and Boland30, Reference Tabib-Azar, Nassirou, Wang, Sharma, Kamins, Islam and Williams37 were used to observe the highest stress state sustained by a NW or NT just before failure. The bending of one-dimensional nanostructures was also investigated by using the stretching forces developed in the specimen support during electron beam exposure in a SEM or TEM.Reference Han, Zheng, Zhang, Zhang, Zhang and Wang15, Reference Walavalkar, Homyk, Henry and Scherer38, Reference Zheng, Han, Wang, Zhang, Yue, Qin, Zhang and Zhang39
In this work, atomic force microscope (AFM) manipulation is used to bend as-grown Si and fully oxidized Si NWs into either a hook or loop configuration. The adhesion between the NWs and the supporting substrate provides a strong enough force to retain the NWs in the bent configuration reached after each manipulation step. The procedure resembles the two-point bending method,Reference France, Paradine, Reeve and Newns40, Reference Matthewson and Kurkjian41 in which a specimen (beam, wire) is bent into a loop as the two specimen ends are displaced toward each other and the maximum intervening curvature is observed. In the new proposed NW bending method, the in-plane geometry of a bent NW is detailed after each manipulation step by imaging the region encompassing the NW with AFM operated in conventional intermittent contact mode. Analysis of the AFM images enables the force balance around the NW to be analyzed, and the local bending stress calculated. Fracture strengths for as-grown Si and fully oxidized Si NWs are determined from the last-observed bending states before fracture.
II. EXPERIMENTAL DETAILS
A. Materials
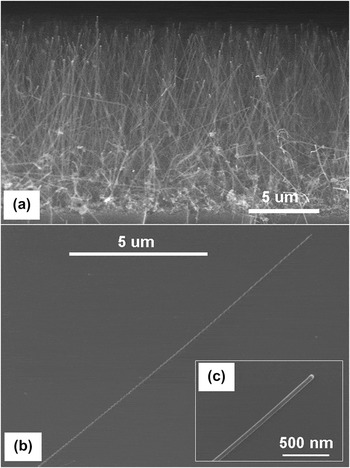
The as-grown Si and fully oxidized Si NWs measured in this work were from the same batches of NWs for which the structure and elastic properties were investigated previously.Reference Stan, Krylyuk, Davydov and Cook17, Reference Krylyuk, Davydov, Levin, Motayed and Vaudin42 Initially, all the Si NWs were synthesized by an Au-catalytic vapor–liquid–solid (VLS) technique on Si(111) substrates at 500 °C in a mixture of SiH4, N2, and H2 gases. From TEM electron diffraction and SEM electron backscatter diffraction, the NWs were found to be single crystals with their axes along a Si <112> direction. Subsequently, some NW batches were oxidized by a rapid thermal oxidation at 1000 °C for 5 min. TEM measurements showed that oxidized Si NWs with diameters less 60 nm were fully oxidized. As such, to keep the interpretation simple, only oxidized Si NWs with diameters smaller than 60 nm were selected for fracture strength measurements. The elastic properties of the NWs were determined by contact-resonance AFM: the elastic modulus was found to be around 160 GPa for as-grown Si NWs and around 75 GPa for fully oxidized Si NWs.Reference Stan, Krylyuk, Davydov and Cook17 The Si NWs, either as-grown or fully oxidized, were detached from their original substrate through a gentle sonication in isopropyl alcohol. A few drops of the resulting suspension were deposited on a clean Si(100) substrate. After the solution dried, straight NWs as long as 25 μm were observed on the substrate through simple inspections by SEM or AFM. Si NWs grown and dispersed on a flat Si substrate are shown at different magnifications in Fig. 1. Capillary meniscus and van der Waals forces and contaminant residues of isopropyl alcohol enhanced the adhesive connection between the NWs and the substrate.
(a) Cross-sectional scanning electron microscope (SEM) image of as-grown Si nanowires (NWs) attached to their original substrate; (b) and (c) plan-view SEM images of dispersed Si NWs on a Si substrate.

B. AFM bending tests
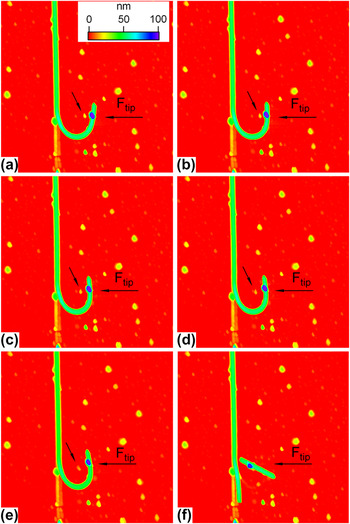
Friction forces promoted by the adhesive pinning were great enough to hold AFM-manipulated NWs in states of great bending stress; an example is shown in Fig. 2, which shows an as-grown Si NW of radius 26 nm imaged by intermittent AFM contact mode after successive bending steps. The NW was initially straight and vertical in the image; visible traces of contaminants indicate the NW position before bending. The NW was bent into a hook by imposing a displacement of the AFM probe perpendicular to the NW and laterally dragging the NW—initially the end of the NW was dragged horizontally from left to right in the image, then vertically bottom to top, and then finally horizontally right to left as indicated by the F tip arrow in Fig. 2. In each bending test performed in this work, the free end of a NW was bent around a long NW segment in either the asymmetric hook configuration of Fig. 2 or a similarly manipulated, nearly symmetric, loop configuration.
The last bending, (a) to (e), and failure, (f), states of a 26-nm as-grown Si NW imaged by atomic force microscope (AFM). The long horizontal arrow indicates the direction along which the AFM probe moved toward and pushed into the bent NW hook. The small tilted arrow indicates the position of a contaminant that was pushed increasingly inside the hook by the short arm of NW during each bending increment. The same z-scale applies for each scan. The scan area is 5 × 5 μm2.s

A few of the last states observed during the bending of the initially straight Si NW are shown in Fig. 2; as in any other type of bending tests interrogating fracture strength, a question is if the bending increments are small enough to resolve the ultimate stress state that the tested specimen can sustain. In the manipulation shown in Fig. 2, the imposed spatial displacement of the AFM probe was increased in 500-nm increments from the same reference point outside and to the right of the short arm of the hook. At each bending step, the balance between the elastic response of the NW and friction between the NW and the substrate was redefined, such that closing of the hook did not necessarily occur at a constant rate. Lateral displacements between 100 and 200 nm were measured for the short arm of the hook in the last imposed probe increments before fracture; the displacements became smaller and smaller as the hook was further bent. Thermal drift within the AFM did not affect the precise relocation of the AFM probe at the reference point where the imposed displacement began; repeatability in imaging the same area (at least 20 images) pointed to a minimal thermal drift of order of nanometers. Hence, very close approach to the ultimate strength state just before fracture could be achieved by reducing the incremental bending steps. In the example shown in Fig. 2, the radius of the hook was reduced progressively in each step [Figs. 2(a)–2(e)] until the most bent part of the NW (the lower part of the hook) broke [Fig. 2(f)] and the built-up stress was released. After fracture, the end of the long NW segment bounced back toward its original alignment and the short segment flew to a nearby location; the long NW segment did not fully relax to its original straight position however, but rested against the contamination trails.
III. ANALYTICAL DETAILS
A. Configuration of a bent NW
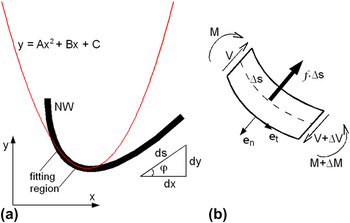
The coordinates, x and y, defining the NW profile in the plane of scan were retrieved from AFM images such as Fig. 2Reference Strus, Lahiji, Ares, Lopez, Raman and Reifenberger43 using DataThief softwareReference Tummers44 to locate the thickest part of the NW, i.e., to trace the middle line along the NW (Any mention of commercial products in this article is for information only; it does not imply recommendation or endorsement by the NIST.). Once the x and y coordinates were determined for all locations along a NW, a parabola of the form y = Ax 2 + Bx + C was fit at each location including six adjacent points (three on each side), as shown in Fig. 3(a). The fitting coefficients, elastic modulus from previous measurements,Reference Stan, Krylyuk, Davydov and Cook17 and NW radius from topographic cross sections of the bent NW were then used to calculate the bending stress and friction force at each location.
(a) Parabolic fit to a bent NW segment. (b) Shear forces, bending moments, and the static friction force acting on a bent NW element in the local normal–tangential (en, et) coordinate system.

B. Stress and force distribution along a bent NW
Determination of the mechanical state of a NW was made in terms of the local stress induced in the NW on bending and the friction force required to hold the NW in its bent state. These two parameters were calculated from the coordinates, x and y, and derivatives, dny/dx n, of the bent NW in the plane of scan, Fig. 3(a), as determined from the profile fit coefficients, A, B, and C. The fit coefficients were used to calculate the local curvature, κ = dφ/ds, and radius of curvature, ρ = 1/κ, of a NW element; the polar angle, φ, and elemental arc length  were defined in the plane of scan, Fig. 3(a). The shear force, V, bending moment, M, and friction force, F n, necessary to hold the NW in its bent position are shown in Fig. 3(b) acting on a NW element.
As the main contribution to bending of the NWs was from moments exerted by friction forces between the NWs and the substrate, the stress state of the NWs was characterized in terms of bending stress; axial stress in the NWs was negligible. From the stress–strain relationship for an isotropic elastic rod, the tensile bending stress σb and strain εb at the outer part of the bent NW are related to ρ byReference Landau and Lifshitz45, Reference Timoshenko46

and

where R NW and E are the radius and elastic modulus of the NW, respectively. By using the expression for ρ in Cartesian coordinates,
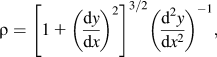
the local bending stress is given in terms of the coefficients of the fit parabola as
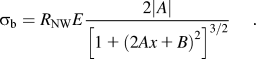
To find the expression for the friction force per unit length, f, the balance of the forces and moments acting on a NW element is used:

and

where V and M are the shear force and bending moment at location s along the NW. By using the expression of the bending moment, M = EIdφ/ds = EIκ, the friction force per unit length and shear force are obtained as

and

where I is the moment of inertia of area about the neutral axis of the NW (equal to  for a NW of radius R NW) and en is the local normal of the NW [see Fig. 3(b)]. By expressing all the Cartesian derivatives in terms of the coefficients A, B, and C of the fitting parabola, the local friction force per unit length, shear force, and bending moment are given by

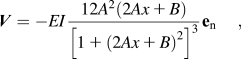
and
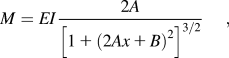
respectively.
IV. RESULTS AND DISCUSSION
A. As-grown Si NWs bent in a hook configuration
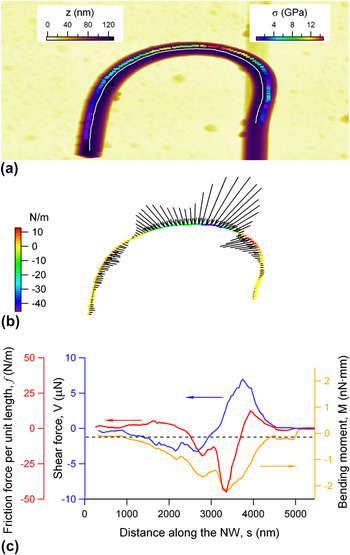
The bending stress and friction force distributions in the most bent region of a Si NW of radius 57 nm are shown in Fig. 4. In this example, the x and y coordinates defining the NW profile [white line in Fig. 4(a)] were measured at locations equally spaced (100 nm apart) along the NW axis. The minimum radius of curvature was approximately 700 nm at the top of the hook. By using Eq. (3), the bending stress profile along the NW was obtained as shown in Fig. 4(a). The maximum bending stress captured in this bending test was 13.1 GPa at the top of the hook. The bending stress obtained compares very well with the maximum bending stress measured on other VLS-grown Si NWs: in one study,Reference Hoffmann, Utke, Moser, Michler, Christiansen, Schmidt, Senz, Werner, Gösele and Ballif14 Si [111] NWs, about 2-μm long, with diameters between 100 and 200 nm, were tested directly at the growth sites, with the NW–substrate junction used as a fixed point and an AFM probe bending the vertical NWs from the top in a cantilever configuration to generate stresses of (12 ± 3) GPa. In another study,Reference Zhu, Xu, Qin, Fung and Lu16 the stress–strain responses of Si NWs of various orientations with lengths between 1.5 and 4.5 μm and diameters in the range of 15 to 60 nm were observed in tensile tests inside an SEM to attain stresses of (11 ± 1) GPa.
(a) The most bent segment of a Si NW hook (image size is 4 × 4 μm2). The bending stress profile along the white middle line of the NW is shown. (b) The friction force per length necessary to balance the elastic forces in the bent NW. The length and orientation of the line segments give the amplitude and direction of the friction force from outside and inside of the hook toward the NW. (c) The profile of the friction force per unit length, f, shear force, V, and bending moment, M, as a function of distance, s, along the NW.

In the friction force profile, obtained using Eq. (8), shown in Fig. 4(b), the force is positive when the friction is directed outward from the hook and negative when directed inwards to the hook. The values calculated here are one order of magnitude greater, probably due to the adhesive effect caused by contaminants, than those found to characterize the friction between other one-dimensional nanostructures and flat substrates (indium arsenide NWs on silicon oxideReference Bordag, Ribayrol, Conache, Fröberg, Gray, Samuelson, Montelius and Pettersson47 and silicon nitrideReference Conache, Gray, Ribayrol, Fröberg, Samuelson, Pettersson and Montelius48 substrates, carbon NTs on silicon oxideReference Strus, Lahiji, Ares, Lopez, Raman and Reifenberger43 and siliconReference Wu, Fu, Hu and Hu49 substrates).
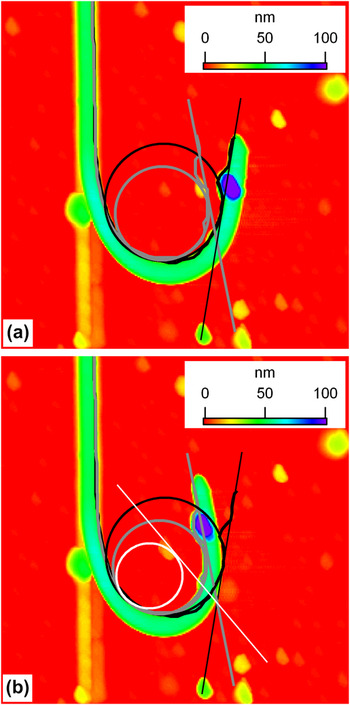
The ultimate bending stress achieved in the example shown in Fig. 2 is analyzed in the following. As inferred from Fig. 2(e), the minimum radius of curvature formed in the last-imaged bending state was about 330 nm, which, from Eq. (3), corresponded to a maximum bending stress of 12.6 GPa, comparable to that determined above. However, close observation of the AFM images in Fig. 2 reveals that in fact the NW experienced greater bending deformation than that determined from the postdisplacement imaging of the curvature of the hook. In this case, substrate adhesion forces were not strong enough to balance the elastic response generated in the hook during bending at the peak-imposed probe displacement. As a result, in the last bending stages, the short arm of the hook relaxed backward after the AFM probe was retracted. This can be observed very clearly from the change in the position of a contaminant that happened to be encircled by the hook (the contaminant is indicated by a tilted arrow in each image of Fig. 2). The contaminant was displaced by the short arm in each bending step and marked the position reached by the short arm at the completion of each AFM probe-imposed displacement increment. The final separation between the contaminant and the short arm of the hook gradually increased during the final increments of imposed displacement after the probe was retracted, from about 300 to about 400 nm, indicating increasing postretraction relaxation. Although the radius of the hook decreased continuously, i.e., the short arm did not relax to the same position after each bending step, the fact that the relaxation displacement increased as the NW was subjected to greater stresses shows that an equilibrium between friction forces at the NW–substrate interface and shear forces in the bent NW was generated to establish the position of the short arm. Such an approach has been followed in examining the sliding friction between various one-dimensional nanostructures and flat substrates.Reference Strus, Lahiji, Ares, Lopez, Raman and Reifenberger43, Reference Bordag, Ribayrol, Conache, Fröberg, Gray, Samuelson, Montelius and Pettersson47–Reference Wu, Fu, Hu and Hu49
In the bending shown in Fig. 2, analysis of the relative position of the contaminant with respect to the imaged NW allows a more accurate calculation of the bending stress attained in the NW before fracture. The true bending state achieved through manipulation is defined by the long NW segment, the point of maximum curvature of the hook, and the position of the movable contaminant. The first and last bending positions shown in Figs. 2(a) and 2(e) are enlarged for clarity in Fig. 5. In Fig. 5(a), the maximum true bending state attained in Fig. 2(a) (defined by the three references specified above) coincides with the relaxed bending state (defined by the NW hook) shown in Fig. 5(b). Superposition of these two bent NW profiles allowed determination of the intersection point of the two tangents that defined the orientation of the free end of the NW in each bending state. To a first approximation, this intersection point can be considered as the pivot point around which the short arm of the hook was rotated as the curvature of the hook was increased through imposed bending. The curvature of the hook in its final true bending state can then be approximated by fitting a circle between the NW and the tangent line defined by the final contaminant position and the pivot point. It was thus found that the radius of the final bending state was about 240 nm rather than 330 nm as indicated by the position of the NW itself. With this determined radius of curvature, the ultimate bending stress for the investigated Si NW was calculated to be 17.3 GPa. The maximum bending strain sustained by this Si NW was approximately 11%. Such large values for fracture stress and strain point to the bending behavior of an almost defect-free Si NW. Taking the toughness of SiReference Cook26 on the (112) plane perpendicular to the NW axis as approximately 0.8 MPa·m1/2 suggests a strength-limiting defect scale of order (0.8 × 10⁶/17 × 109)2 = 2 nm. States of incipient plasticity at strains as small as 2.2% have been observedReference Zheng, Han, Wang, Zhang, Yue, Qin, Zhang and Zhang39 by high-resolution TEM in Si NWs bent into curvatures about four times smaller than the maximum curvature attained in these bending tests. However, it has been shown recently that the plastic deformation of brittle nanostructures investigated by TEM arises through local amorphization induced by exposure to the high-energy radiation of the electron beam.Reference Zheng, Wang, Cheng, Yue, Han, Zhang, Shan, Mao, Ye, Yin and Ma50 Although no structural investigation was performed on the broken ends of the NWs investigated in these tests, the fracture appeared to be brittle and without plastic deformation: No clear tapering around the ends at the fracture point was imaged by AFM, and the broken NW segments relaxed violently into stress-free (straight) states.
A 2.5- × 2.5-μm2 area was selected from Figs. 2(a) and 2(e) to detail (a) the first and (b) the last bending states, respectively. The initial (black) and final (gray) relaxed bending states were defined by the actual position of the bent NW. The profiles are shown for correlation in both (a) and (b) panels. The true final state [white in (b)] is indicated by the position of a movable contaminant.

B. Oxidized Si NWs bent in a loop configuration
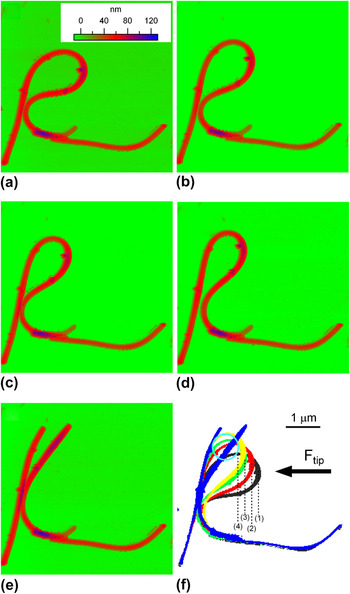
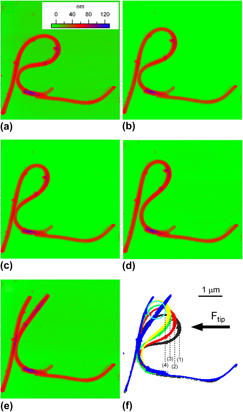
An even more stable configuration for observing NW mechanics during bending was generated when long NW segments were used to form a closed loop (see Fig. 6) rather than a hook. In the first steps of this type of manipulation, a “long” NW segment was dragged 180° around its initial direction and aligned along the unmoved NW segment. The radius of the formed loop was then progressively reduced by pushing with the AFM probe from one side of the loop. Compared with the hook configuration, the loop configuration provides an improved anchoring around its entire perimeter with better balances for forces and moments. The last bending state before fracture is therefore more easily observed in the loop configuration than in the hook configuration. To illustrate this concept, a fully oxidized Si NW of radius 29 nm was bent into a loop and imaged by AFM after each reduction of the loop radius. The last bending states before fracture are shown in Figs. 6(a)–6(d). The AFM probe was dragged into contact with the NW from the right [as indicated by the horizontal arrow in Fig. 6(f)] and advanced toward the left by 200 nm in each increment. The NW positions as imaged by AFM after each bending step are superimposed in Fig. 6(f). Both sides of the loop were moved to the left in each imposed displacement increment: The right side as pushed by the AFM probe and the left side as a result of the increased bending stress in the loop. Unlike the previous cases of hooks with short arms, the adjustment in the position of the right side of the loop suggested that the mechanical equilibrium between the friction forces and bending moments was mostly settled before the AFM probe was retracted. Consequently, the imaged NW is in a bent state very close to that imposed by the AFM probe. By relating the separations between two successive positions of the right side of the loop to the 200-nm imposed displacement of the AFM probe at each step [the vertical dotted lines in Fig. 6(f)], a small postdisplacement relaxation of the loop was revealed, over a distance of about 150 nm in the last bending state. This distance is less than half of the relaxation distance (separation between the contaminant and the right arm of the hook) in the hook configuration [Figs. 2(e) and 5(b)]. It was therefore concluded that the last bending state in the loop configuration was even closer to the ultimate bending state than in the hook configuration.
The last bending, (a) to (d), states of a 29-nm fully oxidized Si NW imaged by AFM. The NW was forced to bend into a loop of smaller and smaller radius until failure occurred. (e) The arrow indicates the direction along which the AFM probe was dragged to push into the loop. (f) The progressive bending of the loop is observed by superimposing the positions of the NW from (a)-black, (b)-red, (c)-green, (d)-yellow, and (e)-blue, respectively. Numbers from (1) to (4) are associated to these bending states and indicate the AFM probe positions at the end of each displacement increment. The bending curvature achieved in state 4 is derived in (f) from the circle fit between the position (4) of the AFM probe (dotted line) and the left side of the loop. The same z-scale applies for each scan. The scan area was 5 × 5 μm2.

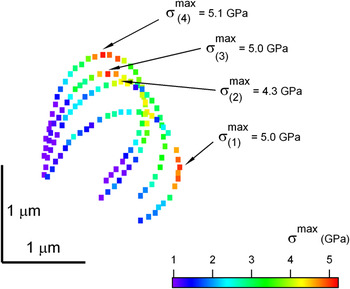
The distribution of the bending stress along the most bent region of the loop was calculated for each bending state imaged in Figs. 6(a)–6(d) using Eq. (3). The results are shown in Fig. 7, with the subscripts 1 to 4 corresponding to the states (a) to (d), respectively. Initially (state 1 in Fig. 7 or state (a) in Fig. 6) the region of maximum bending stress (about 5.0 GPa) was located on the right side of the loop. As the loop was progressively pushed toward the left, the stress distribution changed along the loop and the top of the loop was put into greater stress. During this stress redistribution process, the maximum bending stress at the top of the loop first decreased to about 4.3 GPa (state 2 in Fig. 7) and then increased to about 5.0 GPa (state 3 in Fig. 7). A more accurate estimation of the last-achieved bending state can be rationalized by considering the last position reached by the AFM probe [position (4) in Fig. 6(f)]; the minimum radius of curvature for this last state can be approximated as half the distance between position (4) of the AFM probe and the position of the left side of the loop. Using this approximation, the minimum radius of curvature was approximately 350 nm, which, using Eq. (3) corresponds to a bending stress of 6.2 GPa. The maximum achieved bending strain was estimated to be around 8.3% for this fully oxidized Si NW.

The observed maximum bending stress of 6.2 GPa for fully oxidized Si NWs is in the range of the ideal fracture strength for SiO2, approximately a tenth of the elastic modulus. As in the case of as-grown Si NWs, the fracture of the tested fully oxidized NW appeared to be brittle with the two broken segments snapping back into relaxed positions [refer to Fig. 6(f)]. Taking the toughness of SiO2Reference Cook26 in air as approximately 0.5 MPa·m1/2 suggests a strength-limiting defect scale in this case of (0.5 × 10⁶/6 × 109)2 = 7 nm. Values of strengths in the range of 10–15 GPa were measured in tensile tests for the ultimate fracture strength of silica glass NWs of elastic modulus around 100 GPa and radii in the range of 50–300 nm. Such large values for the fracture strength of silica NWs are one order of magnitude greater than that measured for SiO2 thin films and two orders of magnitude greater than that for bulk SiO2 samples.Reference Hatty, Kahn and Heuer51 As has been argued above, the explanation for the observed enhancement in the great fracture strengths of one-dimensional SiO2 structures compared with their two- and three-dimensional counterparts is that the number and size of flaws are reduced with the reduction of the specimen size. Moreover, it has been suggestedReference Brambilla and Payne31 that enhanced fracture strength would be possible for amorphous SiO2 NWs compared with their crystalline counterparts due to a greater mechanical flexibility of amorphous structures to accommodate defects, whereas the stiffness of the crystalline structure of Si NWs is more prone to crack initiation. In our measurements, comparable ratios of σf/E were observed, 11% for as-grown single crystalline Si NWs and 8% for fully oxidized amorphous Si NWs, and comparable defect sizes, of order nanometers.
V. CONCLUSIONS
A new procedure for determination of the bending stress and fracture strength of NWs was proposed in this work. Based on a simple AFM manipulation, two different bending configurations (hook and loop) were generated for observing the ultimate bending stress states that NWs can sustain before fracture. The NWs tested were fixed in the various bending configurations reached during manipulation by the adhesion and friction between the NW and substrate; subsequent AFM imaging was used to capture the configuration details of the bending states. The great advantage of the new bending test consists in its simple AFM manipulation without any additional delicate handling of NWs such as transfer, positioning, or holding. In all of the hook and loop configurations it was possible to observe large bending stress states of as-grown and fully oxidized Si NWs as their radius of curvature was progressively reduced. Thus, the greatest bending stresses sustained by the NWs tested in this work were found to be 17.3 GPa for an as-grown Si NW of 26-nm radius and 6.2 GPa for a fully oxidized Si NW of 29-nm radius, respectively. These stress values were determined under the assumptions that the bending of NWs before their brittle fracture was elastic and resembled that of an isotropic homogenous rod. Deviations from these ideal assumptions, as well as detailed insight into the fracture characteristics of the Si NWs subjected to such nanoscale bending tests, can be provided by additional microstructure investigations (e.g., TEM investigation of possible structure defects).