

1. Introduction
In the early eighteenth century, Swedish agriculture rested to a large extent upon institutions created several centuries earlier. Land management was regulated by the inherent collective character of the open-field system, the land market was controlled by the state and by kin-relations, internal migration was restricted, trade was only allowed to take place within the small towns and exports of many food items were prohibited. A hundred and fifty years later land was managed individually, new crops and crop rotations had been introduced and markets for food, labour, land and capital had emerged. During the same period Sweden turned from being a grain importer to having grain as one of its foremost important export items. This was achieved although population increased more than two and a half times, from around 1.4 million in 1700 to 3.8 million in 1860. Was this apparently simultaneous development a coincidence or did a changing institutional structure have an effect on agricultural growth? Were enclosures, the strengthening of property rights and the deregulation of trade decisive factors explaining growth? If not, what caused Swedish cultivators to increase their production?
The impact of institutions on growth has been discussed extensively. Proponents of the positive effects of the ‘right’ institutions have advocated the economic incentives of secure and stable property rights (North and Weingast Reference North and Weingast1989), the possibilities of flexibility with individual decision making in agriculture (Overton Reference Overton1996), and the commercial possibilities of integrated and deregulated markets (Persson Reference Persson1999). Critics, on the other hand, have downplayed the role of institutions, pointing to cases where well-functioning institutions have emerged long before growth took place (e.g. Clark Reference Clark1996 and 2007), or arguing that it was not institutional change within agriculture but urban development that caused the rising output in agriculture (Allen Reference Allen2009).
Most of these studies have been performed at a macro-level, but to delve deeper into the elusive explanatory variables of growth and transformation requires micro-level data. Although national accounts or macro-estimations of production are of much value, among other things for making it possible to date phases of growth and to relate growth to state policy, trade regulations and other national factors, it is at regional or local levels that most causes of, and constraints to, growth are to be found. The data must also reflect the diversity of the rural society so that different factors put forward as explanations for growth may be estimated and valued.
The aim of this article is to explain pre-industrial agricultural growth with a special focus on institutional change. We accomplish this by providing explanations for trends and variations in the development of agricultural production in southern Sweden from the early eighteenth to the mid nineteenth century. We use a regional approach to estimate production at a micro-level by studying an area with unique source data on production, population, prices and taxes. This area is Scania (Skåne), which contains a variation of some of the most common types of north European agricultural settings in terms of socio-economic and topographic conditions as well as land management. Our main sources are local tithes that were proportional to output, allowing us to estimate annual production for over 2,000 farms with different characteristics. We not only estimate the production development during this period, but also compare different types of farms to ascertain the effects of institutional changes and general commercialization simultaneously in order to understand the important factors behind growth.
Some of the most significant questions regarding the causes of the development of agricultural production can therefore be elaborated in detail: what institutions and institutional settings, such as property rights and state initiatives, promoted growth and which of them were obstacles to growth? How profitable were different forms of land management? Were there differences between, for example, peasantsFootnote 1 and persons of rank? How did the enclosure movements, the initial reallocations of land in the eighteenth century and the radical enclosures in the nineteenth century, affect production output? What was the role of the markets?
We start by discussing the potential impact of institutions on growth. From this we move over to the implications of using tithes as sources for production estimates. In the empirical part, we first measure agricultural production in southern Sweden for the period 1702 to 1864 and discuss the overall trend and variations. We then explain differences in economic performances at a micro-level, elaborating a number of possible determinants in a multivariate regression analysis.
2. Institutions and growth
The agricultural revolution is often used to imply a transformation from a stagnant or slow-growing state of production to a fast-growing, more productive agriculture. Over the years there has been much debate on whether, and particularly if so when, an agricultural revolution took place in different provinces and countries. Dating this event requires extensive, detailed and trustworthy data on agricultural production and/or productivity. This is, however, only half the story if we want to define what the agricultural revolution really was; finding a marked and sustainable increase in agricultural production opens up the possibilities of explanation. What were the decisive factors for growth and transformation? After all, this is what most of us want to know. Thus, the problem consists of two sub-problems to be solved: (a) estimating output, and (b) assessing factors important for changes in output.
Many scholars have devoted a massive amount of time to solving the first part of the problem. Differences in available sources and variations in methods have generated different outcomes even within the same country or region. For England, the most studied country by far, these differences in data and methods have caused a large debate on whether the agricultural revolution occurred in the sixteenth, the seventeenth, the eighteenth or the nineteenth century (e.g. Kerridge Reference Kerridge1973; Allen Reference Allen1992; Overton Reference Overton1996; Turner et al. Reference Turner, Beckett and Afton2001). For France, the traditionally held view of a very late transformation (Bloch Reference Bloch1966) has been challenged in more recent work, which states that farmers in some regions of France were as productive as English farmers already in the eighteenth century (Hoffman Reference Hoffman1996). Similar revaluations of growth development for other countries are also taking place (e.g. for Spain: Simpson Reference Simpson1995 versus Lana forthcoming).
This is, however, only part of the problem. As has been said, explaining growth depends on the possibilities of using data not only for dating growth but also for explanation. The research on European agriculture has drawn attention to several important factors affecting growth. One set of factors is related to institutions, particularly to the property rights structure. The distributional effect of institutions is in focus when discussing the leaders of the agricultural transformation. One explanation for growth is that new groups appeared on the scene, introducing new and more efficient forms of agricultural management. This view most often attributes growth either to enlightened landlords or to newly engaged commercial classes, or to both (e.g. Heckscher Reference Heckscher1949; Brenner Reference Brenner, Aston and Philpin1985). Others, however, have stressed that it was the traditional groups of farmers that were actually responsible for the transformation and growth (e.g. Allen Reference Allen1992; de Vries Reference de Vries, Hoppenbrouwers and van Zanden2001; Svensson Reference Svensson2006). One argument for the latter view is that more secure and widened property rights to land for these traditional groups of farmers allowed them to retain a larger share of production for themselves (Kerridge Reference Kerridge1973, p. 135; Herlitz Reference Herlitz1974; Winberg Reference Winberg, Lundahl and Svensson1990).
This argument is in line with arguments supporting the general positive effect of stable and secure property rights. Even if some researchers see a direct link between the establishment of these kinds of property rights and economic growth (Olson Reference Olson1993), others argue that even if they did not create growth entirely by themselves, they made it possible to expand and continue growth, something that would have been much less viable in a society with insecure property rights (North and Weingast Reference North and Weingast1989, p. 805). On the other hand, Clark (Reference Clark2007, p. 147), as one of the critics of the institutional explanation, argues that medieval England had a structure containing higher economic incentives than modern England has today. This finding of a pre-industrial society with institutional stability and a developed economic incentive structure, but lacking major technological advance, makes Clark conclude that institutions did not matter for growth.
The positive effect of individual, as opposed to collective, property rights has also been debated. As regards agriculture, this has mainly focused on the impact of enclosures on growth and transformation. One side has highlighted the idea that the enclosure of land, and the subsequent abolition of the open-field system, led to a more efficient agriculture where individual farmers could adopt inventions and change their management in accordance with their specific soil conditions and personal ideas. In all, this increased the possibilities of growth as compared to farmers still using the open-field system. Several researchers have rejected this proposition and stated that change was just as possible in the open-field system (e.g. Allen Reference Allen2009, pp. 67–74). Estimates of the gain from enclosures have varied significantly, but in most studies there is a positive effect on growth and productivity (McCloskey Reference McCloskey, Parker and Jones1975; Allen Reference Allen1982; Clark Reference Clark1998). Whether this growth is large or not is debatable, depending on what it is compared to.Footnote 2
Another set of factors concerns markets; some researchers consider changes outside the agrarian sector as the most important factors affecting economic incentives to raise production and increase productivity. Rising prices emanating from increased demand from urban areas or other countries (Slicher van Bath Reference Slicher van Bath1963, p. 116), stable prices due to increased market integration combined with trade deregulation (Persson Reference Persson1999, chapters 5–6) and a supply of superior goods from the outside (de Vries Reference de Vries, Parker and Jones1975, pp. 205–9) are examples of this. Allen (Reference Allen2009, chapter 3) argues that a combination of these factors caused the growth in agriculture in England. It was the expansion of cities and the high-wage economy that made agriculture raise output, not institutional change within agriculture causing cities to grow. Higher output and increased productivity in agriculture were achieved when agricultural labourers moved to urban areas, forcing the remaining farmers to economize on labour. The farmers also desired an increased supply of non-agricultural goods and, as argued by de Vries, became industrious and raised output to be able to buy these products. For France, Grantham has shown that agricultural supply during the nineteenth century was price elastic. Farmers responded to demand, primarily from urban centres but also emanating from regional specialization, and were able to enlarge their production substantially (Grantham Reference Grantham1989). The outside forces, markets and institutions, are also highlighted in other studies of France (e.g. Hoffman Reference Hoffman1996).
Our intention in the following is to contribute to, and deepen, this discussion by estimating the development of production in one Swedish region and by assessing the importance of different factors, primarily institutional and market factors, for growth.
3. Tithes and production
Starting in the Middle Ages, the tithe was an important part of the tax system in most parts of Europe. In some countries this form of taxation of agriculture survived into the twentieth century, but was, by then, seldom proportional to annual production output. Originally, the whole tithe in principle corresponded to 10 per cent of every peasant's production output. The 1960s and 1970s saw extensive historical research on tithes in many European countries. The question at issue was typically agricultural production output and its interaction with demographic change, from the Middle Ages until the beginning of the nineteenth century. The results of this research, which are mainly regional grain production estimates for the period before 1800, indicate an increase in agricultural production in the eighteenth century for major parts of western and central Europe. This development, however, was not in any way uniform (see Le Roy Ladurie and Goy Reference Le Roy Ladurie and Goy1982). The most serious criticism against tithe research and its results is based on the notion that the tithes paid and registered to a certain cathedral or other ecclesiastical institution did not correspond to the entire farm production of the decimants. Other parties, such as local priests or secular interests, could, for example, claim the surpluses from new crops or from altered land use (Hoffman Reference Hoffman1996, pp. 83–4).
Aggregated tithes at county level in Sweden have been used in a study on agricultural development in the sixteenth and seventeenth centuries. Uncertainties about what is really included in these tithe series (number of decimants, change in collection premises, etc.) have led to the conclusion that they cannot be used for simple production output estimates (Leijonhufvud Reference Leijonhufvud2001). However, tithe rolls at the individual farm level have been used by Swedish researchers to estimate changes in grain production (Helmfrid Reference Helmfrid1949; Olsson Reference Olsson2005; Berg Reference Berg2007).
In the southernmost province of Sweden, Scania, grain tithes were divided into three distinct parts, with three distinct recipients: the crown, the church and the local clergy. The two former parts of the tithes were regulated to a fixed yearly amount per farmstead in 1683, and stayed unaltered until the abolition of tithes in 1904. However, the clergy's grain tithes in many Scanian parishes remained a constant share of output until the middle of the nineteenth century. The same goes for the animal tithes, which in their entirety were reserved for the parish priest. Together they constituted a substantial share of the clergyman's personal income and therefore he kept close and elaborate accounts of each payment and of each peasant's animal breeding.Footnote 3 This was made possible by the fact that the clergyman himself was an active farm manager living next door to the peasants paying the tithes. Every thirtieth sheaf from each peasant was collected annually and went directly from the field to the clergy's barn. Thus, to prevent fraud it was possible for the clergyman himself to go out into the fields and count the number of sheaves each peasant had harvested. This must have been quite easy as long as the open-field system prevailed, but even afterwards the clergymen could keep track of each peasant's production. There are indeed several indications, also in the nineteenth century, in the tithe rolls that the clergymen actually went out into the fields to check production. One example is from the parish of Billinge, where the parish clergyman wrote regarding the tithe collection from one farmer in 1846: ‘Of the rye, one and a half sheaves were inferior, while the rest was bad. Next year I must count.’ Furthermore, in 1853 he noted that another farmer ‘had sown over half a hectare of peas, for which he has not reported [any tithe] to me’ (Tithe rolls, Billinge parish).
The tithe accounts are very detailed, containing information on individual crops. For most farms rye, barley and oats, which were the contemporary staple crops of Scandinavia, were registered. For some farms wheat, buckwheat, peas or beans were also accounted for, displaying the variation in crop production in different areas of Scania. For the animals, every tenth calf, foal, piglet, lamb and gosling born also found its way to the parsonage. In principle, no farm production (except for potatoes in the nineteenth century, see below) was exempted from priest tithes, not even production outputs from newly reclaimed land.
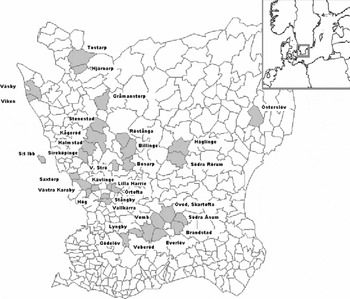
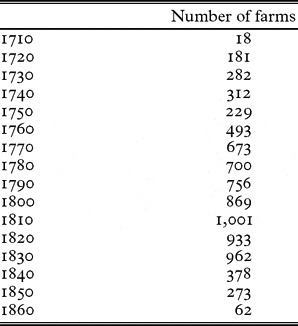
The data set contains 34 parishes with tithe rolls of about 2,200 tithe-payers. Together they cover the period 1702–1864, making a total of more than 80,000 observationsFootnote 4 of farm production (see Tables 1 and 3; crofts and cottages omitted in the latter). On average, 450 farms are represented each year. The material reflects a broad selection of the province's geographic and socio-economic conditions. For each farm in the sample the yearly tithe payments have been registered into a database, the Historical Database of Scanian Agriculture. The sample covers 162 years, but no individual farm is included for the whole period. The lengths of observations vary – far from all tithe accounts are preserved, and, furthermore, some farms or whole parishes converted proportional tithes to fixed tithes during our period of investigation.
The region of Scania and the 34 parishes in the sample

Number of farms in the sample by year

Note: Only every tenth year is shown although data exist for all the years in between as well.
One objection to tithes as sources for production estimates is that they do not reflect changes in land use from arable to pasture, nor the outputs from leys in crop rotation systems (Hoffman Reference Hoffman1996, pp. 83–4). However, this is not a problem in the Scanian case. The sample contains animal breeding as well as outputs in grain production, and possible changes in land use are thus reflected in one or both of the outputs. Another objection is that new crops were not included in the tithes. During the eighteenth century potatoes were mostly cultivated together with other vegetables in the peasant's kitchen garden, but in most parts of Sweden potatoes rapidly moved out into the arable land in the century to come (Utterström Reference Utterström1943; Lägnert Reference Lägnert1955). They are seldom reflected in the tithe series. A royal ordinance in 1808 stated that the clergy of Scania, who by then had already benefited well from a rise in peasant productivity, was not entitled to tithes from potatoes, even when they were planted in the fields.Footnote 5 Fortunately it is possible, from other sources, to calculate the potato share of production output for each parish (see below). In all, the tithe rolls for Scania are very detailed documents creating a unique opportunity for estimating production at the individual farm level over time.
4. The development of agrarian production, 1702–1864
An average peasant farm in the fertile plains of southern Sweden in the middle of the eighteenth century consisted of about 25 hectares of land, of which about 18 hectares were cultivated. In the more wooded areas the total acreage of the farms could be five times as high, but the arable land was smaller, often not more than 5–8 hectares.Footnote 6 In the latter case, typically, all the fields were cultivated each year, while in the plains one-third was bound for fallow. Mantal was the major assessment for taxation in Sweden until 1900. Like the English hide, it was conceptually the amount of land needed to support a peasant family, thus it was a virtual unit of land assessment for purposes of taxation. All farms in Sweden were taxed by this rigid measurement of production capacity. Normally, the highest possible rate for a peasant farm was 1 mantal, while manorial demesnes could be assigned 5–6, and sometimes even 10 mantal. Since it was a tax capacity measure the acreages varied. On the fertile plains a farm taxed one-third of a mantal could consist of 20 hectares, while in the forests an equally taxed farm could be 100 hectares in size. When a farm was divided, its mantal was divided between the parties, but the total sum of mantal in Sweden and in Scania was almost unaltered between 1688 and 1900. In the middle of the eighteenth century the average farmstead in our sample was taxed 0.37 mantal; by 1850, due to farm division, the average had reduced to 0.28.
Two enclosure movements, with completely different aims and results, ran simultaneously in the Swedish countryside in the nineteenth century: manorial enclosures and peasant enclosures. About one-third of the land, in terms of mantal, was owned by the nobility in the early eighteenth century, but in the eastern part of the country, in the districts surrounding the capital Stockholm, as well as in the very south, the fraction was about half. This part of the country experienced a late wave of manorialism, characterized by demesne expansions by means of evicting tenant farmers. In Scania these manorial enclosures in the nineteenth century implied that the sizes of demesnes often increased from one-tenth to half of the affected parishes’ acreage. At the same time crown tenants in adjacent parishes turned into freeholders by means of purchases, and became increasingly active in the morphological and economic transformation of the countryside. After half a century of more modest reallocations of land within these peasant villages, the radical enclosure movement took off, supported by new legislation in 1803 (Scania) and 1807 (the rest of the country). In the course of a couple of decades almost all plain land villages were broken up to build individual farmsteads. Prompted by a new Act of legislation in 1827, the more wooded parts of Sweden followed suit soon after.
During this relatively short period Sweden turned from a grain-importing to a grain-exporting country. Thus, its agricultural transformation offers an intriguing story of diverging developments in property rights and institutional settings, trigged by the same commercial opportunities. But how did these settings correspond to actual agricultural output?
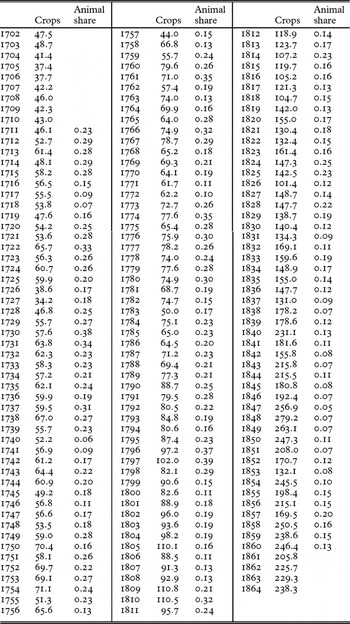
To calculate the crop production from priest tithes we have to convert sheaves into threshed quantities as well as weigh the different crops in relation to each other. To solve the first matter, we use threshing accounts from the clergymen collecting the tithes in three of the parishes. These accounts display the amount of grain in litres that were threshed from the very sheaves on which we estimate the production. We also use threshing accounts from some of the manors in the area to cover all types of natural conditions present in the sample. Second, we weigh the different crops using their respective prices in relation to the mean price of the two dominant crops, rye and barley. As for potatoes, to overcome the problem of the only crop of importance being omitted from the tithe series, we add its volume to the individual series according to its share of total crop production at parish level. The average potato share in the sample increased from 4.4 per cent (1802–4) to 11.8 per cent (1817–21) and 18.6 per cent (1857–60).Footnote 7 Animal production is calculated by annual breeding of foals, calves, lambs and geese. These figures are multiplied by annual prices, and aggregated to animal production values for each farm. Animal production shares (Table A1) are derived by comparing these figures with annual crop production values.
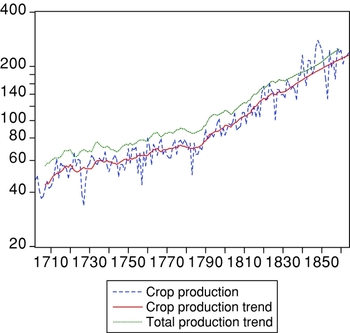
Production development is shown in Figure 1 and Table A1. It is measured in hectolitres per average farm size in 1770; thus we follow the same farm size over time. This makes it a total area productivity estimate regardless of land use. The livestock husbandry shares of total production value for all farms were 22 per cent in the eighteenth century but only 14 per cent in the nineteenth century. The impression of a downward trend in livestock production is strengthened by the fact that the relative price went in the opposite direction: it increased for animals in the nineteenth century. Still, foals and some of the calves were produced to be used as draught animals, and must be regarded as investments in fixed capital and not pure production outcomes. Grain production was actually predominant as early as the eighteenth century, due to factors like Scania's natural conditions, its lack of major cities and the cattle plagues. The nineteenth century saw a further decrease in animal gross output due to a change in farm capital composition: new and better ploughs reduced the need for draught animals (Gadd Reference Gadd1998, pp. 116–17; Olsson Reference Olsson2005, pp. 129–30).
Production estimates 1702–1864, with trend (hectolitres per farm), logarithm scaling
Source: Historical Database of Scanian Agriculture.
Note: Crop production is displayed with annual variation and trend for an average farm size in 1770. The trend is an 11-year moving average, except for the last 23 years, which has been smoothed with a simple linear trend from 1841 to 1863.

The most important explanatory variables for short-term variations in agriculture are temperature and humidity. The weather will not be elaborated on any further in this study, but two important observations strengthen the reliability of the data set. First, there is a strong short-term correlation of different parishes in different parts of Scania. The correlation of annual fluctuations in output at the parish level shows that parishes situated 50–100 km apart from each other display correlation coefficients between 0.65 and 0.85. The mean coefficient for 293 pair-wise estimations is 0.56 and in spite of ‘hard’ trend elimination, through first differences, it remains at 0.54. The strong short-term covariance on semi-aggregate level reveals that yearly fluctuations in climate had a similar, but far from identical, impact on production outcomes for farmsteads with varying natural conditions. It also tells us that the clergy's tithes, as they were registered per farmstead, varied with these fluctuations.
Second, bad harvest years, as well as good ones, tend to correspond with contemporary qualitative sources, e.g. reports from county governors. Earlier researchers tried to systematize these reports into a 5- or 7-degree scale, starting with ‘crop failure’ and ending with ‘plentiful’ (Hellstenius Reference Hellstenius1871; Utterström Reference Utterström1957). It is obvious that almost all reported years of bad harvests (1 and 2 on the scale) correspond with crop failures in our estimated outputs. Good harvests were more randomly reported in the eighteenth century, but, even so, we find a surprisingly high number of years with correspondence. The overall correlation coefficient between our series and the qualitative sources, including all years with ‘normal’ harvests, is somewhat above 0.5 after trend elimination. These findings shed new light on the contemporary judgements of harvests, often strongly criticized by researchers, and they again strengthen the reliability of Scanian priest tithes as reflectors of variation in agricultural output.
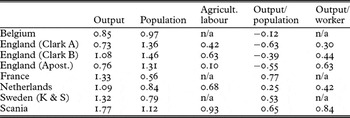
Turning to long-term development, we find periods of strong growth, but also periods of stagnation. The mean annual growth rate for the period 1702–1864 was 1.0 per cent, before 1780 more modestly 0.6, and after that 1.4 per cent. When comparing this to population growth, we find that the annual growth rate of population in the selected parishes was 0.66 for the first period and 0.86 for the second period, showing that production increased much faster than population after 1780.Footnote 8 In relation to other north-western countries, Sweden experienced the most rapid per capita output growth in agriculture during the first half of the nineteenth century, except for France (see Table 2; cf. also Federico Reference Federico2005, chapter 3). While Belgium, England and the Netherlands faced negative or slow per capita growth, Swedish, and not least Scanian, agriculture grew much faster than population. Besides, the growth per worker was faster in Scania, 0.8 per cent per year as compared to 0.4–0.6 for the north-western European leading economies. Since growth in output per worker was apparent in these countries at least during most of the seventeenth and the first half of the eighteenth century (Allen Reference Allen2000, p. 21; Clark Reference Clark2002, table 7; Apostolides et al. Reference Apostolides, Broadberry, Campbell, Overton and van Leeuwen2008, table 18), whereas it was stagnant in Scania, the table probably illustrates a catching-up effect in the Swedish case. This occurred during the period preceding the large increase in urbanization, which explains the relatively similar growth rates of total population and agricultural population. The difference between the growth rates in Scania and the whole of Sweden is explained by the fast agricultural change during the first half of the nineteenth century in the former case; parts of Sweden still lagged behind. Some of the difference is perhaps also explained by the sources of the output series. The Krantz and Schön series are, like other comparable national agricultural accounts for this period, estimated by means of population and price indicators; the Scanian series is based on direct production indicators at micro-level.
Output per capita and output per worker in Belgium, England, France, the Netherlands, Sweden and Scania, c. 1800–50, annual growth rates

Sources: Belgium 1812–46: Goossens Reference Goossens1993, table 5; England Clark A: 1795–1865 and Clark B 1805–55: derived from Clark Reference Clark2002, tables 3, 5 and 7; England Apost. 1800–50: Apostolides et al. Reference Apostolides, Broadberry, Campbell, Overton and van Leeuwen2008, tables 15,17 and 18; France: derived from Smits et al. Reference Smits, Woltjer and Ma2009; the Netherlands 1807–50: derived from Smits et al. Reference Smits, Horlings and van Zanden2000; Sweden K & S 1800–50: output from Krantz and Schön Reference Krantz and Schön2007, table 1B, population from Historisk statistik för Sverige; Scania 1800–50: output from Historical Database of Scanian Agriculture, population and agricultural population derived from Palm Reference Palm2000.
Note: The measurement of agricultural labour differs between the sources: Clark (Reference Clark2002) uses male labourers in agriculture; Apostolides et al. (Reference Apostolides, Broadberry, Campbell, Overton and van Leeuwen2008) use agricultural population; Smits et al. (Reference Smits, Horlings and van Zanden2000) use labour force in agriculture; for Scania we use the population in the sampled parishes which were totally dominated by agriculture during this period (see van de Putte and Svensson Reference Putte and Svensson2009). Finally, the output for Scania is the mean output 1796–1804 as compared to the mean output of 1846–54.
The trend curve with moving 11-year averages helps us to reveal the secrets of the eventful eighteenth- and nineteenth-century peasant agriculture. Our point of departure is that the peasants at any point in time, given their technological, institutional and commercial prerequisites, were optimizing their grain output. This meant that eighteenth-century Scanian agriculture was still balancing on the edge of its traditional ecological potential, threatening to impoverish the soil's nitrogen potential. The innovations before the nineteenth-century radical enclosures did not remove this fundamental production obstacle, but led to improvements in farming techniques, better drainage and more efficient allocation of plots.
A first stagnant period at the beginning of the eighteenth century occurred during the Great Nordic War, which affected the peasantry of Scania through forced army enlistments and levied tax burdens. Battles between Swedes and Danes took place in Scania 1709–10, but mainly affected the town of Helsingborg and its close vicinity (Johannesson Reference Johannesson1971, pp. 310–13). From 1711 till the end of the 1730s a first growth period took place, which may also be seen as a time of recovery after the decline at the beginning of the century. Moreover, in terms of peasant prosperity, the growth in grain production was counteracted by serious cattle diseases, which severely reduced the livestock. The 1740s again saw a stagnant period. This was connected to harvest failures and cattle plagues and might be an explanation for the rising concerns from the government in Stockholm and its officials about the productivity in Scania, by then the only major grain surplus district in Sweden. Increased attention was given to farming techniques, drainage and consolidations of scattered field strips, leading to some early initiatives for the reallocation of land within the villages in the plain lands. This was, for example, the case in 1748 in Hög, and in 1752 in Västra Karaby, two of the villages in our sample. Better drainage and land consolidation were two motives for land reallocation put forward by the peasants in these villages (Olsson Reference Olsson2005, pp. 110–11).
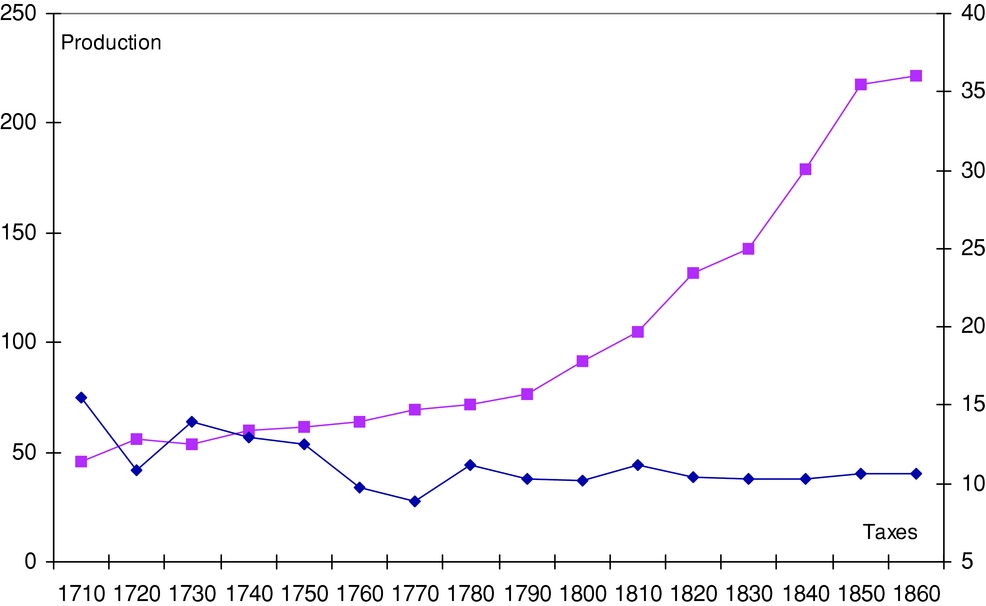
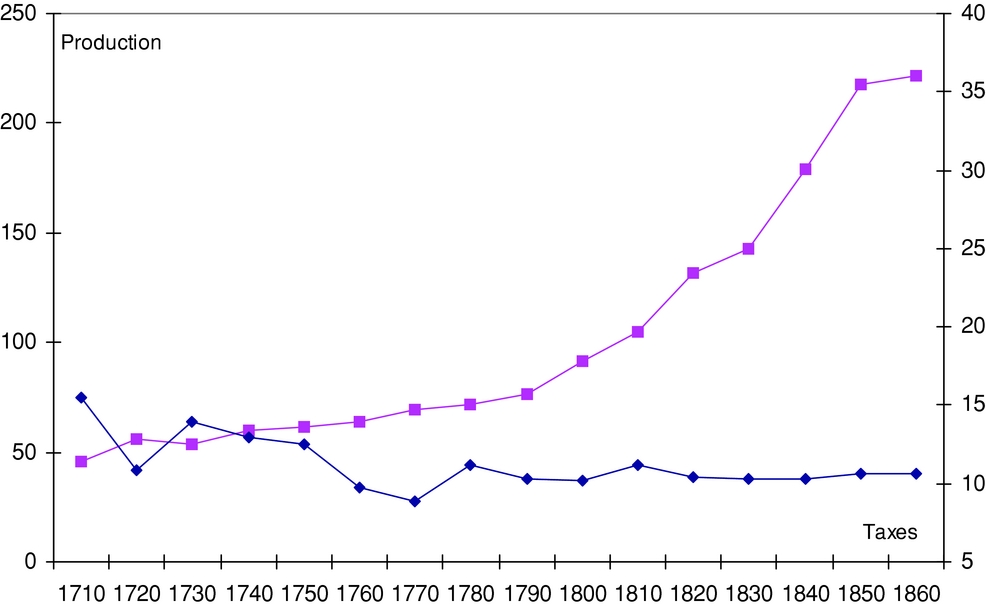
In the eighteenth and nineteenth centuries the real tax burden was decreasing for the freeholders and tenants under the crown in Sweden. With rising prices in the mid eighteenth century, this development accelerated and created new long-term incentives for peasants to raise production. The growth period was only interrupted by a short stagnant period in the 1780s, shortly after the ‘coin conversion’ in 1776, which meant doubled land taxes from one year to another for some peasants. As can be seen in Figure 2, this was more an incidental interruption in the overall real tax reduction than a serious blow to the peasant economy. In the 1710s an owner-occupying peasant (freeholder) in Scania typically paid 30–35 per cent of the farm's gross production in taxes; in the 1850s this fraction was down to 5–8 per cent. Crown tenants’ land rents were identical to these taxes and they experienced the same pattern of real tax reduction. Manorial tenants paid hardly any taxes at all to the crown, but their land rent was raised in the nineteenth century, most often in the form of increased corvée dues, and the total sum of tax and land rent remained over 25 per cent of the farm gross production throughout the period of investigation (Olsson Reference Olsson2005, pp. 172–7).
Production and taxes 1710–1860, hectolitres of grain per farm
Sources: Olsson Reference Olsson2005, p. 98; Historical Database of Scanian Agriculture.
Note: Ten-year averages, production scale to the left, tax scale to the right. Total tax estimates for a freeholder's or crown tenant's farm of average size in 1770 (0.37 mantal), inhabited by four adult tax-payers: man, wife, farmhand and maid.
After a major harvest failure in 1783, followed by a severe winter and some hard years, production began to rise even faster. The intense growth period lasted until 1824. The early form of reallocation of land, and from 1803 the radical enclosures, ran continuously in the villages. Sometimes they led to temporary stagnation or drops in farm production, but were soon followed by even higher rates of growth. The period 1825–33 saw a weakening in farm production growth. Grain prices had been falling or stagnant from 1820. For many farms this can be characterized as an adjustment period. Many villages that had not gone through radical enclosures between 1803 and 1819 did so after a new enclosure Act in 1827. The enclosed farmsteads took important steps towards a new farming system, which would raise production dramatically. The fallow was reduced or abolished and fodder plants and potatoes were integrated in the crop rotation system. The following growth period, once more encouraged by rising grain prices, was the gain from these adjustments.
5. Determinants of agricultural output
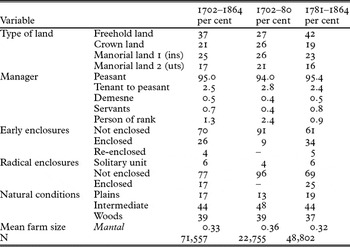
The overall estimation of crop production indicates phases of growth and stagnation. Some of these results are new findings, while others correspond to earlier notions of agricultural development. In order to explain agricultural development we must, however, return to the micro-level and analyse possible determinants of individual farms’ output. We estimate a regression model of the crop production using a panel data approach, which could be characterized as estimating cross-sections over time. All taxed farms with crop production, 2,125 farms providing over 71,000 observations, are included in the regression and the independent variables are used to explain variations, within the specific farms as well as between farms, over time. These explanatory variables correspond to some factors that earlier research has regarded as crucial for agricultural growth.
The dependent variable is crop production, in grains and potatoes. The mean value of this variable, for the whole period, is 54 hectolitres per farm. The independent variables are farm size, type of ownership, type of management, early enclosures, nineteenth-century radical enclosures, change in population density, and natural conditions expressed in terms of whether the farm was situated on the plains or in the intermediate or wooded parts of the province. The natural conditions to some extent also reflect transport costs, since the harbours and cities in Scania were located on the plains and the forests were more remote. Natural conditions are also strongly correlated with population density at parish level. To control for population we add a parish-unique variable, an index for population change, each parish starting with 100 in the year 1700. The impact of markets is measured with the expected real prices of grain and with dummy variables for deregulation of trade in 1775, 1810 and 1828. Finally, we control for time, i.e. for unobserved events and uneven distribution of covariates, using period dummies every tenth year.
Descriptive statistics of the sample, percentage of observations

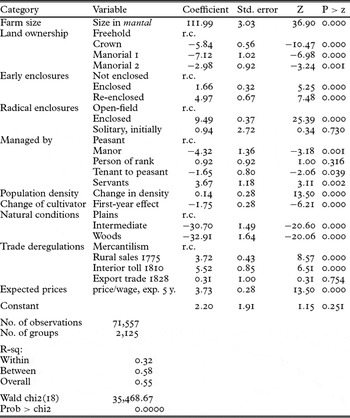
From Table 4 we can see that the overall r-square is 0.55, with a higher value of explanation between farms than within individual farms. Between farms the variables explain 58 per cent of the variation in production outcomes, but within each farm they only explain 32 per cent of the variation. This is to be expected, since a large share of the within variation was caused by weather, a short-term factor that is outside the scope of our investigation.
GLS regression of crop production in hectolitres 1702–1864, random effects

Note: r.c. denotes reference category. The period dummies are included in the regression but not shown in the table. The model is estimated using a random effects GLS estimator exploiting the panel character of the data. Standard OLS generates nearly the same results but some of the effects are somewhat stronger in the OLS regression.
According to earlier research, one important factor explaining differences is what type of land ownership the peasant faced on his farm. Insecure tenancies give bad incentives for long-range investments in farm production. Unforeseeable increases in land rents, which threaten the entire farm production growth, are likely to have the same effect (e.g. Herlitz Reference Herlitz1974; Olsson Reference Olsson2005; Svensson Reference Svensson2006). Following this, if farmers have more secure property rights, it is more likely that growth will occur.
When controlling for other factors such as farm sizes and natural conditions,Footnote 9 we find that tenants produced significantly less, as compared to freeholders. This is true for all forms of tenancies even if the effect differed among the different tenant categories (see Table 4). Starting with the differences between freeholders and tenants of the crown, the land rents, in the form of taxes, were more or less fixed for both groups from 1680 to 1900 in Sweden. Both groups also had, in practice, similar and secure farm possessions during the whole period of investigation. How can we then explain the differences in production outcomes between them? One argument is that owning a freehold farm gave better opportunities than crown tenancy for mortgages and for division and partition of the farm (Gadd Reference Gadd2000, p. 201). Those peasants who were aware of their farms’ economic potential, and were willing to use this potential for economic transactions, were to a great extent the same peasants who purchased their farms as freeholds.
In order to test for the economic benefits of the subdivision of farms, we make a simple calculation of average production output during the nineteenth century for divided and non-divided peasant holdings in our sample. This calculation reveals that output per area was almost 40 per cent higher for farms that were divided than for those that stayed non-divided. The effects were strongest in the plains, 60 per cent, but weaker in the wooded lands, where production was around 20 per cent higher on divided farms. In the early eighteenth century only around 10 per cent of all farmland was freehold, and the rate of farm subdivisions was low. Over time this changed as a majority of the crown tenants bought their farms, turning them into freeholds. Since production was higher among freeholders, this change in property rights implied a growth in agricultural output.
From the results in Table 4 it is also obvious that tenants who were, by fiscal definition, corvée peasants (Sw: insockne), and thereby more controlled by the manor (‘Manorial 1’ in the table), performed significantly worse than freeholders. In Scania most of these tenants lived in the same parish as the demesnes of the manors and paid between 300 and 400 days per year as labour rent by the mid nineteenth century. Thus, in reality, they had to hire extra servants for the boon work at the manor (Olsson Reference Olsson2006). This group experienced a substantial increase in land rent over time. They also had insecure tenancies, particularly in the nineteenth century when about every other tenant was evicted for demesne expansions in Scania. However, in some cases landed estates were put on the market for purchase by peasants, turning tenants into owner-occupiers. In these cases we identify a major increase in production on average. The effects of ownership differences are quite large, amounting on average to over seven hectolitres less in production (around 12 per cent lower production) as a tenant under the strict control of the manor as compared to being a freeholder. For tenants living outside the landowners’ demesnes, i.e. Manorial 2 in Table 4, development was more heterogeneous in terms of security of tenancy and forms and amount of land rent, a fact that can explain their relatively better economic performance. These farms were often situated in villages where the majority of the farms were freehold or crown farms and were thus to a large extent sharing the same context. For these farmers, buying their farms and turning them into freeholds resulted in only a small increase in production.
Another factor, widely discussed not only in Sweden but also in the rest of Europe, is the potential impact of enclosures on agricultural growth (e.g. Allen Reference Allen1992; Clark Reference Clark1998; Fridlizius Reference Fridlizius1979; Heckscher Reference Heckscher1949; McCloskey Reference McCloskey, Parker and Jones1975; Overton Reference Overton1996; Svensson Reference Svensson2006). In relation to these earlier estimations of the effect of enclosures, our panel data approach allows us to estimate the effects both within farms that were enclosed and between farms, where some were enclosed and others not, controlling for other characteristics.Footnote 10
In Sweden, two main types of reallocations of land took place during the agricultural transformation. The eighteenth-century enclosures most often did not imply a break with the open-field system, but were merely rearrangements of holdings for the purpose of reducing the number of strips. These enclosures, as well as those arising as a result of later enclosure Acts, depended upon an application from one of the landowners in the village. Only if an application was put forward would the village be enclosed. On the other hand, if one landowner applied for enclosure, the rest of the village had to participate regardless of whether they desired an enclosure or not (see Svensson Reference Svensson2006). For us, this means that not all villages were enclosed during the period studied, and for those that were enclosed the timing of enclosure differed substantially. The early enclosures in Scania had a small positive effect on production, as can be seen in Table 4. A second rearrangement according to these enclosure Acts made production increase even further. One potential explanation for the positive effect is that each peasant had fewer strips to manage and therefore spent less time moving to different locations. Another, perhaps more important factor, is that investments in drainage often took place in conjunction with the enclosures, which improved the soil.
However, a much larger effect on production came with the more radical enclosures starting in 1803. These enclosures implied a break with the open-field system, introducing individual management of land on unified holdings. An enclosed farm, controlled for farm size, natural conditions, period and ownership, produced on average almost 10 hectolitres more than an unenclosed farm producing within the open-field system (around 17 per cent higher production). There were several potential reasons for this result.Footnote 11 First, after the enclosures, the farmer could adapt crops to specific soil conditions and individually decide the time for seed and harvest. In Scania, for example, a more elaborated crop rotation including fodder crops was not adopted until after the break-up of the village organization. Second, as the radical enclosures implied that the village was dissolved and farmers moved out to the more remote parts of the village land, this included the conversion of previously non-cultivated land to arable land. Third, creating unified holdings made it easier to divide them among the children or to sell parts of the land to non-kin. As we have seen above, division or partition of farms increased the output per area unit. In conclusion, the overall effect of enclosures was a significant growth in crop production.
Solitary farms that had not been part of the open-field system, mainly because of their remote and isolated geographical position, showed no significant difference from farms within the open-field system, despite having their land in one unit. This could indicate two things: first, it was the timing of the enclosure that mattered. Breaking up the village system in a period of increasing commercialization had an effect on production, while being outside this system made no distinct difference. Second, these solitary farms might have had some special characteristics affecting their production, such as their remoteness, which is not controlled for in the regression.
A contemporary notion was that peasants were conservative towards change and that progress was due above all to enlightened landlords and persons of rank spreading their ideas to the peasants, the latter accepting them either voluntarily or by force. This notion has been put forward among Swedish and other researchers (e.g. Heckscher Reference Heckscher1949; Thompson Reference Thompson1971; Brenner Reference Brenner, Hoppenbrouwers and van Zanden2001; Henningsen Reference Henningsen2001; for a thorough discussion, see Svensson Reference Svensson2006). From the tithe rolls and tax material we can follow who actually managed the farms and, thus, separate peasants from other social groups. If this contemporary notion is accurate we would expect to find higher production among persons of rank as compared to peasants. We know that, on average, persons of rank managed somewhat larger farms than peasants did, but when controlling for this by measuring the extra impact of being a person of rank as compared to peasants facing the same conditions, our results show that farms managed by persons of rank display no significant difference from farms under peasant management. Although the number of observations for the former is low, less than 2 per cent of the sample (i.e. 859 observations of production outcome), we can state that there is no indication that persons of rank and other gentry performed significantly better than the peasants. Since we do not study production on the manors, and thus not the manorial lords, we cannot address the full extent of this discussion. However, as we have seen, the more closely connected the peasants were to the manors, the worse was their economic performance. Furthermore, farms managed directly by a manorial estate performed significantly worse than farms managed by peasants.
Management effects differ for other types of farm. Sometimes the owning peasants for some reason could not manage the farm themselves, but had to lease it to another peasant or someone else in the village. This could be the case during periods of widowhood or when heirs were underaged or if the farm manager was struck down by disease. These leaseholders did not differ significantly in their production capacity from farms run by the owners themselves. However, farms managed solely by servants, without the manager present, performed significantly better (around 7 per cent better). These farms were owned either by wealthy peasants or persons of rank and they reflect the emerging land market in the early nineteenth century, where entrepreneurial farmers bought more than one farm to increase their production capacity (cf. Svensson Reference Svensson2006). Although they were few in number, we can assume that this category was the most commercialized type of farmstead within the peasant community.
Finally, let us look at the commercial opportunities: deregulations of markets and grain prices. One important factor explaining the increase in production was an increasing demand for grain. Demand during the eighteenth century came from interior trade with deficit areas of Sweden as well as through the population growth and social differentiation which followed the initial rise in production (see Olsson and Svensson Reference Olsson, Svensson and Pinilla2009 for a more detailed discussion). From an initial mercantilist position, Sweden was liberalized during our period of investigation. With the lifting of the prohibition on rural trading in 1775 and the abolition of the interior toll in 1810 and export regulations in 1828, new channels for Scanian grain were opened. Trade deregulations show significant positive effects on grain production, particularly the lifting of the interior toll, an action which also had an immediate effect on consumers’ grain prices. However, the abolition of export regulations shows no additional effect, inasmuch as this deregulation is not expected to have had any immediate effect on peasants’ sales opportunities.Footnote 12
Price incentives are measured with a regional index of rye prices divided by an index of rural day labourers’ wages.Footnote 13 We assume that peasants’ economic behaviour was not dependent only upon price changes from one year to another, so we use a Nerlove model to calculate expected prices (Askari and Cunnings Reference Askari and Cummings1977; Schäfer Reference Schäfer, Bhaduri and Skarstein1997, pp. 110–11). Our model is:

Here Pet is the expected price for an actual year, built on the preceding five years’ prices, weighted higher the closer in time they get. Our results indicate that peasants did react to price incentives: with higher real prices of grain, production increased. The figure can be interpreted thus: if the expected real prices of grain doubled, an average peasant increased grain output by 3.6 hectolitres, which means a 7 per cent higher production.
6. Conclusion
To summarize our findings, Scania, the granary of Sweden, displayed a large increase in agricultural production from the eighteenth century to the middle of the nineteenth century. In effect, production more than quadrupled, with the largest growth taking place after 1780. In this latter period production outperformed population growth substantially, with a per capita growth of between 0.5 and 0.6 per cent per annum, while production and population grew at the same pace during the period 1700–80. In a European perspective, excluding England and the Netherlands, this implies that Sweden did fairly well in the eighteenth century, when many European countries experienced falling labour productivity in agriculture (Allen Reference Allen2000, p. 21). Although a general growth seems to have taken place in European agriculture during the first half of the nineteenth century, our results put Swedish per capita growth among the best in Europe during this period. The growth in Scania consisted above all of increasing crop production: the staple crops, rye and barley, as well as other seeds such as oats, wheat, beans, peas and buckwheat, and the emerging production of potatoes. The crop share of the total value of production increased over time, due partly to an expanded crop production and partly to animal production decreasing over time.
Though there was a general increase in Scanian agricultural production, the increase was not uniform across all types of farms. Differences in production were of course attributable to differences in farm size and natural conditions. Large farms produced more than small farms and farms on the plains produced more than farms situated in more forested areas of the region. However, it is when we control for these factors that we reveal the most interesting differences in production achievements. First, property rights mattered: freeholders produced more per area unit than tenants on crown and noble land. Secure property rights among self-owners, together with rising prices and fixed taxes, promoted investments in crop production. For those peasants that were tenants under the nobility, rising rents and the threat of eviction prevented such immense investments. Thus, with a continuing process of tenants buying their land during the eighteenth and nineteenth centuries, i.e. becoming freeholders with more secure property rights, growth was promoted.
Furthermore, the growth in agricultural production was not a linear phenomenon; there were phases of growth and stagnation. Growth came about after periods of reallocation of land and subsequent investments. A pronounced growth phase started with the intensification within the old village system. However, this was not a viable solution over the long term. With the introduction of the radical enclosures, containing among other things the break-up of the village system and the introduction of new crop rotations, growth increased even faster. At the same time, liberalization of trade contributed to growth, and the peasants reacted to price incentives by increasing grain production.
In all, the unique Swedish data allow us to draw some more general conclusions on the development within pre-industrial agriculture. Moving from a low-productive agriculture to a fast-growing more productive agriculture was as possible in an economy dominated by peasants as in one where persons of rank dominated. Our estimates reveal that changes in property rights, institutional changes breaking with the traditional organization of production and growing markets for agricultural products made peasants increase production and productivity. In this way agriculture could make a dynamic impact on the overall economic development. In the case of the Swedish peasant economy, production increased to turn imports of grain into exports, commercialization spread among large layers of the population and so did income. Deepened property rights were established and successive investments in human capital followed. Together, these provided the prerequisites and the framework for the subsequent industrialization process.
Acknowledgements
This is a study within the project ‘Economic Development and Social Dynamics. Swedish Agricultural Transformation in European Perspective’ financed by the Swedish Research Council (Vetenskapsrådet). We are grateful to the editors and referees of this journal, and to John Abbott, Bruce M. S. Campbell, Carl-Johan Gadd and Mats Morell for comments on earlier text drafts.
Appendix
Production estimates 1702–1864, hectolitres per farm and additional percentage value of animal gross output

Source: Historical Database of Scanian Agriculture.
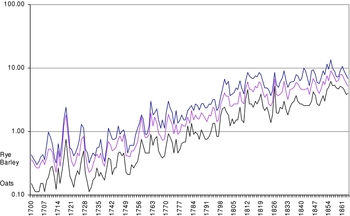
Grain prices 1700–1864 (kronor per hectolitre), logarithm scaling
Sources: Jörberg Reference Jörberg1972; Bengtsson and Dribe Reference Bengtsson and Dribe1997.