Implications
Consumers expect that laying hens housed in free-range systems have better welfare compared with hens housed indoors, due to their having access to an outdoor range area. However, there is very little understanding of the welfare implications of ranging, especially at the individual level given the large inter-individual variation in ranging behaviour. These findings contribute to the growing body of work that focuses on individual hens, progressing our understanding of the relationships between use of the outdoor range and laying hen welfare. This work can inform policy development and management of commercial free-range layer farms.
Introduction
Consumers purchase free-range eggs, where laying hens have regular access to an outdoor range, believing that hens in free-range housing systems are ‘happier and healthier’, raised in a more ‘natural production system’ (Pettersson et al., Reference Pettersson, Weeks, Wilson and Nicol2016), and that ‘hen welfare is better’ compared with indoor production systems (Bennett et al., Reference Bennett, Jones, Nicol, Tranter and Weeks2016).
Laying hen welfare in free-range systems has traditionally been assessed through comparisons between production systems (Appleby and Hughes, Reference Appleby, Smith and Hughes1991; Sherwin et al., Reference Sherwin, Richards and Nicol2010; Lay et al., Reference Lay, Fulton, Hester, Karcher, Kjaer, Mench, Mullens, Newberry, Nicol, O’Sullivan and Porter2011), or according to various management practices (Appleby et al., Reference Appleby and Hughes1993; Zimmerman et al., Reference Zimmerman, Lindberg, Pope, Glen, Bolhuis and Nicol2006). Within free-range systems, however, only a small proportion of the flock (<50%) is seen on the outdoor range at any one time (Hirt et al., Reference Hirt, Hördegen and Zeltner2000; Hegelund et al., Reference Hegelund, Sørensen, Kjaer and Kristensen2005; Zeltner and Hirt, Reference Zeltner and Hirt2008; Rault et al., Reference Rault, van de Wouw and Hemsworth2013; Rodriguez-Aurrekoetxea and Estevez, Reference Rodriguez-Aurrekoetxea and Estevez2016). Furthermore, the majority of the flock remains within the vicinity of the shed (Chielo et al., Reference Chielo, Pike and Cooper2016). However, the overall behaviour of the group may not necessarily reflect the behaviour of individual group members.
There are associations between individual ranging behaviour and individual welfare states. For example, hens with a larger home range have better footpad and feather condition than those with a smaller range (Rodriguez-Aurrekoetxea and Estevez, Reference Rodriguez-Aurrekoetxea and Estevez2016), and hens ranging farthest from the shed (>50 m) have better plumage condition than those sampled in areas closer to the shed (Chielo et al., Reference Chielo, Pike and Cooper2016). However, body condition may influence ranging behaviour rather than being affected by it.
Traditional counting or visual observation methods for monitoring individual hens may underestimate range use, as these methods are unable to determine range use over a cumulative period of time. New individual tracking methods allow continuous monitoring of hens’ movements in and out of the shed, as well as sometimes location on the range (Siegford et al., Reference Siegford, Berezowski, Biswas, Daigle, Gebhardt-Henrich, Hernandez, Thurner and Toscano2016). Recent studies using radio frequency identification technology (RFID) tracking systems have confirmed that individual hens within a flock vary in their range use (Gebhardt-Henrich et al., Reference Gebhardt-Henrich, Toscano and Frohlich2014b; Campbell et al., Reference Campbell, Hinch, Downing and Lee2016; Hartcher et al., Reference Hartcher, Hickey, Hemsworth, Cronin, Wilkinson and Singh2016), and that more hens (70% to 80%) utilise the range on a regular basis than when estimated with traditional visual observation methods (Gebhardt-Henrich et al., Reference Gebhardt-Henrich, Fröhlich, Burose, Fleurent, Gantner and Zähner2014a; Campbell et al., Reference Campbell, Hinch, Downing and Lee2016; Hartcher et al., Reference Hartcher, Hickey, Hemsworth, Cronin, Wilkinson and Singh2016; Larsen et al., Reference Larsen, Cronin, Gebhardt-Henrich, Smith, Hemsworth and Rault2017). Furthermore, individual hens vary in how consistently they access the range, and how far they range from the shed (Larsen et al., Reference Larsen, Cronin, Gebhardt-Henrich, Smith, Hemsworth and Rault2017).
In the present paper, we examined the relationships between individual range use, as measured by RFID technology and reported in a previous study (Larsen et al., Reference Larsen, Cronin, Gebhardt-Henrich, Smith, Hemsworth and Rault2017), and behavioural, physiological and health measures of laying hen welfare. Based on the variation in ranging behaviour observed in the previous study, we hypothesised that hens that access the range more (based on frequency, duration and distance) and more consistently, would be less fearful, have better health, and have lower physiological stress response than hens that use the range less.
Material and methods
Animals and husbandry
Two commercial free-range flocks on one farm in South-Eastern Australia were studied. Each flock (referred to as flocks A and B from here on) of ~18 000 Hy-Line Brown laying hens, had ad libitum access to feed and water inside the shed, and access to an outdoor range from ~1000 to 1800 h. At the start of the study, flock A was 41 weeks of age and flock B was 63 weeks of age. All hens had infra-red laser beak treatment at 1 day old. The indoor stocking density in both sheds was ~12.1 hens per square metre, and the outdoor stocking density was 10 000 hens per hectare which is the legal maximum stocking density in Australia. For further details on flock characteristics, shed and range design, and RFID tracking, see Supplementary Material Figure S1, and Larsen et al. (Reference Larsen, Cronin, Gebhardt-Henrich, Smith, Hemsworth and Rault2017).
Fear assessments
During welfare assessment, hens were confined to the indoor shed and veranda area to assist with catching and to ensure hen selection was not biased to those that stayed close to the shed. To reduce the amount of time hens were subjected to handling, assessments were done over two points in time: before tracking range use, and after tracking range use. At each time, 150 hens were randomly selected and caught with a hand held net. Hens were then transported (held in the hand or under the arm) to one of four testing arenas located in front of the shed. The mean time taken to catch and transfer hens to the arenas was 136.9±6.6 s. The testing arenas were 3×3 m canvas top gazebos that had been enclosed using plywood panelling to reduce visual and auditory disturbances from outside. The floors of the testing arena were packed earth, most similar to the close range area, and the walls had been marked to identify 1×1 m grid squares.
During the first capture, each hen’s general fearfulness was tested using a tonic immobility (TI) test. A table with a U-shaped cradle was located in each testing arena. At the start of the test, hens were brought into the arena and inverted on their backs in the cradle. Hens were restrained for 15 s with gentle contact over their head and torso. Hens were then released and the person slowly retreated to a distance >1 m from the hen, looking towards the ground. During the following 15 s, if the hen righted herself, TI was not considered to be induced and the hen was inverted again and the previous steps were repeated. A maximum of five attempts to induce TI was given. If TI was induced, the latency for hens to right themselves was recorded. If hens remained in a state of TI for five minutes, the hens were ‘woken’. All hens were then tagged with the RFID leg bands and returned to the flock. Additional hens (291 for flock A, and 300 for flock B) were tagged at this time point also to record ranging behaviour (see Larsen et al., Reference Larsen, Cronin, Gebhardt-Henrich, Smith, Hemsworth and Rault2017).
At the second capture, hens were subjected to a series of behavioural tests to assess general and specific fearfulness. Video cameras were placed in the testing arenas and hen’s behaviour was scored from video recordings post hoc by a single observer. The first test was the open field (OF) test. Hens were taken from the shed, placed into the centre of the arena and left in isolation for 4 min (OF test). After the OF test, hens were subjected to a novel object (NO) test, where an orange traffic cone was placed to one side of the arena. Hens were left in isolation with the novel object for a period of 2 min. After the NO test, the traffic cone was removed and the human avoidance (HAV) test followed by the human approach (HAP) test were performed. During the HAV test, the person entered the arena and slowly walked to the corner of the arena furthest from where the hen currently stood, after which the person stood silently with eyes facing downward for 1 min. Once the HAV test was complete, the person either moved again to the furthest corner from the hen (if the hen had moved) or stayed in the original location and looking directly at the hen, slowly approaching at a pace of 0.25 m/s until the hen moved.
For the OF, NO and HAP tests, the latency to move and number of 1×1 m grid lines crossed (to assess mobility) were recorded. A transparent sheet indicating the grid lines, based on the wall markings in each arena, was used for video analysis by overlaying it on the computer monitor. Crossing a grid line was defined as having at least one foot over the line. Minimum, average and maximum distance from the object/person and direction of movement (towards or away) in the NO and HAP tests were recorded using still shots of video playback every 15 s throughout each test and Fiji software (Schindelin et al., Reference Schindelin, Arganda-Carreras, Frise, Kaynig, Longair, Pietzsch, Preibisch, Rueden, Saalfeld and Schmid2012) to obtain distance measurements. Direction of movement was determined by the difference between the distance hens were from object/person at the start of the test, and the minimum distance recorded for the remainder of the test. For the HAP test, the distance at which the hen moved away from the person (flight distance) was recorded using still shots of video and Fiji software.
Health assessment
Health assessment was scored by two trained assessors after the second testing time only. Live weight, plumage condition score, footpad condition and keel bone deformation (all according to Welfare Quality, 2009; Table 1), beak condition (modified from Welfare Quality, 2009; Table 1), and comb colour according to a seven-point scale from pale to red were recorded (Leeb et al., Reference Leeb, Main, Whay and Webster2005).
Description of physical fitness scores as derived from Welfare Quality (2009)

Physiological assessment
After behavioural tests conducted on the second testing time, if the hen had voided in the testing arena, this sample was collected for analysis of faecal glucocorticoid metabolites, reflecting the cumulative secretion and elimination of hormones over ~4 h (Dehnhard et al., Reference Dehnhard, Schreer, Krone, Jewgenow, Krause and Grossmann2003), and thus used as a physiological measure of basal stress. The proportion of hens that voided in tests was also recorded to analyse it in relation to plasma corticosterone, indirectly testing for the influence of the likelihood of defecation on the observed faecal glucocorticoid metabolites’ concentrations. All faecal samples were extracted and assayed using a previously validated protocol (Gole et al., Reference Gole, Woodhouse, Caraguel, Moyle, Rault, Sexton and Chousalkar2017), using an RIA kit (ImmuChemTM Double Antibody corticosterone 125I RIA Kit; MP Biomedicals LLC, Orangeburg, NY, USA), following the manufacturer’s manual and using a 1 : 100 dilution.
After the health assessment (within 10 to 15 min after initial capture), a blood sample was collected from the brachial wing vein and spun at 1500×g for 15 min. The plasma fraction was transferred to a 1 ml Eppendorf tube and subsequently stored at −20°C. Samples were analysed for plasma corticosterone using the same RIA kit as for faecal glucocorticoid metabolites but using a 1 : 50 dilution. This measurement was expected to reflect the acute corticosterone response to handling and testing associated with the fear and health assessments.
Statistical analysis
Individual hen was the unit of measurement for analysis. For hens tested during the second time point, ranging variables (Table 2) and welfare assessment variables (Table 3) were each subjected to a principle component analysis (PCA), using criteria outlined by Pallant (Reference Pallant2013). Component scores were calculated for each component as the sum of the standardised item scores multiplied by their corresponding component coefficient for that component.
Summary of combined and separate ranging variables for hens tested during second capture in both flocks; proportion of available days that hens accessed the range, average time (hours) hens spent outside and frequency (count) of visits per available day and individual coefficient of variation for both duration and frequency

The number of hens is indicated in parenthesis for each variable.
1 Does not include hens that never accessed the range.
Mean and standard deviations of continuous variables for both flocks

Presented as both combined, and separated for each flock. The number of hens is indicated in parenthesis for each variable.
As hens were randomly selected at each time point, the majority of hens tested only underwent one set of behavioural testing and thus statistical analysis of welfare and ranging variables were performed separately for each group. Hens were excluded from analysis if compromised leg bands resulted in no ranging data, if there were disturbances during behavioural tests, and from physiological tests if blood or faecal samples were not correctly collected or assayed. The number of hens (out of 300 caught and tested) for each variable used for analysis are presented in Tables 2 and 3 and Figure 1.
Combined and separated frequency, expressed as percentage, of health scores and direction of movement scores in the novel object (NO) and human approach (HAP) behavioural tests for hens in both flocks. Comb colour score: 1=pale to pink, 2=red. Beak condition score: 1=light trim, 2=moderate trim, 3=severe trim with abnormalities. Plumage condition score: 1=no to moderate wear, 2=severe wear. Footpad condition score: 1=foot intact to necrosis without swelling, 2=swollen foot. Keel bone score: 1=no deviation or deformation, 2=deviation or deformation. Direction of movement scores: 0=moved away from object/person, 1=moved towards object/person. The number of hens is presented at the top of each stacked bar.

Statistical data analysis was performed using SPSS statistical softwareTM (v22; IBM Corp, Armonk, NY, USA). All data were tested for normality before analysis. Health scores were condensed from the original scoring system to even the distribution of the categorical data: plumage condition scores 0 and 1 were combined, footpad condition scores 1 and 2 were combined, and comb colour scores 1 to 5 were combined to create score 1 ‘pale-pink’ and scores 6 and 7 were combined to create score 2 ‘red’ (Figure 1). The single component identified in the PCA on the ranging variables (labelled ‘Ranging score’) had a non-normal distribution, even after transformation, and was thus examined using non-parametric tests.
The relationships between Ranging score and the 4-component scores identified in the PCA on the welfare variables were examined using Spearman’s ρ correlation. Relationships between the welfare component scores and distance (as measured by outdoor zone access) were explored using GLMs with fixed factors of outdoor zone, flock, testing arena, and time of day (hour). Where multiple comparisons were conducted, P-values were corrected using Bonferroni. The relationship between Ranging score and direction of movement in behavioural tests and health scores (plumage, footpad, keel bone, beak and comb colour scores) were examined using Mann–Whitney U-tests, except for beak condition where a Kruskal–Wallis test was used. The relationship between distance and health scores were examined using χ 2 test for independence, combining hens that never accessed the range and hens that only accessed the veranda area because a few hens never accessed the range (12.1% and 0.03% for flocks A and B, respectively).
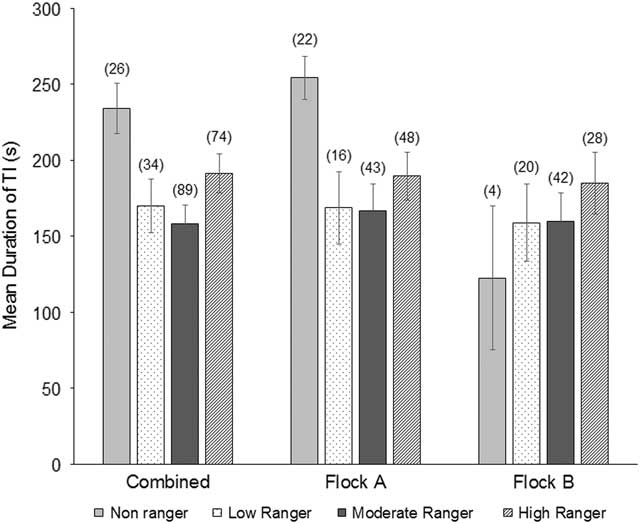
Tonic immobility data were censored (maximum of 300 s), thus the effects of ranging, arena, number of induction attempts and flock on tonic immobility duration were analysed using Cox regression analysis. This analysis did not allow input of the continuous Ranging scores, thus range use categories were determined based on the average duration hens in the sample population spent in the outdoor range. These categories were used as a fixed factor in the regression model. Groups were defined by the average±0.5 SD, where hens that never accessed the range were non-rangers (NR), hens that accessed the range, but less than the average – 0.5 SD were considered low rangers (LR); between the average ±0.5 SD were considered moderate rangers (MR); more than the average +0.5 SD were high rangers. Because there were so a few NR hens in flock B, survival analysis was performed on the combined data set for both flocks and on each individual flock data set. In addition to range use category, the Cox regression models included the number of induction attempts, testing arena (also accounting for handler), time of day (hour), and flock (where applicable) as fixed factors, and two-way interactions between these and range use category.
Results
Summary of ranging variables
A full description of the ranging behaviour of hens in these two flocks is described in Larsen et al. (Reference Larsen, Cronin, Gebhardt-Henrich, Smith, Hemsworth and Rault2017). Briefly, of the 291 randomly selected hens used for behavioural, physiological, and health assessment, 7.9% (23 hens) never accessed the range. On average, hens accessed the range on 85% of the available days, and spent 2.8±1.6 h per day on the range, spread across 10.4±6.7 visits per day (Table 2). Most hens (78.7%) accessed the far range zone (>11.4 m) at least once during the trial, whereas 2.1% and 11.3% of hens only accessed as far as the veranda (0 to 2.4 m) or close range (2.4 to 11.4 m), respectively.
Hens that were tested for tonic immobility in the first capture (n=223) did not differ in ranging behaviour from the hens tested in the second capture (Table 2; one-way ANOVA, P>0.05).
Results of the principle component analyses
A PCA for the ranging variables extracted a single component with an eigenvalue above 1, explaining 80.1% of the variance, and labelled ‘Ranging score’. No rotation could be performed on the single component. Structure coefficients for this component were: proportion of days range accessed=0.96, CV for ranging duration=−0.94, CV for ranging frequency=−0.93, average ranging duration=0.85, and average ranging frequency=0.78. This component reflected the hens’ ranging behaviour, with high scores indicating greater duration and frequency of range access and lower variation of daily range access (i.e. more consistently).
For the welfare assessment variables (Table 3), a PCA with Oblimin rotation revealed four components for further analysis (Table 4). The first component loaded strongly with HAP average, minimum and maximum distance. High score for this component indicates increased avoidance of the human, and was labelled ‘Human avoidance score’. The second component loaded strongly with NO average, minimum and maximum distance. High score for this component indicates increased avoidance of the novel object, and was labelled ‘Object avoidance score’. The third component loaded strongly for NO, OF and HAP latency in a positive direction, and loaded strongly for HAP, NO and OF lines crossed in a negative direction. High score for this component indicates a greater latency to move and less mobility during behavioural tests, and was labelled ‘Immobility score’. The fourth component, loaded strongly with plasma and faecal glucocorticoid metabolite concentrations and the distance at which hens moved away from an approaching human during HAV. Higher values in the component represent hens that have a higher physiological stress response (both acute and basal), as well as a greater flight distance, and was labelled ‘Stress and flightiness score’.
Pattern and structure matrix for welfare variable principle component analysis (PCA) with Oblimin rotation of four-factor solution

HAP=human approach; NO=novel object; OF=open field; HAV=human avoidance.
Coefficient <0.3 are not presented. C1 to C4 are the four components. Total variance explained by the four component PCA is 63.2%; variance explained by individual components (and the component label) is indicated below the table.
C1, ‘Human avoidance score’ – 26.0%, C2, ‘Object avoidance score’ – 18.0%, C3, ‘Immobility score’ – 10.9%, and C4, ‘Stress and flightiness score’ – 8.3%.
Relationship between Ranging score, outdoor zone access and the four welfare scores
Of the four welfare variable PCA components, there was only a weak positive correlation between Stress and flightiness score with Ranging score (Spearman’s ρ=0.23, P=0.02).
There was no relationship between the outdoor zones hens accessed and the four welfare scores (GLMs, P>0.10).
Hens that did not void during behavioural tests (i.e. no basal corticosterone measurement available) had significantly lower acute plasma corticosterone levels (7.0±0.41 ng/ml) than hens that voided during behavioural tests (9.7±0.3 ng/ml; one-way ANOVA F 1,288=20.0, P<0.001).
Relationship between Ranging score and individual welfare variables
Hens that moved towards the novel object in the NO test had a higher Range score (Median=0.36, n=154) than hens that moved away from the novel object (Median=0.10, n=61; Mann–Whitney U=3778, Z=−2.24, P=0.03, R=0.15). There was no relationship between Range score and direction of movement in the HAP test.
There was no significant relationship between Range score and the health scores: comb colour, beak condition, plumage condition, footpad condition or keel bone condition (non-parametric Mann–Whitney U-tests, all P>0.05, and Kruskal–Wallis tests, all P>0.10).
Relationship between outdoor zone access and health scores
The number of outdoor zones hens accessed was significantly associated with comb colour score (χ 2 test (2, n=282)=34.6, P<0.001, Cramer’s V=0.35). Of the hens with pale to pink (score 1) coloured combs, 21.6% never accessed the range, 33.3% accessed the close range, and 65.9% accessed all three outdoor areas. Whereas of hens with red combs (score 2), only 1.5% never accessed the range, 11.3% accessed just the close range, and 87.1% accessed all three outdoor range areas. Thus, hens with pale combs are 14 times more likely to never go outside than hens with red combs.
The number of outdoor zones hens accessed was also significantly associated with beak condition (χ 2 test (4, n=282)=9.44, P=0.05, Cramer’s V=0.13), with more hens that had severe trims or beak abnormalities (score 3) never entering the close or far range areas (12.8%), compared with the hens with moderate (10.8%) to light (2.7%) trimming. There were no other associations between outdoor zone access and health scores.
Relationship between tonic immobility duration and range use category
The likelihood of righting during the tonic immobility test did not differ according to range use category (non-ranger, low ranger, moderate ranger, and high ranger), number of attempts to induce, flock, testing arena or the interactions between range use category and these factors/effects (Cox Regression survival function, all P>0.10; Figure 2). However, when data for both flocks were analysed separately, because a few hens did not range in flock B, hens in flock A in the non-ranger group were less likely to right during the tonic immobility than the low-ranger group (hazard ratio=3.7, χ 2=8.7, P=0.003), and moderate-ranger group (hazard ratio=2.6, χ 2=6.3, P=0.01), but did not differ significantly from the high-ranger group (Figure 3). There were no significant differences in the likelihood of righting during TI between low, moderate and high ranger groups in flock A. There was no significant difference in the likelihood of righting during TI between different ranger groups in flock B.
Mean tonic immobility durations (s±SE) for hens in both flocks (combined), and flocks A and B separately. The numbers of hens in each group are represented in parentheses. Range use category is determined by the average duration hens in the sample population spent in the outdoor range. Groups were defined by the average±0.5 SD, where hens that never accessed the range were non-rangers, hens that accessed the range, but less than the average–0.5 SD were considered low rangers; between the average±0.5 SD were considered moderate rangers; more than the average+0.5 SD were high rangers.

Survival function graph for tonic immobility duration (censored at 300 s) of hens in flock A. Range use category is determined by the average duration hens in the sample population spent in the outdoor range. Range use category is determined by the average duration hens in the sample population spent in the outdoor range. Groups were defined by the average±0.5 SD, where hens that never accessed the range were non-rangers (NR), hens that accessed the range, but less than the average–0.5 SD were considered low rangers (LR); between the average±0.5 SD were considered moderate rangers (MR); more than the average+0.5 SD were high rangers (HR).

Discussion
Overall there were only a few associations found between outdoor range use and the recorded measures of laying hen welfare, and these associations were relatively weak.
Laying hens that used the range more frequently, for longer and more consistently had a greater corticosterone response to handling and testing, higher basal corticosterone concentrations and greater flight distance from humans. This finding suggests that hens that range more are more fearful of humans, based on their behaviour and stress responses, and have higher basal stress levels. In a similar study but with small groups and in an experimental setting, Campbell et al. (Reference Campbell, Hinch, Downing and Lee2016) found no association between individual range use and plasma corticosterone response to handling and restraint. While high fear of humans may encourage ranging because of human activity in the indoor environment, these two studies were conducted under very different conditions. For example, in the experimental setting of Campbell et al. (Reference Campbell, Hinch, Downing and Lee2016), birds may have had markedly different contact with humans (both nature and amount) than those in the commercial setting of the present study. Hens that did not void during the behavioural tests (i.e. no basal corticosterone data due to opportunistic sampling) had a lower acute stress response to testing than those hens that did. Care is required in interpreting the basal corticosterone data as the most fearful hens in these tests may have been more likely to void and time of sampling may confound basal concentrations as glucocorticoids in poultry are synthesised in a diurnal pattern (Wilson et al., Reference Wilson, Jennings and Cunningham1984). However, the basal and acute corticosterone responses in our study both loaded strongly on the same PCA component (stress and flightiness score), suggesting an underlying commonality in these two measurements, that is, those birds that had a higher acute stress response to testing also had higher basal corticosterone concentrations. The results also show that laying hens that ranged more were more likely to approach a novel object. Although this relationship was weak, it could be interpreted as lower neophobia in the hens that ranged more in the complex and less predictable outdoor environment than the indoor environment.
In one of the two study flocks, non-ranger hens were more likely to remain in tonic immobility longer than low- and moderate-ranger hens, but not high-ranger hens. Tonic immobility has been used previously to assess laying hen welfare in relation to range use (Mahboub et al., Reference Mahboub, Müller and Von Borell2004; Campbell et al., Reference Campbell, Hinch, Downing and Lee2016; Hartcher et al., Reference Hartcher, Hickey, Hemsworth, Cronin, Wilkinson and Singh2016), but with inconsistent results. Mahboub et al. (Reference Mahboub, Müller and Von Borell2004) and Campbell et al. (Reference Campbell, Hinch, Downing and Lee2016) found no association between ranging and TI duration. In contrast, Hartcher et al. (Reference Hartcher, Hickey, Hemsworth, Cronin, Wilkinson and Singh2016) found that the bottom and top 15% of range users, which correspond to the low- and high-ranger hens in our study, differed with the low-ranger hens displaying a longer latency to righting in the TI test. There is no obvious explanation for these inconsistent findings but again the differing environmental settings and previous experience of the hens in these studies may be implicated. The results on fear measures derived from TI, corticosterone values, and the behaviour tests in this study were also inconsistent, showing rangers to be more fearful of humans but less fearful of a novel object.
Both comb colour and beak condition were associated with ranging behaviour. Hens with darker red combs and those with good beak condition ranged further from the shed. Lighter combs have been associated with increased fearfulness (Bestman and Wagenaar, Reference Bestman and Wagenaar2014), higher incidence of fatty liver haemorrhagic syndrome (Grimes et al., Reference Grimes, Maurice, Lightsey and Bridges1991), and poorer body and plumage condition (Whay et al., Reference Whay, Main, Green, Heaven, Howell, Morgan, Pearson and Webster2007), but free-range hens with darker red combs also tended to have higher intestinal parasite infection (Bestman and Wagenaar, Reference Bestman and Wagenaar2014). Darker comb colour has been suggested to relate to range use based on estimated ranging behaviour at a flock level (Whay et al., Reference Whay, Main, Green, Heaven, Howell, Morgan, Pearson and Webster2007; Bestman and Wagenaar, Reference Bestman and Wagenaar2014), but there is no evidence of the causal relationship between comb colour, ranging, and other potential health factors. As beak condition often results from the husbandry practice of beak trimming, and only changes as a result of disease, abnormal growth, or breakages, it is likely that beak condition is a moderating factor rather than a consequence of range use. Hens spend the majority of their time in the outdoor range foraging (Chielo et al., Reference Chielo, Pike and Cooper2016; Thuy Diep et al., Reference Thuy Diep, Larsen and Rault2017), and if this behaviour is inhibited by poor beak condition, hens may be less likely to use the outdoor range due to painful or ineffective foraging behaviour. This has implications for managing flock health, as increased ground pecking correlates with a reduction of feather pecking (Nicol et al., Reference Nicol, Lindberg, Phillips, Pope, Wilkins and Green2001), a serious welfare concern.
While some weak relationships were found between ranging and hen welfare based on behavioural, physiological and health measures, the extent of ranging was not markedly or consistently associated with hen welfare. Perhaps this is not surprising as there are likely to be many factors contributing to the welfare of free-range laying hens in an established group, such as individual differences in experience, stress resilience and social status. Furthermore, hens may self-regulate their welfare needs by altering their range access. There is evidence that hens reduce their overall food intake when able to selectively eat protein or calcium-rich diets based on their own needs (Leeson and Summers, Reference Leeson and Summers1978), and meat chickens can self-medicate by consuming food with analgesics when in pain (Danbury et al., Reference Danbury, Weeks, Chambers, Waterman-Pearson and Kestin2000). Giving animals a choice is an important factor in determining how animals cope within their environments (Nicol et al., Reference Nicol, Caplen, Edgar, Richards and Browne2011). Free-range systems may provide adequate choice for laying hens, so that there is little variation in welfare of hens even though they show differences in ranging behaviour.
This study was conducted on only two flocks on the same commercial farm. Ranging behaviour, and its relationships with hen welfare, may vary on other farms. Within this study the two flocks differed somewhat in ranging behaviour, in particular so few hens never accessed the range in flock B. This difference might be related to age, past experience, social structure, or other factors, as discussed in Larsen et al., Reference Larsen, Cronin, Gebhardt-Henrich, Smith, Hemsworth and Rault2017. The welfare of an individual animal may also vary over time and may depend on the context (Nicol et al., Reference Nicol, Caplen, Edgar, Richards and Browne2011). The current study only examined the hens’ ranging over 2 weeks. Longitudinal studies are required to assess the welfare implications of accessing the range across the laying cycle, which may also help establish the causal relationship between range use and indicators of hen welfare. Furthermore, there is a need to study complimentary assessments of animal welfare, such as the welfare implications derived from the ability to perform more natural behaviours provided by the range (e.g. foraging and other exploratory behaviours) and the implications of ranging on the hens’ affective states.
Acknowledgements
The authors thank Kinross Farm, the Research Centre for Proper Housing: Poultry and Rabbits (ZTHZ), University of Bern and Benzing CC and AU for their support. They thank all the staff, students and volunteers at the Animal Welfare Science Centre, particularly Dr Lauren Hemsworth.
Declaration of interest
This study was partly funded by a national competitive grant from Australian Eggs (formerly AECL) and student sponsorship for Hannah Larsen was partly funded through the Poultry Cooperative Research Centre. The authors declare no conflict of interest.
Ethics statement
All methods and animals used were approved by the University of Melbourne Animal Ethics Committee (approval number: 1413428.3).
Software and data repository resources
None.
Supplementary material
To view supplementary material for this article, please visit https://doi.org/10.1017/S1751731118000022