The introduction of, and advances made in, echocardiography as used in the care of children with cardiac disease represents one of the greatest advances in the field of paediatric cardiology. Paediatic echocardiography has developed in tandem with the field of adult echocardiography. In this review, we outline the history of echocardiography, especially as it relates to the care of children. We focus on the evolution of the technique, discussing how it has improved the care of children with congenitally malformed hearts and other cardiac conditions.
Early History of Echocardiography
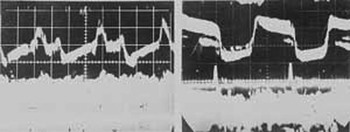
In postwar Austria, the neurologist, K. T. Dussik, working with his brother, employed ultrasound in an attempt to image the brain.Reference Dussik, Dussik and Wyt1 Later, the German physicist, W. D. Keidel, used ultrasound to examine the chest, and in so doing described the rhythm related to cardiac contraction.Reference Keidel2 Based upon this early work, Inge Edler and Hellmuth Hertz, working in 1953 in Lund in Sweden, collaborated with the express goal of understanding pathologic conditions in the heart. By using an industrial ultrasonic detector, it was possible to obtain transthoracic ultrasonographic signals showing the cardiac structures (Fig. 1).Reference Edler, Gustafson and Karlefors3 They initially focused their attention on the function and pathology of the mitral valve, since in the early 1950s, before the introduction of the left ventricular angiocardiography, there was no satisfactory method for the precise diagnosis of mitral valvar disease. The problem was very important, because at this time, before the pioneering work of Lillehei, and the introduction of the open heart surgery, patients presenting with pure mitral stenosis, or combined stenosis and incompetence with only a mild degree of regurgitation, were the only patients with acquired cardiac disease who were reasonable candidates for cardiac surgery. Prior to the introduction of open techniques, closed commissurotomy was the treatment of choice. Consequently, it was desirable to evaluate the degree of regurgitation before carrying out surgery on patients with combined stenosis and incompetence. Cardiac ultrasound, or as it would later be known echocardiography, held the possibility of best defining which subjects were the best surgical candidates.
Tracing from black and white film of M-mode echocardiograms early cardiac sonography equipment. The images shown are echo pattern records of the motion of the anterior leaflet of the mitral valve. (Courtesy of American Institute of Ultrasound Medicine Archives)

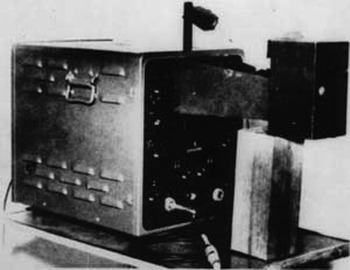
From the outset, Edler and Hertz were focused on using echocardiography to tailor the care provided for their patients. They went on to develop the concept of post-operative echocardiography, performing follow-up studies on their subjects who had undergone mitral commisurotomy.Reference Edler and Lindstrom4 They also introduced the concept of recording oscillations, pairing these with electrocardiographic tracings to create the first M-mode recordings, a diagnostic method that is still routinely performed as part of clinical echocardiography in 2009 (Fig. 2).
The early echocardiographic equipment used by Edler and Hertz to record M-mode echocardiograms. (Courtesy of American Institute of Ultrasound Medicine Archives)

Once the method became established as a diagnostic tool, investigators elsewhere, including China, Japan, and the United States of America, and later in the whole world, began to explore novel uses for the new technique. Adoption of these methods in routine clinical care demanded commercially available equipment. In 1958, Siemens, of what was then West Germany, produced a new type of sensor, which employed barium titanate as its piezoelectric material instead of quartz. The barium titanate proved to be more sensitive for echocardiographic use. With the new sensors, it proved possible to make recordings of structures previously impossible to record. Even in the majority of the patients having normally sized hearts, it was possible to record images of the atrial walls. This allowed visualization of phenomenons such as atrial fibrillation, and visualization of cardiac tumours, including atrial myxomas.
Introduction of Echocardiography to the United States of America
In the United States of America, as elsewhere, the principal application of the echocardiography during the 1960s was for the evaluation of disease of the mitral valve. Several groups of investigators demonstrated a strong correlation between the reduction the speed of the diastolic downward slope and the degree of stenosis. By the mid 1960s, there was a more coordinated effort to produce and market echocardiographic equipment for commercial use on a wider scale. Until this time, those working in Sweden and Germany had been forced to use industrial devices. In the United States of America, marketing proceeded through the parallel efforts of the Sonomedic and Smith-Kline French Corporations. The Sonomedic Corporation was the first to produce a machine, albeit that their pilot production proved not to be commercially viable. The Smith-Kline French Corporation adapted a small testing machine to the medical field, and the Ekoline 20 became available for commercial use. This was a transistorized instrument designed specifically for the medical use. It employed a sensor of 2.25 MHz, which had a repetition frequency of 200 pulses per second. By the beginning of the 1970s, a variety of commercial equipment was available on the market. These devices could demonstrate complete sweeping of echoes showing amplitude motion on a bar diagram recorder. Thus, it proved possible to make continuous recording of several cardiac cycles, simultaneously displaying other cardiac parameters, such as phonocardiograms and intracardiac curves of pressure. The method is still employed in combination with the formation cross-sectional images and Doppler interrogation.
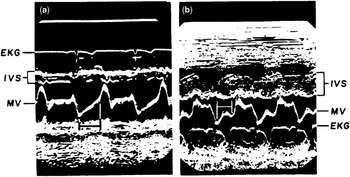
By the early 1960s, a number of clinical investigators, such as William L. Winters Jr. working at Temple University in Philadelphia, and Harvey Feigenbaum of the University of Indiana, had become interested in echocardiography. Feigenbaum and his colleaguesReference Popp, Wolfe, Hirata and Feigenbaum5 realized that echocardiography could be used not only in assessing the mitral valve and the atrial chambers, but also in analyzing the ventricles. In analyzing pericardial effusions, they showed that the postero-inferior wall of the left ventricle could easily be identified, and that the demonstrated movements corresponded with the cardiac cycle. These results stimulated a broader interest by employing echocardiography for the examination of the left ventricle. Techniques developed rapidly to measure mural thickness, internal dimensions, and stroke volume (Fig. 3).Reference Popp, Wolfe, Hirata and Feigenbaum5 These results increased the interest of cardiologists in using echocardiography, since they found the method well-suited to evaluation of left ventricular function.
Cross-sectional Echocardiography
While the initial experience with echocardiography generated significant excitement, the methodology was not widely adopted by practicing clinicians. It was obvious that the M-mode technique readily demonstrated the movement of cardiac structures. Many clinicians, however, could not understand the images produced in M-mode tracings, finding it difficult to correlate the tracings to produce three-dimensional images of the cardiac structures. It was in 1971 that Nicolaas Bom, working in the Netherlands, produced the first real time machine that displayed understandable moving cardiac images.Reference Bom, Lancee, Honkoop and Hugenholtz6 The system quickly became used in the real time assessment of cardiac anatomy and function.
Then, in 1974, Griffith and Henry published a method of sweeping a sector so as to produce cross-sectional images of the heart.Reference Griffith and Henry7 They employed the technique of impulse echo, using a simple ultrasonic sensor as previously employed in M-mode echocardiography. The technology employed was used in concert with commercially available machines, such as the Smith Kline Eskoline 20, which was modified with a mechanical engine which oscillated a standard sensor through sectors of 30 or 45 degrees. The rate of repetition of impulse of their system was roughly 3000 pulses per second, which provided about 30 frames per second. The use of a probe having a diameter of 12 mm produced images of high quality, allowing easy detection of structures such as the endocardium.
Echocardiography in Paediatrics and Congenital Cardiac Disease
Already in 1959, Effert and collaguesReference Lundstrom and Edler9 had reported the results of echocardiography in patients presenting with several congenital malformations, including atrial and ventricular septal defects, and persistent patency of the arterial duct. With the technology available at the time, however, they were unable to identify consistent patterns among their cohort, nor to distinguish them from subjects without congenitally malformed hearts. In consequence, studies focusing on the population with congenitally malformed hearts were abandoned for a period of time.
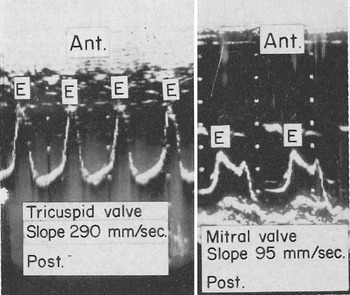
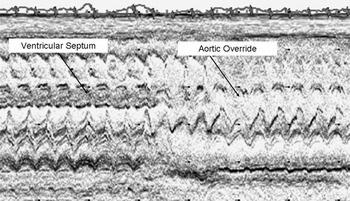
Not until approximatey 10 years later did the next publication emerge describing ultrasound as a potential diagnostic tool for those with congenitally malformed hearts. Entities such as tetralogy of Fallot could be identified (Fig. 4). In this next movement, investigators began to focus on the motion of the tricuspid valve to provide insight into shunt lesions. In patients having defects within the oval fossa permitting significant shunting, it was shown that the movement of the leaflets of the mitral valve was normal, but the leaflets of the tricuspid valve opened with greater speed. The speed of the slope of opening was shown to indicate the flow across the valve. In patients having ostium primum atrioventricular septal defects, it was shown that tracings of both the left and right-sided valves showed a higher speed of movement of the leaflets.Reference Ultan, Segal and Likoff8 In these cases, of course, the left-to-right interatrial shunt is usually combined with left-sided valvar regurgitation, and in consequence the velocity of flow of blood across the left atrioventricular valve is also increased (Fig. 5). In the patients with persistent patency of the arterial duct, and those with ventricular septal defect with shunting from left to right, the tracings demonstrated the highest speed of movement for the mitral valve, interpreted as representing increased flow across the mitral valve.
Echocardiographic m-mode tracing demonstrating normal motion of aortic leaflet of the mitral valve (a), and systolic anterior motion of the leaflet in a subject with hypertrophic cardiomyopathy (b). IVS- interventricular septum, MV- mitral valve.Reference Popp and Harrison35

Rapid motion of the valvar leaflets is consistent with an ostium primum atrioventricular septal defect. The accompanying phonocardiocardiogram demonstrates apical holosystolic and pulmonary ejection murmurs.Reference Ultan, Segal and Likoff36

At the first World Congress held on ultrasonic diagnosis in medicine, in Vienna in 1969, Nils-Rune Lundström, from Lund in Sweden, presented data from many various forms of congenital anomalies. He described the signs of the ventricular dilation, and the typical echocardiograms of patients with atrial and ventricular septal defects.Reference Lundstrom and Edler9
Ebstein’s malformation was then one of the first individual cardiac malformations in which echocardiography was shown to contribute markedly in diagnosis. Lundstrom and his colleaguesReference Pieroni, Homcy and Freedom12 described typical findings in 3 patients having large, displaced, leaflets of the malformed tricuspid valve and noted that the valvar leaflets closed later that normal, corresponding in time with the systolic click. These results were subsequently confirmed as existing in the majority of the patients with Ebstein’s malformation. A number of other forms of complex congenital cardiac malformations were subsequently described by Lundstrom and others, including disorders such as hypoplastic left heart syndrome, and sub-aortic stenosis, and so on.
M-mode parasternal tracing in infant with tetralogy of Fallot. The image plane sweeps from apex to base (left to right on the image). The disappearance of the ventricular septum tracing near the base of the heart is consistent with a ventricular septal defect and overriding aorta.

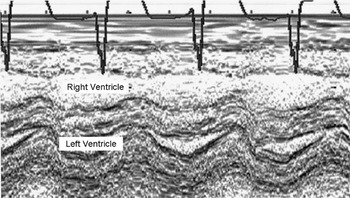
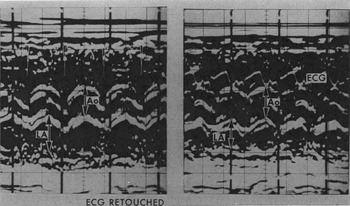
Stimulated by these findings, a number of investigators began to employ echocardiography for even the youngest children, describing also normal neonatal findings.Reference Bom, Hugenholtz, Kloster, Roelandt, Popp, Pridie and Sahn13, Reference Meyer, Stockert and Kaplan14 The features of double inlet ventricle, and the syndromes of hypoplasia of the left and right hearts, were described by several teams (Fig. 6).Reference Gramiak, Chung, Nanda and Manning15, Reference Hatle and Rokseth16 Silverman and his colleagues,Reference Hatle, Angelsen and Tromsdal17 working in San Francisco, observed that the left atrium was markedly enlarged in premature infants with patency of the arterial duct (Fig. 7). Subsequent to this observation, echocardiographic evaluation of the arterial duct became the standard tool for assessment of ductal patency in premature infants.
M-mode echocardiogram obtained from a parasternal long-axis view demonstrating the small left ventricular cavity in a child with hypoplastic left heart syndrome variant.

M-mode tracings from a young infant with patency of the arterial duct before (left panel) and after (right panel) surgical ligation. Ao = aortic root diameter, LA = left atrial diameter.Reference Silverman, Lewis, Heymann and Rudolph37

Initially, as we have already discussed, diagnosis of the various forms of congenitally malformed hearts had focused on M-mode tracings of the atrioventricular valves. Subsequently, investigators began to use the concepts of analyzing ventricular volumes and ventricular septal motion as popularized by Feigenbaum and Pop to understand congenital cardiac defects. Right ventricular dilation, combined with abnormal systolic movement of the ventricular septum, was described as being typical for right ventricular diastolic volume overload,Reference Tajik, Gau, Ritter and Schattenberg10 permitting diagnosis of lesions such as interatrial communications.Reference Diamond, Dillon, Haine, Chang and Feigenbaum11 Right ventricular volume overload was also identified as an important feature in a number of other lesions, including atrioventricular septal defects. It was recognized that the abnormal position and the insertion of the common atrioventricular valve was responsible for producing the characteristic echocardiographic images.Reference Pieroni, Homcy and Freedom12
By 1974, Sahn and his colleagues had used the cross-sectional equipment popularized by Bom to evaluate the cardiac anatomy in real time in infants with atrioventricular septal defects.Reference Bom, Hugenholtz, Kloster, Roelandt, Popp, Pridie and Sahn13 Three standard positions of the transducer were described for producing the characteristic sagittal and transverse cardiac cross sections. These workers, and other early investigators, demonstrated that complementary orthogonal imaging planes could reliably identify many forms of congenital cardiac disease. The transducers containing multiple crystals were shown to provide much more precise anatomical detail than had been possible using the sweeping techniques based on M-mode methodologies.
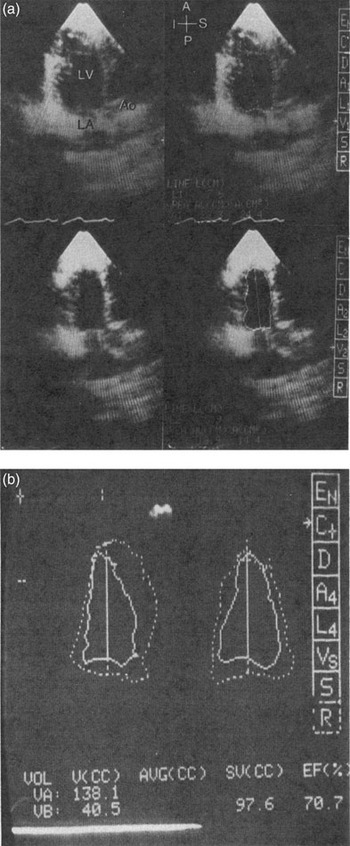
In parallel with the advances in echocardiography, cardiac angiography in the 1960s and 1970s had come to play an increasingly important role in the evaluation of children with congenitally malformed hearts. Angiocardiography in the best hands provided high quality imaging of nearly all forms of congenital cardiac malformations, and allowed additionally permitted quantitative assessments, such as calculations of ventricular volumes. The pioneers of imaging of the congenitally malformed heart understood that, if it was to gain widespread acceptance, echocardiography would need to provide the same level of precision in diagnosis. As such, several investigators understood that measurements made by those using echocardiography would need to be compared to the gold standard of angiography.Reference Meyer, Stockert and Kaplan14 This approach was to become a common theme throughout the next two decades. Silverman and colleagues,Reference Schiller, Acquatella, Ports, Drew, Goerke, Ringertz, Silverman, Brundage, Botvinick, Boswell, Carlsson and Parmley23 for example, found a strong correlation between end-diastolic dimensions of the left ventricle as revealed by cinematography and their echocardiographic measurements (Fig. 8). A similar correlation was shown for the end-systolic dimensions. In this fashion, echocardiography was shown to be an acceptable alternative in providing satisfactory assessment of left ventricular size and systolic function.
Also in 1974, the group headed by Meyer, working in Cincinnati,Reference Bierman and Williams24 had shown the value of echocardiography by evaluating the complex anatomy seen in the setting of right-sided as well as left-sided hearts. Using a combination of echocardiography and chest X-rays, these investigators, and others to follow, showed that a clear and accurate diagnosis of congenital cardiac disease could be achieved without the need for cardiac catheterization and angiography. Echocardiography also had the promise to assist in the diagnosis of a number of other lesions, such as discordant ventriculo-arterial connections. Following the advances in open-heart surgery, palliative surgery for transposition had first been described in 1963, by Mustard working at the Hospital for Sick Children, in Toronto. As prompt and correct diagnosis of this disorder could prove life-saving, echocardiographic diagnosis was obviously attractive. Such diagnosis, in fact, was initially made using M-mode methods,Reference Gramiak, Chung, Nanda and Manning15 the result being based on demonstration of the abnormal location of the aortic versus the pulmonary valve. While such criterions were useful, however, they were not always reliable. Not surprisingly, the advent of cross-sectional imaging was shown to be more valid for diagnosis of transposition.Reference Seward, Khandheria, Oh, Abel, Hughes, Edwards, Nichols, Freeman and Tajik26
The apical long-axis projection of the left ventricle (a) is shown in end-diastole and end-systole. A = anterior, P = posterior, I = inferior, P = posterior.Reference Silverman, Ports, Snider, Schiller, Carlsson and Heilbron38 The computer assisted biplane volume rendering (b) allows the measurement of ventricular volumes and derived stroke volume.

Development of Dopppler Echocardiography in Congenital Heart Disease
The ultrasonic instruments making it possible continuously to record the rate of flow of arterial or venous blood under the intact skin, or for the detection of the fetal heart, became commercially available in the 1960s. Subsequently, investigators were able to use these techniques to diagnose valvar regurgitation. Investigators were intrigued to find tricuspid and pulmonary regurgitation in the many congenital and aquired cardiac diseases, and showed that this methodology permitted estimation of pulmonary arterial pressures.
The abnormal signals of flow across ventricular septal defects could easily be recorded in parasternal planes of imaging, and could be localised using Doppler interrogation. Maximum velocities also could be obtained, and the difference in pressure between the left and right ventricles could be calculated.Reference Hatle and Rokseth16 The use of the equation of Bernoulli to calculate differences in pressure was extended to obtain gradients of pressure through all the valves, thus diagnosing obstructions, and to measure velocities of regurgitant jets through the valves and the prosthetic valves.Reference Hatle, Angelsen and Tromsdal17 Thus, it proved possible to record increased velocities in the setting of aortic stenosis, and multiple imaging planes were shown to be complementary in best estimating the gradient. Such calculations were found to correlate well with measurements obtain by cardiac catheterization.
Colour Doppler technology was pioneered by Japanese investigators, and made available for real time imaging by the Aloka company in 1985.Reference Omoto, Yokote, Takamoto, Kyo, Ueda, Asano, Namekawa, Kasai, Kondo and Koyano18 The advent of colour Doppler techniques allowed investigators to expand the use of echocardiography to assess in greater detail valvar stenosis and regurgitation. By this time, many centers had become efficient at accurately diagnosing numerous congenital cardiac malformations. Some defects, nonetheless, such as totally anomalous pulmonary venous connection, remained a challenge for accurate diagnosis using cross-sectional and M-mode techniques. The availability of colour Doppler interrogation permitted clinicians directly to identify the patterns of the flow of blood, and hence make reliable diagnosis of this life-threatening condition.Reference Kimball, Weiss, Meyer, Daniels, Ryckman and Schwartz19 The refinement of colour Doppler imaging soon was applied to all forms of congenital cardiac disease. The combination of both cross-sectional imaging and colour Doppler interrogation permitted echocardiographers to display images that were in many ways analogous to cineangiography. Such a step permitted more and more centers to proceed comfortably with open-heart surgical procedures without the need for diagnostic cardiac catheterization. The initial description of the Aloka SSD-880CW machine, for example, proposed that colour Doppler interrogation was “ideal for use in children and patients who are too frail for catheterization”. While it would take another decade for nearly all centers to embrace echocardiography as the definitive diagnostic tool for management of patients with congenitally malformed hearts, the transformation was underway.
Multiple Imaging Planes
From the outset, investigators had understood that imaging congenital cardiac lesions in children posed some special challenges. Firstly, children with congenitally malformed hearts were more likely to have anomalies of systemic and pulmonary venous connections, as well as abnormal ventriculo-arterial connections. As such, echocardiographic imaging that was limited to precordium would not necessarily provide adequate planes of imaging fully to delineate these structures. Investigators, therefore, explored additional planes for imaging beyond the traditional parasternal and apical approaches. The innovation of wide field sector scanning of the heart from other planes brought the arena of congenital imaging and physiology to a new era of importance. The apex view was evaluated by those working in San Francisco,Reference Hanley, Sade, Blackstone, Kirklin, Freedom and Nanda31, Reference Rhodes, Colan, Perry, Jonas and Sanders32 opening the field of apex echocacardiography and the four chamber view that remain today as the standard practice of cardiac examination.Reference Silverman and Schiller20, Reference Ports, Silverman and Schiller21 The apex technique using orthogonal planes that permitted the use of direct planimetric methods became the standard for analysis of left ventricular volumes and calculation of ejection fractions,Reference Silverman, Ports, Snider, Schiller, Carlsson and Heilbron22, Reference Schiller, Acquatella, Ports, Drew, Goerke, Ringertz, Silverman, Brundage, Botvinick, Boswell, Carlsson and Parmley23 as well as the evaluation of left atrial volume.
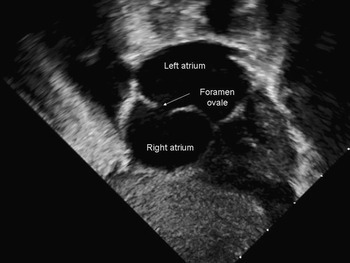
Because one of the important clinical questions focused on the presence and size of atrial septal defects, especially in lesions such as transposition, there was considerable interest in profiling the atrial septum to determine which subjects might be candidates for atrial septectomy or septostomy. It was realized that, especially in young children, the subxiphoid, or subcostal, plane provided an excellent acoustic window for visualizing the atrial septum (Fig. 9).Reference Bierman and Williams24 It also became apparent that subcostal imaging could allow tomographic reconstruction of all elements of cardiac anatomy, including the systemic and pulmonary venoatrial connections, the atrioventricular valves, the ventricular septum, and the ventrioculo-arterial connections. Those working in Boston, headed by Roberta Williams, also performed the seminal maneuver of inverting the fan of the imaging plane, thus providing attitudinally appropriate anatomic orientation, a feature which has now become standard for representing images of congenitally malformed hearts, albeit unfortunately not yet accepted by those working with acquired cardiac disease.
Subcostal cross-sectional imaging of the atrial septum in infant with transposition of the great arteries.

In addition, clinicians understood that precise determination of the morphology of the arterial trunks was critical in determining the optimal approach to surgical treatment. For example, identification of the sidedness of the aortic arch, and the extent and severity of hypoplasia in those with aortic coarctation, were all critical in achieving the best surgical result. As such, investigators were interested in using suprasternal planes to define these anatomical features. Based upon the pioneering work of Snider, Silverman, and others,Reference Popp and Harrison35 imaging from the suprasternal notch also became routine in the evaluation of children with suspected congenital cardiac disease. Fortunately, as was the case for subcostal imaging, young children tended to have less interference from the lungs, and the presence of a sizeable thymus in the very young allowed excellent images to be obtained of the arterial trunks and systemic veins, images that proved to be far superior to the images that could usually be obtained in adults.
Higher frequency transducers
Based upon initial work by Edler and Hertz, echocardiographic imaging was initially undertaken with transducers with a range of 2 to 2.5 MHz.In an adult patient, the left atrium may be as far as 20 cm from the apical imaging window, so to achieve adequate penetration of far field objects, such a low frequency transducer is well suited. The low frequency transducers, however, offer relatively poor spatial resolution. This is particularly problematic for young children, whose hearts are small, and in whom spatial resolution is important. It was recognized early on that imaging in young children was best achieved by using higher frequency transducers. Initially, as industry had developed higher frequency probes for adults, such as those of 5.0 MHz, the paediatric clinicians relied primarily on these probes. For young infants, nonetheless, even probes of 5.0 MHz represented too low a frequency to obtain the ideal images. Clinicians, therefore, encouraged industry to design echocardiographic probes specifically suited for young children. By 1984, Sahn and others had started the campaign to encourage the manufacturers to develop transducers of higher frequency for studies of babies. These probes were required to have a small footprint, to allow imaging in the suprasternal notch and between rib spaces. In addition, the probes were required to have frequencies in the range of 10 mHz, achieved in the 1990s, and now as high as 12.5 MHz.
Transoesophageal echocardiography
Early in the development of echocardiography, investigators considered the possibility of obtaining cardiac images by placing the probe in the oesophagus, this being one of the approaches initially considered by Edler and Hertz. In practice, transoesophageal echocardiography developed through a number of steps, starting first with continuous wave Doppler, proceeding to M-mode imaging, and only later to cross-sectional real-time imaging.Reference Hisanaga, Hisanaga, Hibi, Nishimura and Kambe25 Initial devices required rigid endoscopes, which tended to limit the clinical utility. In the subsequent decades, investigators introduced a number of important advances, including progressive miniaturization, flexible endoscopes, and the transition from monoplane to biplane, and subsequently mulitplanar imaging. Colour Doppler interrogation was also incorporated.
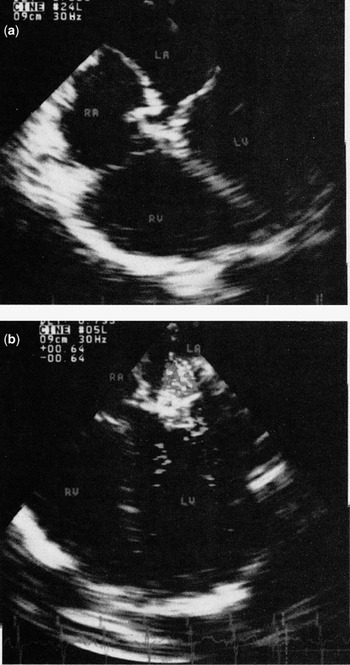
From the outset, it was understood that the technique had the potential to contribute greatly to those with congenitally malformed hearts.Reference Seward, Khandheria, Oh, Abel, Hughes, Edwards, Nichols, Freeman and Tajik26 In children, the modality initially found its greatest utility as an adjunct to surgical management. Transoesophageal interrogation was found to be particularly valuable in pre-operative assessment of those with sub-optimal transthoracic windows. In addition, the technique proved to be invaluable in the immediate post-operative assessment. The incorporation of colour Doppler technology became particularly valuable,Reference Ritter27 permitting surgeons to address residual lesions before leaving the operating theater (Fig. 10).Reference Muhiudeen, Roberson, Silverman, Haas, Turley and Cahalan28 As was the case with transthoracic probes, however, the probes initially available commercially proved far too large to use in very young children. Again, with persistence from a number of clinicians, the manufacturers were persuaded to develop specific probes that could be used safely in young children with weights as low as 2.5 kg.Reference Bruce, O’Leary, Hagler, Seward and Cabalka29
(a) Transoesophageal image of an ostium primum atrioventricular septal defect. RA = right atrium, LA = left atrium, RV = right ventricle, LV = left ventricle.Reference Ritter39. (b) Transoesophageal image of an ostium primum atrioventricular septal defect following surgical repair. Doppler interrogation demonstrates residual regurgitation across the left atrioventricular valve.

Cardiac assessment and planning for surgical intervention
Echocardiography in children has been focused primarily on obtaining a complete anatomic diagnosis to best plan for surgery. In this respect, there may be several potential surgical approaches. The best approach often depends upon subtle anatomic details. In particular, hypoplasia of a valve or ventricle may preclude a complete anatomic repair. In adults, many recommendations for management are based upon absolute values, such as left ventricular end-systolic dimensions, or the size of the aortic root. It was soon recognized that, in children, it was necessary to express such measurements in relation to body size.Reference Gutgesell, Paquet, Duff and McNamara30 As such, numerous investigators worked to provide normal ranges based upon body surface area. These values are often expressed as Z scores, or standard deviations. Based upon these concepts, echocardiography has made a number of fundamental contributions to the management of children with complex cardiac malformations. In pulmonary atresia with intact ventricular septum, for example, it was found that the Z score of the tricuspid valve provided important prognostic information about the suitability of the right ventricle to support the pulmonary circulation.Reference Hanley, Sade, Blackstone, Kirklin, Freedom and Nanda31 In cases of left ventricular hypoplasia, the calculations of the size of the components of the left heart allowed reasonable prediction of the adequacy of the left ventricle to provide the systemic cardiac output.Reference Rhodes, Colan, Perry, Jonas and Sanders32–Reference Kovalchin, Brook, Rosenthal, Suda, Hoffman and Silverman34 These quantitative approaches have become increasingly used in the care of children with a number of other congenital cardiac lesions.
Conclusions
Echocardiography has played a major role in the improved outcomes for children with cardiac disease. Those involved in paediatric cardiology have adapted and refined techniques from adult echocardiography to manage children. Efforts to develop algorithms specific for the treatment of children, and to design specific equipment, such as smaller transducers, have helped advance the field forward. Continued advances will for sure ensure that echocardiography will continue to play a critical role in paediatric cardiology for years to come.