

INTRODUCTION
In order to increase food supplies, the European Union Agricultural Policy (EUAP) has promoted cultivation of marginal areas, or promotion of crops in less productive areas (Iglesias et al., Reference Iglesias, Mougou, Moneo and Quiroga2011; Olesen and Bindi, Reference Olesen and Bindi2002), including closed landfills (Battiston, Reference Battiston2013; Chen, Reference Chen2007).
Landfill re-cultivation in the past was often a subject of experimental trials with contrasting results (Strzyszcz, Reference Strzyszcz1996; Tintner et al., Reference Tintner, Meissl and Klug2008). The success of the efforts appeared to depend on the kind of waste deposit and the top cover, and influenced by planning after the use of landfill site (Rodionov et al., Reference Rodionov, Nii-Annang, Bens, Trimborn, Schillem, Schneider, Raab and Hüttl2012). Under different climatic conditions and possible impacts of emissions, including methane, the seeded crops often failed partly or even completely (Brosseau and Heitz, Reference Brosseau and Heitz1994). Moreover, well adapted, highly competitive ruderals or short-lived plant species dominated instead (Rebele and Lehmann, Reference Rebele and Lehmann2002). Urban development and construction of buildings produce huge amounts of excavated soils, which are deposited elsewhere or at landfill sites. This type of material, characterized to be highly heterogeneous, with an important presence of concrete and bricks fraction as well as stones, is often used for the top cover of landfills. New fields are created and farmers are challenged to cultivate these newly created habitats (Dickinson, Reference Dickinson2000; Ettala, Reference Ettala1988).
Cultivation in less productive fields, including closed landfills, has become convenient since EUAP subsidies covered part of higher cultivation costs and/or minor production, as well as the risk to obtain the yield (Bazzani, Reference Bazzani2008). The cultivation of crops relying less on rainfall and soil fertility and requiring agronomic techniques well known at farm scale such as winter wheat (Triticum aestivum L.), barley (Hordeum vulgare L.), represents the easiest way to reduce such risks (Eitzinger et al., Reference Eitzinger, Štastná, Žalud and Dubrovský2003). The potential crop simplification that may occur in closed landfills is fairly in contrast with the actual direction of the European agricultural policy and also for a series of agronomical reasons. Crop rotation is traditionally regarded as an important strategy for pest control (Bullock, Reference Bullock1992), especially for weeds (Andres et al., Reference Andres, Concenço, Theisen, Galon and Tesio2012; Liebman and Dyck, Reference Liebman and Dyck1993), reduction of soil sickness and plant autotoxicity (Vidotto et al., Reference Vidotto, Tesio and Ferrero2013) and increased field biodiversity (Tesio and Follis, Reference Tesio and Follis2011), as well as for the enhancement of nutrient efficiency and soil fertility (Blair and Crocker, Reference Blair and Crocker2000).
In northern Italy, winter crops, including wheat, barley and Italian ryegrass (Lolium multiflorum L.), are commonly rotated with maize (Zea mays L.), both for silage or grain production. Cultivation of this species became the most widespread crop in North Italian lowlands, and there was a growing interest for this in less productive fields such as those located on landfills. Maize permits to insert into crop rotation a spring–summer species, with a high yielding potential, the possibility of non-food plant and, in the case of grain production, a large amount of highly degradable residues that may contribute to preserve organic matter content in the soil (Rochette et al., Reference Rochette, Angers and Flanagan1999). Moreover, weed community infesting maize is fairly different from that present in winter crops, implying a different management strategy with considerable advantage in terms of weed pressure over time (Blackshaw et al., Reference Blackshaw, Larney, Lindwall, Watson and Derksen2001; Légère et al., Reference Légère, Stevenson and Vanasse2011).
Yields of dry land, spring maize vary greatly from year to year, mainly because of variable and unpredictable amount of rain during growing cycles, determined by the stress seasons (summer) and especially by the stress years (periodical droughts; Morell et al., 2011). Despite this, producers need to formulate efficient decision on crop species, soil tillage, planting date, maturity type, planting rate and fertilizer rates to maximize yields’ profit and minimize risks related to unpredictable weather conditions, especially nowadays with a prospective lower dependency on EUAP incentives (Tesio et al., Reference Tesio, Tabacchi, Cerioli and Follis2013).
The aim of this paper was to evaluate the adaptability of grain maize of different maturity classes to cultivation on a closed landfill with the adoption of two different minimum tillage methods.
MATERIAL AND METHODS
A 4-ha landfill site was established from 1980 to 1985 on a field in Southern Torino, Italy (44°58′N, 7°44′E), 1.5 km from the town of Trofarello and 230 m above the sea level. The landfill was used as a source of clay for bricks; then in 1990 it was filled with solid waste material from local municipalities and subsequently covered with 0.9 m of soil and concrete rubble. At 0–30 cm, the sand, silt and clay contents of the soil were 490, 430 and 80 g kg−1, respectively. Organic C was 9.5 g kg−1 and organic N was 1.29 g kg−1. Due to a significant amount of concrete material present in the topsoil layer, mouldboard ploughing was not possible. The area was previously used as set-aside or for winter crops such as winter wheat, barley or Italian ryegrass (Lolium multiflorum L.).
The experiment was carried out in 2011 and 2012 on permanent 80 × 6-m (equal to eight rows) plots on landfill plateau. The plot represented the experimental unit, and treatments were distributed randomly in the plots. The main factor was represented by two levels of tillage input: ‘high’, where soil cultivation was obtained with a chisel plowing working at a dept of 0.35 m, followed by a disk harrowing passage at 0.20 m; or ‘low’, where only the disk harrowing passage was carried out. The second factor was the maturity growing cycle of the hybrid, using three hybrids for each of the FAO classes, i.e. FAO 200, 300 and 400 (FAO international classification; Gretzmacher, 1979). Hybrids were chosen among those cultivated most in that area: Atletico and Ronaldinio – KWS Italy and PR39F58 – Pioneer Hi-Bred among class FAO 200; Anjou – LG Seeds, Cisko – NK Seeds and DKC4490 – Dekalb Italia among class FAO 300; and LG30310 and LG3395 – LG Seeds and Galactic – NK Seeds among class FAO 400 (Gretzmacher, 1979). Results of the set of hybrids were pooled together for each maturity class. This was because the aim was to investigate the effect of the maturity class rather than the response of the single variety. All treatments corresponding to the combinations of soil tillage and maturity class were replicated twice.
In 2011, three weeks before the beginning of the study, the whole field was sprayed with the herbicide glyphosate (1440 g ha−1 a.i.). Cultivation practices for high and low tillage inputs were carried out on the same day; sowing was performed on the next day with a pneumatic machine operating at 0.75 m between rows, delivering 8.3 seeds m−2 for FAO classes 200 and 300, while 7.4 seeds m−2 for class 400 (Gretzmacher, 1979). Seeding was undertaken on April 16th in 2011 and April 6th in 2012. Weed control was obtained with a single post-emergence herbicide application when plants reached the 4-leaf stage, using a mixture composed of foramsulfuron (56.25 g ha−1 a.i.), prosulfuron (20 g ha−1 a.i.) and dicamba (200 g ha−1 a.i.). Herbicides were applied using farm equipment with 10 nozzles mounted on a 7.5-m spraying bar, adjusted to deliver 400 L ha−1. A following in-row harrowing passage was applied at 6–7-leaf stages at a speed of 5 km h−1. Fertilization was split into three time stages during the growing cycle: 250 kg ha−1 of mineral fraction spread before soil tillage (N–P–K = 5–10–25), followed by 190 kg ha−1 of ammonium phosphate (N–P = 18–46) delivered by a seeder, and urea (46% of nitrogen) applied during inter-row harrowing at 200 kg ha−1.
Data regarding the amount of rainfall that occurred during the growing period were obtained from Syngenta agrometeo website (www3.syngenta.com/country/it). Crop density was determined before herbicide treatments by counting the number of plants in a 20-m row, repeating the counting twice per plot. Weed presence was assessed immediately before herbicide treatment and then one week after inter-row harrowing by counting the number of plants per each species found in a 0.5 × 0.5 m2. Assessment areas were randomly chosen in the plots and repeated four times per treatment. For each sample, yield and moisture content of grains were obtained during harvest (August 27th in 2011 and September 4th in 2012) by collecting the whole crop with a combine harvester and subsequently weighing the production.
Data collected were subjected to ANOVA with the free statistical software R (Ritz and Streibig, Reference Ritz and Streibig2005), and groups of homogeneity were detected with the Wallet post-hoc test. Before ANOVA, the data were tested for homogeneity utilizing the Levene test, and a T-test (p < 0.05) was performed on the three varieties of the same maturity class to strengthen the homogeneity of the grouping.
RESULTS
Rainfall levels were considered from February 26th until the middle of August for each year, allowing a realistic estimation of the amount of water useful for maize cultivation. Even if the total value was higher in 2012 (430 mm), the rainfall distribution was more favourable for maize growth in 2011 (280 mm) because most of the precipitations occurred around flowering and grain filling stages. In 2011, a prolonged drought was observed in March and April. By contrast, 2012 was characterized by a good amount of rainfall before seed bed preparation and after sowing, but with fewer precipitations during the pre-flowering period, representing a critical stage for plant growth. A good amount of precipitation occurred at the end of June 2012 when the crop had already suffered drought stress. Temperature regimes recorded in the two considered growing seasons were almost similar to that observed over a period of 18 years.
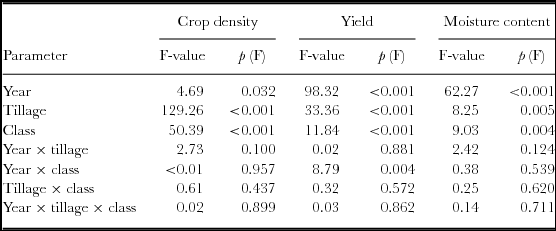
The analysis of variance across crop density showed significant effects for the parameter year (2011 or 2012), tillage input (chisel plowing plus disk harrowing, or disk harrowing only) and class (maturity classes 200, 300 and 400), while the interaction result was not significant (Table 1).
Analysis of variance carried out on crop density, yield and moisture content response presenting the main effects and the interactions.
As expected, plant emergence result was more difficult in the case of reduced soil tillage input (low), while in the case of higher tillage input, where the chisel passage permitted a better soil bed preparation, the number of emerged plants was always higher (Table 2). In both years, class 400 showed better emergence performance, as less than 0.4% of plants did not emerge in the case of higher tillage input, and no differences were recorded among classes with lower input. On average, the cultivation with disk harrowing only (low) caused reduction in plant density of about 17% and 13% in 2011 and 2012, respectively. The lower emergence recorded in 2011 is likely due to the non-ideal soil bed preparation related to the low amount of rain occurred.
Crop density assessed in the two growing seasons and comparison with the seed density of each class and tillage input.
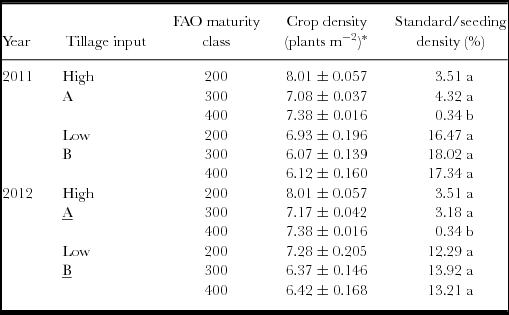
*Mean values ± standard error, with n = 9. Values sharing the same letters were not significantly different with the Wallet post-hoc test (p ≤ 0.05).
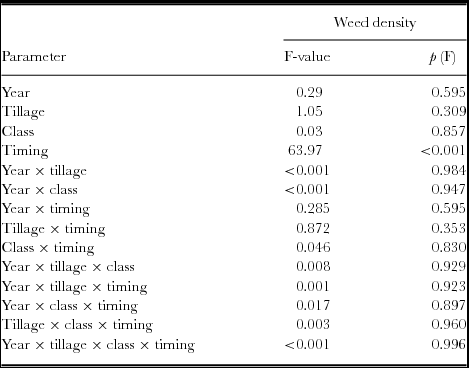
The weed presence was only affected by the survey timing showing a statistical effect of the adopted weed control method (Table 3). The efficacy of the herbicide treatment followed by inter-row harrowing was similar among treatments, ranging from 84.5 to 90.3%.
Analysis of variance carried out on weed density response presenting the main effects and the interactions.
Weed composition observed in the field was characterized by the typical weedy flora recorded in the cropped cereal systems of Northern Italy. Among the dicot weeds, the most common were Polygonum persicaria L. (45%), Portulaca oleracea L. (11%), Convolvulus arvensis L. (10%), Galinsoga quadriradiata Cav. (8%) and Chenopodium album L. (8%), while Cynodon dactylon (L.) Pers. (5%) and Digitaria sanguinalis (L.) Scop. (3%) were the most abundant monocot species. The remaining 10% of infestation comprised Taraxacum officinale F.H. Wigg, Amaranthus retroflexus L., Echinochloa crus-galli (L.) Beauv, Lolium spp., Polygonum aviculare L. and Cirsium arvense L. Scop. Small patches of Sorghum halepense Pers. were irregularly found in the field.
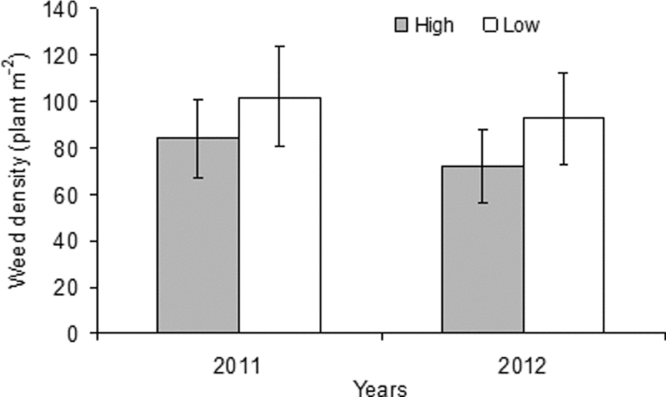
Considering that weed infestation was assessed before weed management, in both years a slightly lower weed presence in high input was assessed, even though it was not significantly different in the two years of study (Figure 1).
Weed density assessed before herbicide treatment. Bars represent the standard mean error (n = 12).

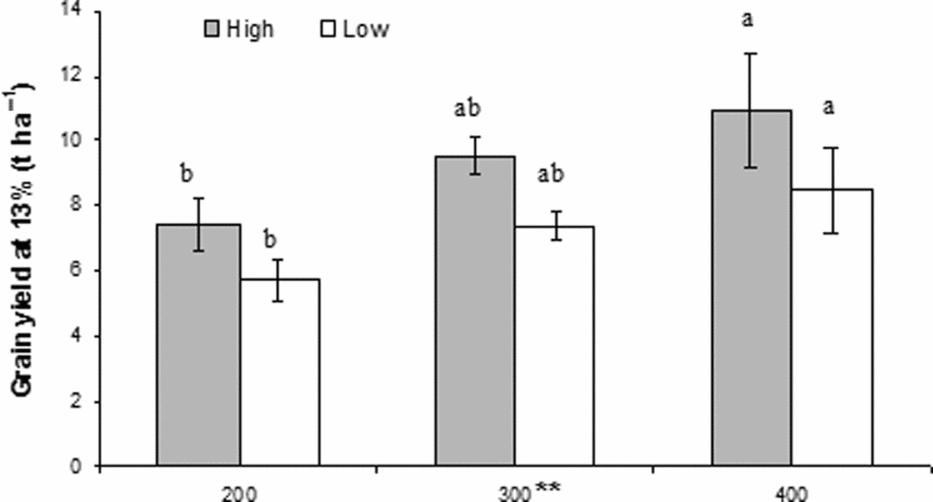
Similar to the effects observed for crop density, grain yield and moisture content results at harvest were affected by year, tillage and class (Table 1), even though for yield a significant interaction in ‘year × class’ was found. In 2011, the highest grain yield was recorded with the hybrids of the FAO 400 class, varying from 10.9 and 8.5 t ha−1 in high and low tillage input, respectively (Figure 2). Between tillage input levels, a significant difference was only observed in the FAO 300 class, with 2.2 t ha−1 of additional yield in high input. It is interesting to note that the lowest production observed in 2011 with the FAO 200 treatment class with low tillage input was similar to the best performance obtained in the second year of the study. In fact, in 2012 no difference among maturity classes was found (Figure 3), with an average yield of 5.6 t ha−1 and 3.6 t ha−1 for high and low tillage inputs, respectively. Considered overall, a strong yield reduction was observed between 2011 and 2012, and in the last year lower differences were recorded among treatments.
Maize grain yield at 13% of moisture content in 2011. Bars represent the standard mean error (n = 6). Values sharing the same letters were not significantly different with the Wallet post-hoc test (p = 0.05). **Significant differences between tillage input with p ≤ 0.01.
Maize grain yield at 13% of moisture content in 2012. Bars represent the standard mean error (n = 6). *Significant differences between tillage input with p ≤ 0.05, or **p ≤ 0.01.
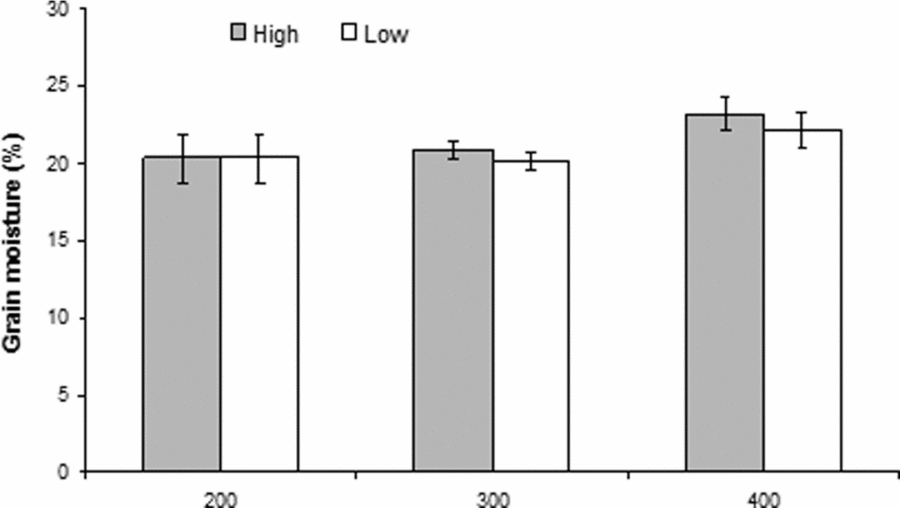
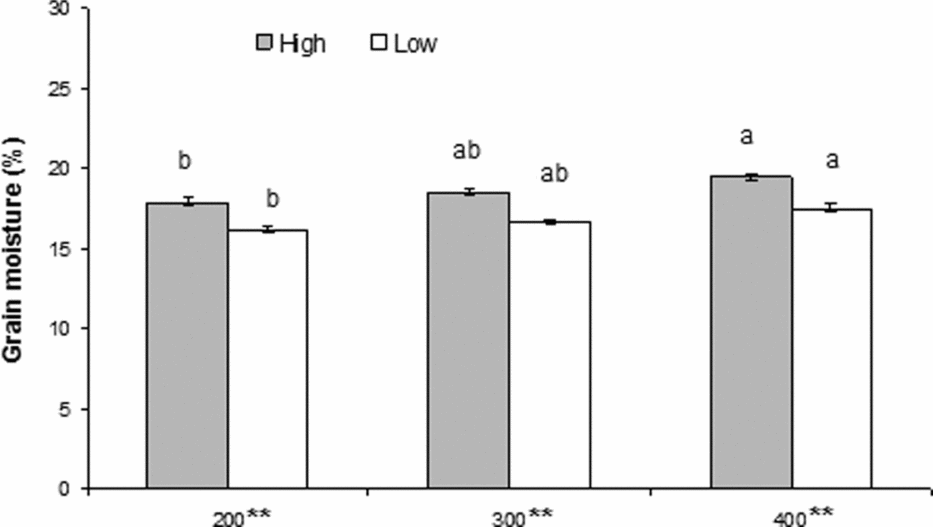
All maturity classes had a grain moisture content of less than 24% in 2011, with no differences among treatments (Figure 4). This was likely due to the absence of precipitation in the month preceding the harvest. In 2012, probably due to both earlier seeding and later harvesting time, as well as the stressed period during flowering, a lower moisture content was observed compared with 2011 (Figure 5). High tillage input always resulted in higher moisture content (about 2% more), and the lowest moisture content was observed with maturity class 200 (17.9% and 16.1% in low and high tillage input, respectively).
Maize grain moisture at harvest in 2011. Bars represent the standard mean error (n = 6).
Maize grain moisture at harvest in 2012. Bars represent the standard mean error (n = 6). Values sharing the same letters were not significantly different with the Wallet post-hoc test (p ≤ 0.05). **Significant differences between tillage inputs with p ≤ 0.01.
DISCUSSION
The adoption of conservation tillage systems is currently used by growers for the cultivation of winter cereals; however it has to some extent been limited by effective and perceived yield reduction in maize cultivation on weed control concerns (Kettler et al., Reference Kettler, Lyon, Doran, Powers and Stroup2000). Our results confirm those of Plaza et al. (Reference Plaza, Kozak, Navarrete and Gonzalez-Andujar2011), indicating that the tillage system alone does not significantly determine weed diversity, yet the species pool investigated here had few perennials. As observed by Blackshaw et al. (Reference Blackshaw, Larney, Lindwall, Watson and Derksen2001), only small weed community changes may occur during transition from conventional to minimum tillage, thus few changes in their weed control programs may be required. In this study we reinforced that weed growth was remarkably controlled (always higher than 80%) with the current agronomic techniques used for maize cultivations. Even if not significantly different, weed presence was reduced after two years of maize cultivation, showing a possible positive effect of the addition of maize into the rotation with only winter crops. Probably, the establishment of a long-term crop rotation in landfill may increase the rotation effects (Ball, Reference Ball1992).
The present study indicates that maize production can be achieved with reasonable costs, especially if compared with the production obtained with winter wheat, on less productive soils such as closed landfills. On long-term basis, costs for wheat and maize grains are almost similar, allowing the introduction of maize into crop rotation independent of EUAP subsidies. On average, wheat and barley required a lower amount of inputs, which is reflected in a lower cost for farmer. The increased cost to grow maize is likely to be compensated by the higher yield of this crop rather than that obtained with winter wheat generally attained in the considered area with a comparable input level (Donatelli et al., Reference Donatelli, Stöckle, Ceotto and Rinaldi1997; Mazzoncini et al., Reference Mazzoncini, Di Bene, Coli, Antichi, Petri and Bonari2008).
Crop diversification also allows greater choice of herbicides from different chemical families that help in overall improved weed management and may reduce the risk of herbicide resistance (Beckie, Reference Beckie2006; Colbach and Debaeke, Reference Colbach and Debaeke1998). The occurrence of herbicide resistance has always been deemed to negatively affect crop production (Knezevic, Reference Knezevic2007), and particularly harmful effects may occur in landfills where the outcome margins are usually small.
As expected, environmental conditions vary dramatically from year to year, especially in the Mediterranean area (Morell et al., Reference Morell, Lampurlanés, Alvaro-Fuentes and Cantero-Martìnez2011). Farmers are therefore aware that weed species, crop density and crop yield may be affected more by temperature and rainfall conditions in a given year than by some agronomic practices. This emphasizes the need for growers to carefully manage the more appropriate solutions that permit to reduce the effects of climate variation. Even if the study was carried out on only two years (i.e. 2011 and 2012), growing seasons presented important limiting factors such as the drought during spring in 2011, and the low precipitation amount together with high temperatures during maize flowering in 2012. In our study we found that the adoption of chisel plowing coupled with disk harrowing reduced yield fluctuation among years, as well as higher yielding performance if compared with the single disk harrowing passage. This is in agreement with the results reported in semi-arid highlands by Verhulst et al. (Reference Verhulst, Nelissen, Jespers, Haven, Sayre, Raes, Deckers and Govaerts2011). On landfill soil, the use of hybrids belonging to the FAO maturity classes 300 and 400 furnished better results in terms of yield compared with the FAO maturity class 200 (Gretzmacher, 1979). If the grain moisture content is also taken into account, the FAO class 300 appeared the most convenient class in both years, production was similar to that of the latest maturity class and moisture content was equal to the earliest class.
Even if not the real landfill site, human development around cities is responsible for poor quality of soils, and several times there remains real pollution caused by the spreading of building materials (Liu et al., Reference Liu, Dietz, Carpenter, Alberti, Folke, Moran, Pell, Deadman, Kratz, Lubchenco, Ostrom, Ouyang, Provencher, Redman, Schneider and Taylor2007; Morillo et al., Reference Morillo, Romero, Maqueda, Madrid, Ajmone-Marsan, Grcman, Davidson, Hursthouse and Villaverde2007). The results from this investigation can be profitably extended to similar soil conditions and, as suggested by Pavao-Zuckerman (Reference Pavao-Zuckerman2008), even contrast the establishment and diffusion of unwanted invasive plant species.