

INTRODUCTION
The ultimate aim of any specialist report must be to aid the interpretation of the relevant site and to further the development of its discipline. Specialist ceramic building material (CBM) reports can contribute to the interpretation of sites in many ways: inter alia, diagnostic pieces such as tegula cutaways can provide dating, the different types of tile can indicate the structures that used them, fabrics can identify the supply sources and potentially how they evolved, and quantification can say something about the overall site and the processes it may have undergone. CBM was heavily recycled as buildings were demolished or modified, with, for example, old tegulae being repurposed inter alia as wall-tiles, flooring, hearths, drains, pilae or general hardcore. This CBM afterlife can materially impact the quantification results, but, properly interpreted, can also inform the evolution of the site.
The Archaeological Ceramic Building Materials Group (ACBMG) has established guidelinesFootnote 1 for the management of CBM from excavations and recommends that the recording should encompass (a) quantification by sherd count and weight (but provides no guidance on how this should be undertaken or interpreted), (b) fabrics with reference to regional series, (c) forms present and (d) supporting details such as the occurrence of nail holes, sooting, mortar etc. All of these aspects are important, but this note is concerned with quantification only, the first of ACBMG's four elements.
Quantification offers not just an overview of the site assemblage, but also the opportunity to produce syntheses across multiple excavations within a town or between more distant locations that have been recorded using similar methodology. It should help distinguish between collapsed material and tiles that have been dumped, in order to identify where robbing has probably taken place. The degree of fragmentation should distinguish between relatively undisturbed sites and those that have been subject to continuous churn. We may also use quantification to postulate the type of buildings within the site.
CURRENT METHODOLOGIES
Quantification systems typically divide the assemblage into fabrics (when expertise and resources are available) and then into constituent forms before counting and weighing each of the form groups by context. Further analyses by site phase and location may also be undertaken where possible. The division is normally into generic forms: tegulae, imbrices, brick and flue-tiles, with special forms, for example chimneys, listed separately. It is possible to weigh each piece of CBM individually but little information is lost if each form group within a context is weighed collectively. However, although all specialists superficially approach the task in the same manner, there are significant differences in the way they allocate material into the constituent form groups.
To explore these differences, six very comprehensive reports, all but one of which has been published, from a cross-section of Romano-British urban sites spread across the country have been selected for detailed analysis. Urban sites were chosen because they typically suffer a high degree of constructional churn which should generate greater assemblage homogeneity than more isolated sites with less continuous redevelopment, thereby making differences in methodologies more visible. The six sites listed in table 1 comprise three civitas capitals, two sites with military associations and one small town. As shown in the third column, only two of the reports provide specific information on how the different tile forms have been defined and allocated for their quantifications: Alchester defined brick as tiles with a thickness of 40 mm and above, but otherwise used similar but slightly broader form definitions to those proposed later in the paper; Winchester was slightly less specific and used 30 mm and above as the threshold for brick. Only two of the sites report a full fabric analysis broken down into contexts and tile forms. It is important to emphasise that each of these site reports is entirely valid and that the differences between them are only highlighted for the purposes of comparing methodologies and not as criticism.
CBM REPORTS ANALYSED
(Alchester: Allen et al. Reference Allen, Atherton, Booth, Booth, Evans and Hiller2001, 257, tables 6.11–12; Caerwent: this site has not yet been published and the data have been extracted from the forum-basilica excavation records held by the National Museum of Wales; Carlisle: Pringle Reference Pringle and Howard-Davis2009, 888, table 64, The Carlisle Millennium Project; Leicester: Martin Reference Martin, Connor and Buckley1999, 301, table 56, Causeway Lane; Winchester: Poole and Shaffrey Reference Poole, Shaffrey, Ford and Teague2011, 291, table 7.21, Northgate House, Staple Gardens and the former Winchester Library sites; Worcester: Cleverley Reference Cleverley, Dalwood and Edwards2004, 341, tables 58–61, Deansway)

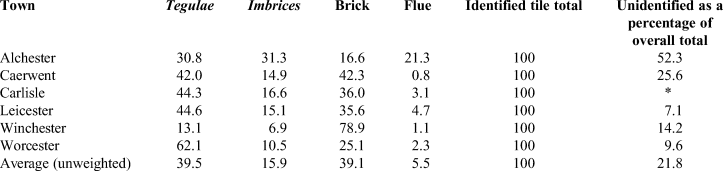
Table 2 provides the assemblage composition by weight for each of the towns showing the percentage of each component type that was present and the residual proportion of unidentified fragments. The overall average of the proportion of tegulae to imbrices is 2.5:1 (39.5:15.9). This almost exactly matches the result we would expect if the assemblages were fully representative of the original roofs, which would effectively have been comprised of equal numbers of tegulae and imbrices and therefore have matched the 2.4:1 ratio of a complete tegula (13.6 lb/6.16 kg) to a complete imbrex (5.6 lb/2.54 kg).Footnote 2 However, there is considerable variation between the towns, with the Alchester ratio being 1:1 and the Worcester ratio 5.9:1. The Alchester ratio is explained by the inclusion of a grave lined with large fragments of imbrex, but the Worcester ratio either shows that the assemblage contained a disproportionate number of tegulae, perhaps due to differential robbing of the imbrices, or that the methodology favoured the identification of tegulae over imbrices. The very low proportion of unidentified material at Worcester (9.6 per cent) may hint that more flat fragments were identified as tegulae than at the other sites.
ASSEMBLAGE COMPOSITIONS BY WEIGHT, EXPRESSED AS PERCENTAGES (*Unidentified material was not recorded)
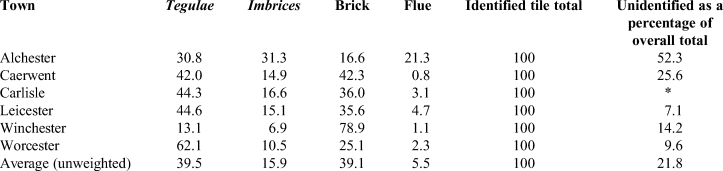
Table 3 gives the average fragment weights for each of the towns and the overall weights and fragment counts of the assemblages. The (unweighted) average tegula fragment weighed 0.18 kg, which, based on the typical weight of a complete tegula of 6.2 kg, indicates that the tegulae were broken on average into 34 pieces. However, if allowance is made for the proportion of unidentified material that must also, in part, have derived from tegulae (using the 39.5 per cent proportion of tegulae from table 2), then the average weight falls to 0.12 kg and the number of pieces the average tegula has been broken into rises to 52. A similar analysis for the imbrices suggests that they were broken into only 21 pieces. However, fabrics are not all equally susceptible to fracture, so some will, on average, break into more pieces and other fabrics into fewer.
AVERAGE FRAGMENT WEIGHT IN KG (*unidentified material was not recorded)

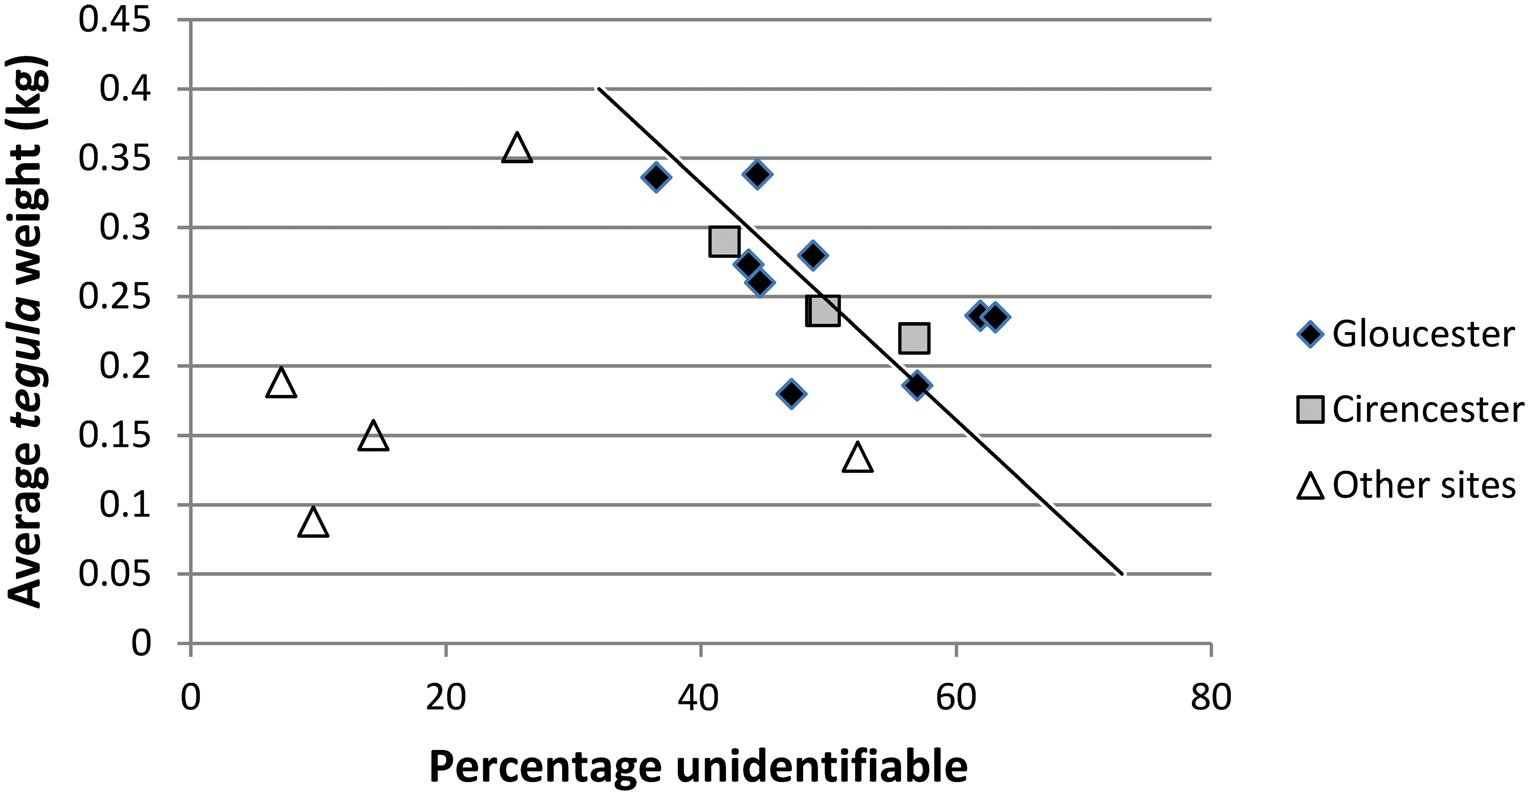
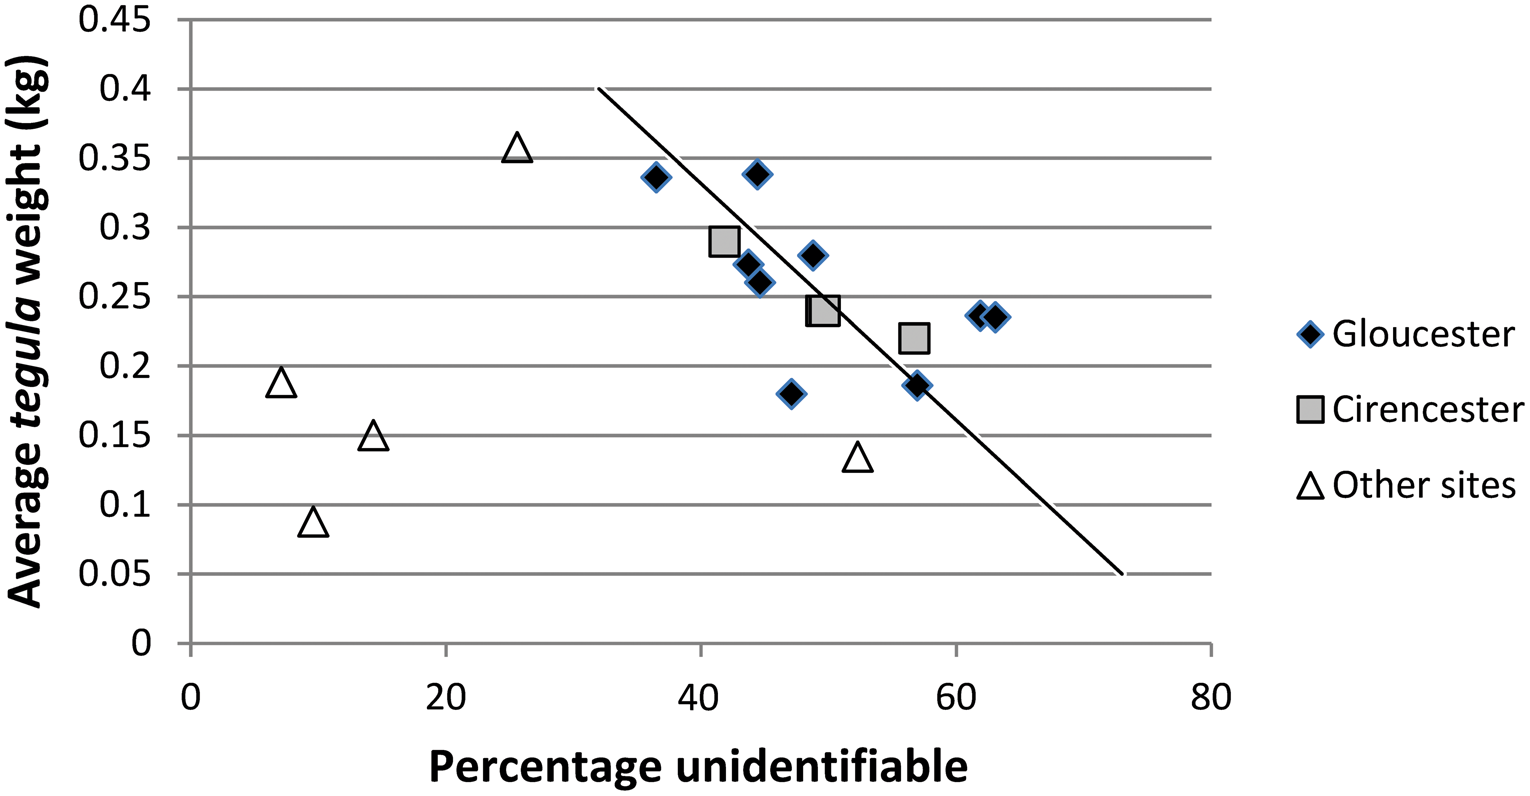
As might be expected, there is considerable variation in the average fragment weight between the towns, just as there is in the proportions of the assemblages that are unidentifiable (shown in table 2). In principle, we would expect that, as an assemblage becomes more fragmented, the average sherd weight will fall and the proportion of material that is so fragmented that it is unidentifiable will rise; but this is shown not to be the case. For example, Leicester has the lowest proportion of unidentifiable material (7.1 per cent), but its tegula fragment weight (0.19 kg) is only slightly above average; in contrast, Caerwent has a much higher unidentified proportion, at 25.6 per cent, but also the highest tegula fragment weight at 0.36 kg.
TOWARDS A RECOMMENDED METHODOLOGY
There will always be a proportion of an assemblage that is so degraded or fragmented that it is impossible to allocate the pieces to any component type, but it is clear that practitioners draw the line on doubtful pieces at different points, some striving to minimise the unidentified category and others requiring greater proof before allocating a doubtful piece to one of the standard forms. Some of the apparent anomalies noted in the previous section are most likely to result from such different approaches to recording and, in particular, the varying treatment of nondescript flat pieces of tile. Most imbrices are not semicircular in cross section, but instead are closer to two flat sides with only the top of the imbrex being rounded, with the result that fragments of their flattish sides can be almost indistinguishable from fragments of tegulae. Moreover, most flue-tiles are not scored/combed on at least two of their four faces, so that unscored fragments can also appear similar to tegulae. Therefore any system that assumes that all flat pieces less than, say, 30 mm thick are tegulae and everything greater than that is brick is likely to overstate significantly the proportion of tegulae present.
The choice of the appropriate methodology raises the question of the purpose of quantification. This must surely be to describe accurately the assemblage in a way that allows it to be compared with those from other sites, to indicate what sort of structure(s) it might represent and to suggest the process that might have brought the assemblage to its present state. To convert this into more concrete terms, in the case of tegulae and imbrices we would want the methodology, inter alia, to measure the true relative proportions of tegulae and imbrices in order to establish if they are representative of a roof collapse or, if there is an imbalance, if they suggest that either there has been differential robbing of the assemblage or material has been relocated from elsewhere. Any system that, for example, identifies 60 per cent of the tegulae but only 40 per cent of the imbrices would be misleading, so, to do this effectively, we need a quantification methodology that does not favour the recording of tegulae over imbrices, or vice versa, and ideally a system that has some inherent self-checking mechanism.
The approach put forward in this paper starts from the observation that the weakest point in an imbrex is the apex around which the tile is bent. If lying upright on the ground, the apex of the imbrex forms an unsupported arch that will be the first point of failure when a load is placed on top of it. Likewise if it is lying inverted. If lying on its side, then one of the flanks will be pointing upwards and again unsupported. When the imbrex breaks, the first break is typically at the apex but in such a way that some portion of the curvature of the apex is attached to both resulting fragments of the imbrex. This situation is mirrored for tegulae, where the weakest point is the flat base of the tile, which typically will break first, leaving two pieces each containing a portion of flange (one from the left-hand side and one from the right). In effect, just as the tegula has two flanges, because of the way the apex of the imbrex breaks, the imbrex also has two curved sections, one linked with the left-hand flank and the other with the right. Of course, all of these fragments will be broken many further times as the material is churned, but, as the tegulae and imbrices on a roof should each be of the same length, by simply collecting the imbrex pieces showing some curvature and the tegula pieces showing some flange, then their relative proportions should be representative of the original proportion of the complete tegulae and imbrices that formed the parent assemblage. This may seem extremely hypothetical, but the empirical evidence, as will be shown in the next section, demonstrates that this system works surprisingly well in practice.
Gerald Brodribb calculated average dimensions for all the main CBM types from his survey of Romano-British CBM and measured the average thickness of the most common brick types to be in the range of 41–6 mm.Footnote 3 As this range is the average, many examples of these bricks will have been thinner (less than 40 mm) and others thicker (greater than 50 mm). These thicknesses can be compared with those of the flat bases of tegulae (where the flange is still connected to the base) recorded by the author during a survey of 2,600 such Romano-British tegula fragments collected from some 150 sites. The average thickness of the base is 23 mm and just 5 per cent of the tegulae assessed in the survey are 30 mm or more thick. However for 25 of the site assemblages more than 10 per cent of the tegulae have a thickness of 30 mm, of which 14 (mainly military) contain more than 20 per cent with a thickness equal to 30 mm or more. Thus, while brick can normally be defined safely as flat sherds with a thickness of 30 mm or more, 40 mm should be adopted as the threshold on military sites or ones where there is evidence from flanged sherds to suggest that the tegulae are generally thicker than normal.
The resulting quantification methodology recommended in this paper (which is very close to the practice adopted at Alchester) uses the following rules. Only fragments with evidence of a flange should be recorded as tegula pieces and only fragments with evidence of curvature should be recorded as imbrex pieces. Flat pieces 30 mm or more thick should be recorded as brick, except on military sites (and other sites where there is evidence for the production of thicker tegulae) where flat pieces 40 mm or more thick should be recorded as brick. All fragments with scoring or combing should be recorded as flue-tile. Everything else should be recorded as unidentified, unless it can be recognised as a special form. Some specialists prefer to record the unrecognisable flat tile separately from the mass of sherds too small to be identifiable; this is acceptable, provided they are allocated to the unidentifiable class for the purposes of analysis. Of course, all the other elements of recording as recommended in the ACBMG standard (fabrics, identification of special forms, nail holes, mortar etc) should continue unaffected. The division into forms should be the same independent of whether the tiles have previously been sorted into fabrics/phases or are unsorted.
This approach of just recording tegula flanges, curved imbrices and scored flue-tiles should result in around half the weight of each of the tegulae, imbrices and flue-tiles being identified, leaving their mainly flat residue classified as unidentified. This contrasts with the treatment of brick where the thickness threshold is likely to exclude only a minority of the tile, leading to a relative over-representation of brick. In an ideal world, all the tile would be identified but, as that is not possible, the important thing is to have a system where the proportion of each CBM type recorded remains constant and, as far as possible, is the same for each CBM type so that the ratios of, for example, tegulae to imbrices are meaningful (albeit brick will perforce be overstated). For this reason, while it will be tempting for experts to supplement the methodology suggested above by identifying additional fragments based on their own knowledge, for example flat pieces with nail holes as tegulae, this should be avoided because it will undermine the relative proportions of each component type that are recorded, thereby making comparison with other sites and other investigators (some of whom will be non-specialists) more difficult.
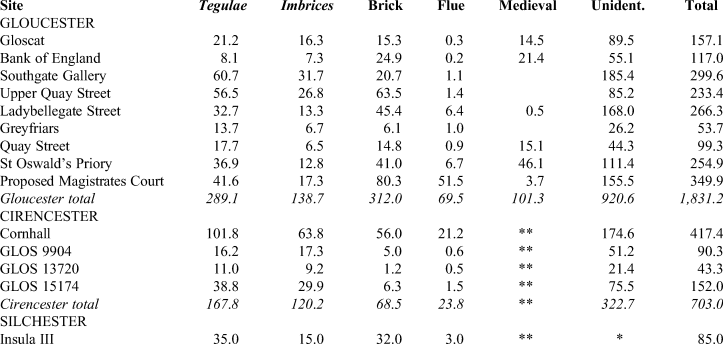
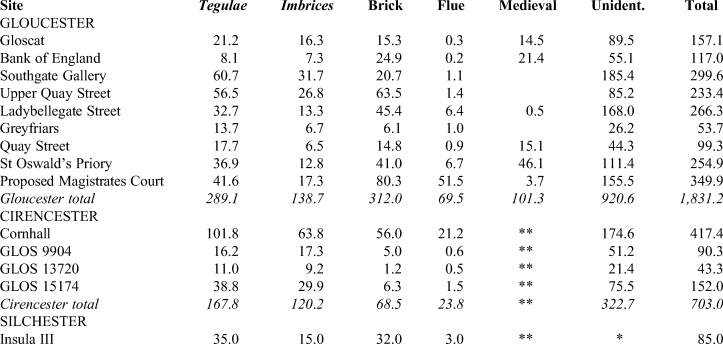
The estimate that this methodology should record roughly half the weight of the tegulae present can be tested against the number of tegula lower cutaways found within the assemblage. table 4, using the proposed methodology, shows that a total weight of tegulae of 289 kg was recovered from nine Gloucester sites. This is equivalent to 47 complete tegulae or 94 partial tegulae if the methodology captures only half the material in each tile. The Gloucester assemblages contain 182 tegula lower cutaways, which equate to 91 complete tegulae. This is very close to the 94 partial tegulae and confirms that the methodology captures roughly half the weight of each tegula. However, tegula lower cutaways are very distinctive sherds and much more easily identified than the corners of imbrices. Moreover, because the cutaway weakens the flange in that area, the cutaway is likely to be one of the earlier fragments of the tile to break off from the main body, but its small compact shape may then protect it from further breakage. This does not appear to be the case with the corners of imbrices or, particularly, bricks, which may be more vulnerable to being chipped and destroyed rather than being knocked off intact. This is certainly the best explanation for the Winchester assemblage where 543 kg of brick, equivalent to very roughly 87 pedales or 195 bessales, produced just 154 recognisable corners,Footnote 4 amounting to under half the number that would have been expected if the assemblage was composed exclusively of pedales and less than a quarter of the number if the assemblage was comprised of the more common bessales.
WEIGHTS OF MATERIAL ANALYSED IN KG
(*unidentified material was not recorded; **minimal medieval inclusions were not quantified separately)
It is important that the assemblage should be complete; if a preliminary disposal of material has already occurred then this will inevitably bias the results. Many urban sites contain material from other periods, particularly medieval fragments, which should not be included in the Roman analysis. Most medieval forms differ from their Roman counterparts, but the bricks and flat tile are not always easily distinguishable, although there is a tendency for medieval examples to be better made, smoother, flatter and harder fired (pieces tinkle when knocked together, while Roman material normally gives a duller ring).
THE RECOMMENDED METHODOLOGY IN PRACTICE
The recommended methodology has been tested in Gloucester, Cirencester and Silchester: a colonia and two civitas capitals lying along Ermin Street. Gloucester and Cirencester have been subjected to fairly continuous post-Roman development, particularly in the medieval period and, in the case of Gloucester, extensively in the 1960/70s; all the sites explored within these towns reflect this history. In contrast, the Roman town of Silchester has lain under pasture and has not been developed. Nine sites spread throughout the town, including the quayside and immediately extra-mural areas, were chosen for Gloucester. Four sites were identified in Cirencester, but three of these were closely situated and so the evidence is not fully representative of the town as a whole. At Silchester, only the Victorian backfill of Insula III has been recorded using the proposed methodology (but the weight of the unidentified material was not recorded nor were the brick and flue-tiles counted). All of the recording was conducted by the author; most of the data are contained in reports held by Cotswold Archaeology,Footnote 5 the Museum of Gloucester and Gloucester County Council.Footnote 6 The assemblages are recorded by weight in table 4; the majority weighed in excess of 100 kg, with the smallest being 43 kg.
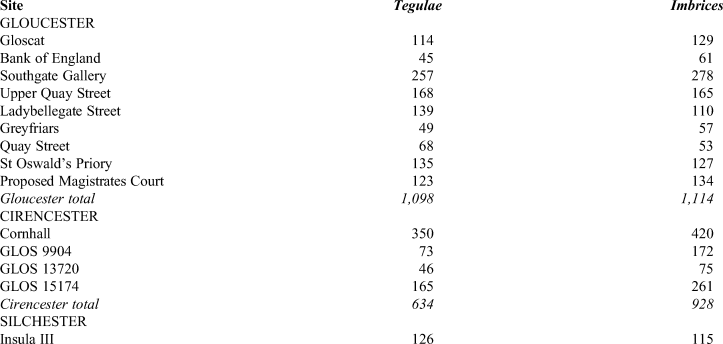
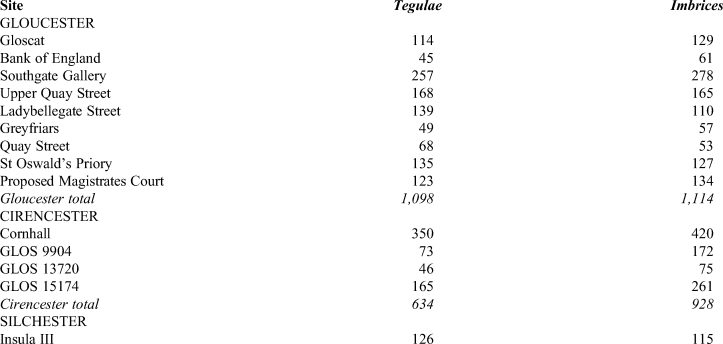
The first test of the methodology is to compare the number of tegula fragments recorded against the number of imbrex fragments; this is shown in table 5. In the previous section it is postulated that the ratio of tegula to imbrex fragments should mirror the proportions of the parent assemblage, which, across a whole town, should reflect the equal numbers of tegulae and imbrices that would originally have been on the roofs. This is exactly what the data show with respect to the Gloucester sites and Silchester. Indeed, there is a difference of just 16 fragments in totals of over 1,000 in the Gloucester aggregate figures. The Cirencester assemblages display significant differences, but, given the success of the methodology in Gloucester and Silchester, it seems likely that these variations reflect real rather than methodological differences; most probably the impact of preferential robbing of the flat tegulae from the three ‘GLOS’ sites. If we can assume that little of the recycled tile leaked out of the town, then the robbed tile should appear in other assemblages within the town and therefore, if we had a wider sample of Cirencester sites, we might expect off-setting surpluses of tegulae from other sites.
NUMBERS OF ROOF FRAGMENTS
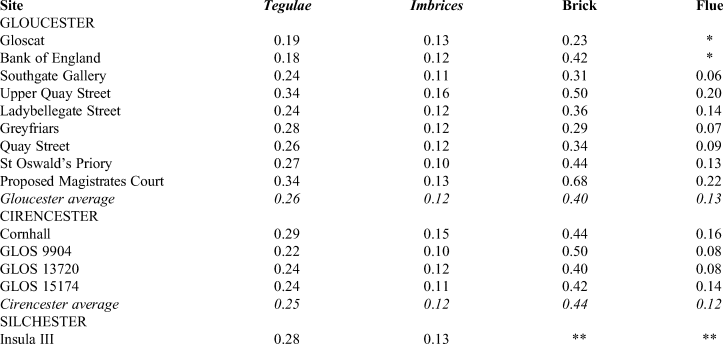
The average fragment weight is given in table 6 and it is immediately apparent how consistent these weights are between the towns and indeed across the sites within the towns. This suggests that, in contrast to table 3, the proposed methodology produces consistent results. It is also significant that the ratio of the average weight of a tegula fragment to that of an imbrex fragment, at 2.2:1, equates reasonably closely to the c. 2.4:1 ratio of the weights of complete tegulae and imbrices. Where the average weight of the tegulae is higher, as at Upper Quay Street, then the average weight of the imbrices moves in line, showing that the variation is simply a function of the degree of fragmentation. Importantly, the Cirencester average weights and the ratio of tegula to imbrex weights are consistent with Gloucester and Silchester, which reinforces the judgement that the deficit in the tegula fragment count at Cirencester is simply the result of preferential robbing. It is also notable that the average fragment size at Silchester, which suffered no later development, is only fractionally above the Gloucester and Cirencester averages.
AVERAGE FRAGMENT WEIGHT IN KG
(*Too few sherds for meaningful calculation; **brick and flue-tiles were not counted)
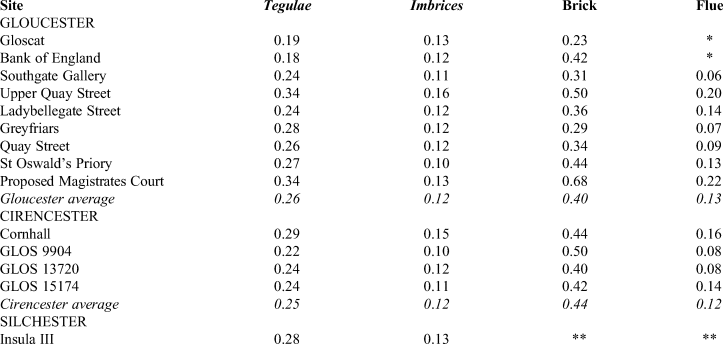
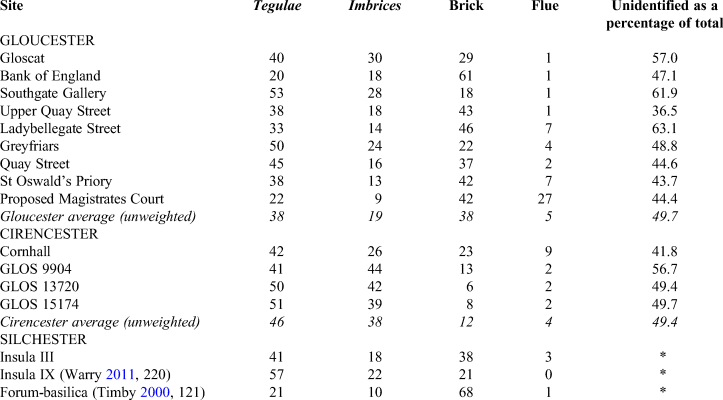
Table 7 gives the proportion by weight of the identifiable assemblage that each component type constitutes and also the proportion of the overall assemblage that could not be identified. Data have also been provided for comparative purposes from Silchester's Insula IX and the forum-basilica, which were recorded using slightly different methodology. As might be expected, there are significant differences in component proportions between the sites which reflect real differences in the assemblages. Overall the proportions of unidentified material from Gloucester and Cirencester were virtually identical, at roughly 50 per cent. Upper Quay Street, which has no medieval intrusions and seems the least disturbed site, has the lowest proportion of unidentified material, at 36 per cent, while the assemblages from Ladybellegate Street and Southgate Gallery (immediately outside the wall) appear to consist of dumped material and have the highest unidentified proportions.
ASSEMBLAGE COMPOSITIONS BY WEIGHT, EXPRESSED AS PERCENTAGES
(*unidentified material was not recorded)
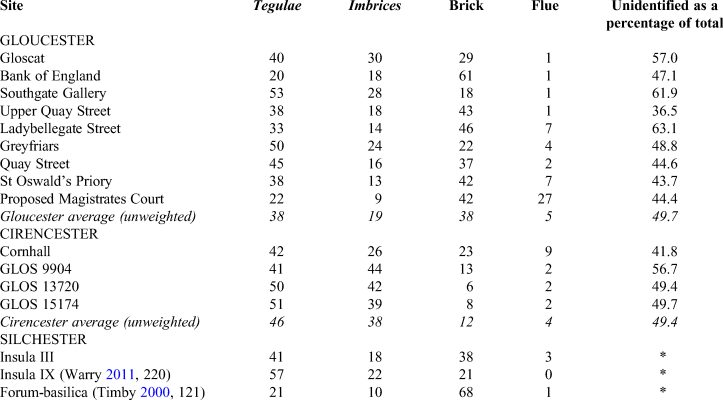
Fig. 1 explores the correlation between fragment weight (in this case for tegulae) and the proportion of unidentifiable material in the assemblage. As would be expected, as the assemblage becomes more fragmented, the sherd weight reduces and the proportion of unidentifiable material increases. An indicative trend line has been drawn for the Gloucester and Cirencester sites to emphasise the correlation. Alchester and Caerwent (identified as ‘other sites’) lie quite close to the trend line, but the remaining towns clearly demonstrate that different recording methodologies were used. Piece-count comparisons, average fragment weights and component ratios show how the methodology allows effective interpretation of the quantification data and highlights anomalies that need further investigation, but the fig. 1 graph is the best single demonstration of the effectiveness of the recommended methodology.
Correlation between tegula weight and unidentifiable proportion.
INTERPRETATION
Roof-tile comprises around half the assemblage from Gloucester, but rather more of the collections from Cirencester and the Silchester insulae. However, the quantity of roof-tile from the Silchester forum-basilica seems extremely low, even allowing for the probability that the methodology systematically produces an over-representation of brick, and lends support to Michael Fulford's observation that the Hadrianic basilica may never have been properly roofed.Footnote 7 An alternative possibility is that the roof was originally furnished with ceramic tiles which were carefully removed at some later point and replaced by stone tiles (which were also found).
Overall, the relative shares of tegulae and imbrices from Silchester and Gloucester are broadly consistent with the proportions that we would expect from complete roofs based on the 2.4:1 ratio of the average weight of a tegula to an imbrex. Within Gloucester, there are three sites (Gloscat, Bank of England and Southgate Gallery) which have a disproportionate amount of imbrices and very little flue-tile. All three of these sites lie wholly or partially outside the town walls. The assemblages all seem to represent redeposited material from inside the town, and it is likely that in this process many of the more useful flat tegulae were filtered out (which also had the effect of reducing the average tegula weight). At the other end of the scale, Quay Street and St Oswald's Priory appear to have too many tegulae. Quay Street may have been the recipient of robbed tegulae that were utilised, for example, as tile courses in its walls, while St Oswald's Priory is a kiln site,Footnote 8 and its assemblage is not representative of a roof but simply of the stock (probably mainly broken) held at the site when production ceased.
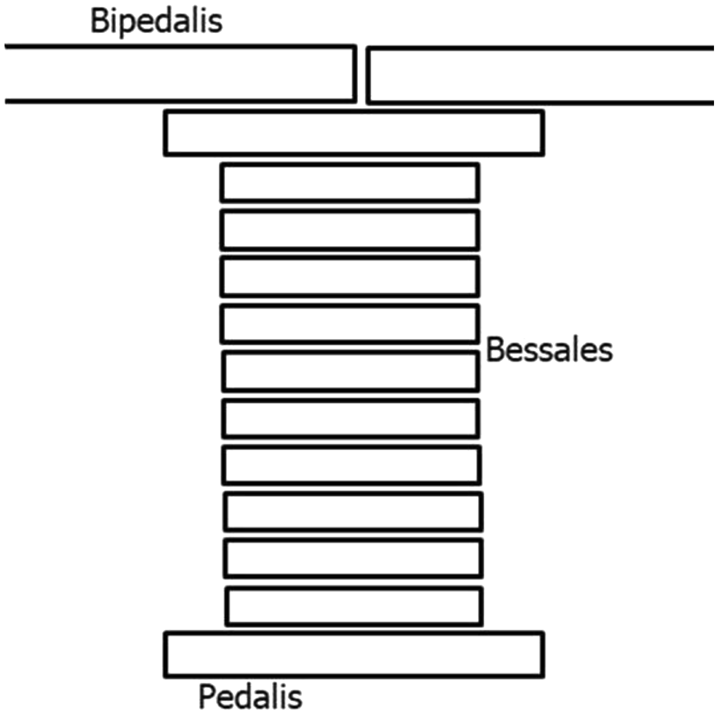
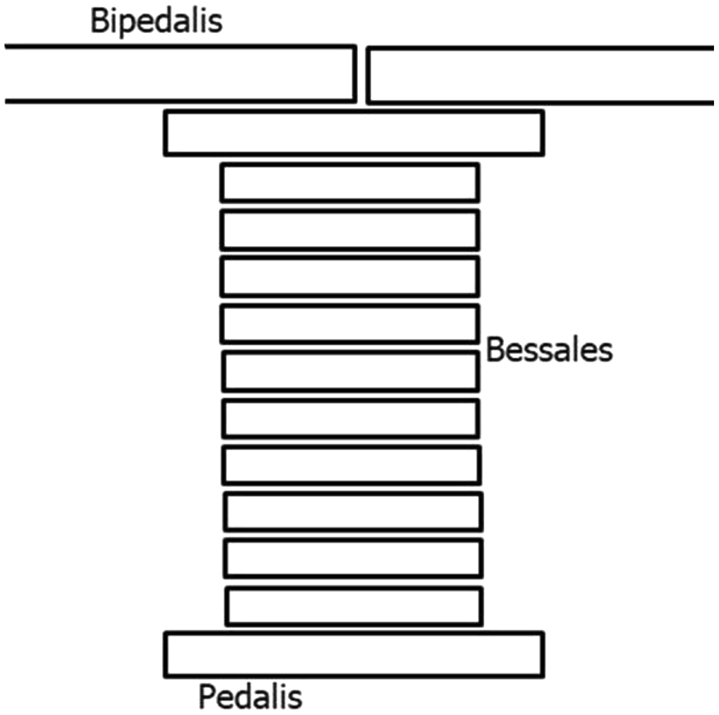
The brick within the assemblages will have derived primarily from tile courses within walls and from hypocaust floors and pilae. There is little evidence in Britain for the use of facing bricks or indeed solid brick walls. Paving such as opus spicatum is present but not in great quantity and is typically less than 30 mm thick. To assess how much brick we should expect to find, we can estimate the ratio of tegulae on a roof to a hypocaust below. Hypocaust pilae (see fig. 2) normally comprised a pedalis that formed the base of the stack followed by between eight and 12 bessales that were capped by a further pedalis. The pilae were then bridged by bipedales that were covered with mortar and opus signinum or possibly mosaic. Effectively, there was one pila per bipedalis. The bipedales were square, with each side measuring 2 Roman feetFootnote 9 in length (i.e. each one covered an area of 4 square Roman feet), and on average they were 60 mm thick.Footnote 10 The pedales and bessales were also square, with sides measuring 1 Roman foot and two-thirds of a Roman foot, respectively (i.e. their areas were 1 square Roman foot and 0.4 square Roman foot, respectively). A pila consisting of two pedales and ten bessales would therefore have amounted to 6 square Roman feet in area when laid flat, which is 1.5 times the area of the bipedalis that would have been mounted above. The average thickness of bessales and pedales is 44 mm,Footnote 11 so the combination of pila and bipedalis meant that each square foot of hypocaust floor was effectively composed of approximately 126 mm thickness of brick: 60 mm + (1.5 × 44 mm).
Hypocaust pila construction.
The tegulae on the roof were on average 23 mm thick, but if the flanges were flattened and smeared out across the rest of the tile then the thickness would increase to 29 mm.Footnote 12 The tegulae also overlapped each other on roofs by circa 100 mm,Footnote 13 which effectively added a further 32 per cent to the thickness (increasing it to 38 mm). Allowance should also be made for the pitch of the roof, which Vitruvius says should be 1 in 3Footnote 14 (consistent with evidence from collapsed gable ends of Romano-British buildings); this adds a further 6 per cent, making 41 mm thickness of tegulae when projected onto the floor of a building. Finally we need to make allowance for the thickness of the walls that were covered by the tegulae but not by the hypocaust. This would increase the tegula requirement by some 8 per cent based on the hypothetical building described in the next paragraph and yield a grand total of 44 mm equivalent thickness. In round terms, this suggests that, if every room in a building had hypocausts, then we should expect the brick to weigh very roughly three times as much as the tegulae (126 mm vs 44 mm). Alternatively, if only one in three rooms had a hypocaust, then the weight of the brick should broadly match the weight of the tegulae.
The above scenario ignores potential tile courses in the walls, so it is also worth estimating how significant these could be. If we postulate a building measuring 15 m by 30 m with walls 400 mm wide (equivalent to the average length of a lydion tile) and assume that each tile course is three tiles deep, then 964 lydions each 280 mmFootnote 15 wide would be required. The area of the building is 450 m2, which equates to the area of some 4,000 lydions (in effect four complete tile courses). As the average lydion is 41 mm thick, an individual tile course three tiles deep would equate to only 10 mm of tile if spread across the floor of the building. However, if the bulk of the houses in the town were stone-built and two storeys high with, say, four tile courses each, then the amount of brick in the tile courses would equate to the amount of tegulae on the roof.
This analysis is very much an ‘order-of-magnitude’-type calculation that incorporates many assumptions and approximations; nevertheless, the broad thrust of the conclusions should be correct. Thus, the fact that the proportion of brick measured in Gloucester is comparable to that of tegulae, but probably less once the relative over-recording of brick is taken into account, could imply that there were very few hypocausts (as is also supported by the general absence of flue-tile) and that most of the houses were stone-built with two storeys. Alternatively, but less likely, it might indicate that there were more hypocausts and fewer houses with tile courses.
The proportion of brick varies across the Gloucester sites, with Bank of England producing the highest figure at 61 per cent and Southgate Gallery the lowest at 18 per cent; both these sites lie immediately outside the wall and both appear to contain mainly redeposited material. There is far less brick (or far more roof-tile) in Cirencester, but these sites are not necessarily representative of the town as a whole. There are sharp differences in Silchester, with brick being over-represented at the forum-basilica as a consequence of the shortage of roof-tile (as previously discussed). Insula IX has very little brick, which is consistent with the relatively unsophisticated buildings without hypocausts within the insula and the fact that most of the brick that was found was used to create hearths. In contrast, Insula III, whose component profile closely matches that of Gloucester, was a more affluent area; this is reflected in the higher proportion of brick, although most of this is likely to derive from tile courses in the stone-built structures rather than hypocausts.
The distribution of flue-tile in Gloucester (shown in table 7) is quite telling. Disregarding the kiln at St Oswald's Priory, there are only three sites with more than 2 per cent of flue-tile. Principal amongst these is the Proposed Magistrates Court, which lies in the south-western corner of the town, where 27 per cent of the assemblage comprises flue-tile. This is followed by the nearby Ladybellegate Street and Greyfriars sites, with 7 per cent and 4 per cent respectively. This, coupled with other evidence, strongly suggests that the Proposed Magistrates Court was the site of the town bathsFootnote 16 and that the two neighbouring sites were probably affected by a later spread of flue-tile following the destruction of the baths. In Cirencester the Cornhall assemblage contains 9 per cent flue-tile; this hints strongly of baths, even though the site is some distance from the postulated location of the town baths. Very little flue-tile is present in the extensive areas examined at Silchester, however these were all some distance from the town baths, which were located at the southern end of the town.
RESIDUAL MATERIAL AND RECYCLING PROCESS
To estimate the proportion of CBM that typically remains from the original buildings, we can look at Insula IX at Silchester, where 1.8 tonnes of tegulae and imbrices were recovered from second-century and later contexts of Fulford's open-area excavation of about one half of the insula.Footnote 17 In Period 3, commencing c. a.d. 125–50, there were two substantial masonry buildings and three timber-framed buildings that could have been tiled with a combined surface area of c. 750 m2;Footnote 18 this would have required 8,250 tegulae and an equivalent number of imbrices.Footnote 19 Each tegula and imbrex pair would have weighed an average of 8.7 kg, generating a total weight of 72 tonnes. Thus, on these assumptions, around 2.5 per cent of the roof-tile remained on site. As many tegulae with the first-century cutaway formFootnote 20 were recovered from the insula, it is likely that some of the Period 2 buildings (c. a.d. 70–80 to c. a.d. 125–50) were also tiled. These buildings covered much the same area as the Period 3 buildings, and it is possible that a significant proportion of the CBM recovered from Period 3 and later contexts relates to Period 2 buildings. It is also possible that the Period 3 buildings were retiled later in their lives or that later building phases were also tiled, although this would have been limited by the switch to stone tiles during the third century. These factors would reduce the 2.5 per cent survival-rate figure calculated above. However, arguing in the opposite direction, some of the buildings may have been thatched, for which there was phytolith evidence. It is impossible to determine the correct survival-rate figure, but it probably lies in the 1–4 per cent range, more likely at the lower end of this range, especially in towns that, unlike Silchester, experienced post-Roman redevelopment.
In urban areas we should anticipate a regular process of demolition followed by site clearance prior to reconstruction. This would facilitate recycling of reusable materials as well as generating the churning and subsequent degradation of the unusable pieces. A dump of over one tonne of heterogeneous tegulae with few imbrices found in a single context at Silchester is good evidence for this sort of recycling,Footnote 21 although whether this was a CBM recycling centre, as have been identified on the fringes of Cirencester and Gloucester,Footnote 22 or simply a temporary stock is difficult to say. However, while it is evident that urban areas suffered considerable churning, this was not necessarily the case at villa sites. At the high-status villa of Brading on the Isle of Wight different forms of tegulae were closely associated with different excavations and thereby different areas of the site, showing that there was little movement of CBM around the site even though regular remodelling of the villa had occurred.Footnote 23
CONCLUSIONS
Despite 2 per cent or less of the original CBM of a site typically surviving to be excavated, the quantification results obtained from this remainder are surprisingly consistent. The Gloucester and Cirencester assemblage weights vary from 417 kg down to 43 kg, and all seem to have produced reasonable results. However some of the results from the Worcester assemblage, which weighed 44 kg, appear out of line, and this may be due to the small size of the collection. Manifestly, the larger the assemblage the more meaningful the results of quantification are likely to be, so it is probably desirable that assemblages should weigh at least 50 kg, and ideally 100 kg, if reliable results are to be achieved.
The Gloucester and Cirencester analyses have shown how the proposed methodology, when systematically applied, can generate useful insights into, inter alia, the identification of the probable locations of bath-houses, the nature of housing and the extent of robbing and recycling. The methodology is simple to apply and the inherent checks provide reassurance of its validity. Although all the examples have been based on urban sites (where comparability is easier to demonstrate), it works equally well on rural sites.Footnote 24 The methodology has also been adopted by amateur archaeological groups to good effect.Footnote 25
ACKNOWLEDGEMENT
I am most grateful to the referees for their helpful comments and advice.