I. INTRODUCTION
As a result of the utilization of TiO2 nanotubes in a variety of solar applications, an extensive body of literature over the past decade has addressed the use of electrochemical anodization in TiO2 nanotube production. The highly ordered architecture of vertically aligned nanotubes creates a large surface-to-area ratio that is ideally suited for optical and catalytic performance. These TiO2 nanotubes have shown outstanding photoelectrochemical propertiesReference Paulose, Mor, Varghese, Shankar and Grimes1–Reference Ruan, Paulose, Varghese and Grimes4 for applications including water photolysis for H2 production,Reference Paulose, Mor, Varghese, Shankar and Grimes1, Reference Ruan, Paulose, Varghese and Grimes4–Reference Paulose, Shankar, Yoriya, Prakasam, Varghese, Mor, Latempa, Fitzgerald and Grimes10 as potential photoelectrodes in dye-sensitized solar cells,Reference Rani, Roy, Paulose, Varghese, Mor, Kim, Yoriya, LaTempa and Grimes11–Reference Varghese, Paulose and Grimes15 and photocatalysisReference Ghicov and Schmuki12, Reference Albu, Ghicov, Macak, Hahn and Schmuki16, Reference Ranney, Mansfield, Sun and Schwank17 (the most promising being the photocatalytic conversion of the greenhouse gas, CO2, to hydrocarbon fuels).Reference Shankar, Basham, Allam, Varghese, Mor, Feng, Paulose, Seabold, Choi and Grimes18, Reference Varghese, Paulose, LaTempa and Grimes19 To maximize these properties, long debris-free nanotubes are desired. A 45-μm-thick nanotube array yields photoconversion efficiencies as high as 16.25%,Reference Paulose, Shankar, Yoriya, Prakasam, Varghese, Mor, Latempa, Fitzgerald and Grimes10 and 17.6-μm long nanotubes in dye-sensitized solar cells produce a power conversion efficiency of 6.9%.Reference Varghese, Paulose and Grimes15 As is apparent from the literature, the most effective route to producing long TiO2 nanotubes is electrochemical anodization. The two main media in which titanium is anodized are aqueous electrolyte solutionsReference Gong, Grimes, Varghese, Hu, Singh, Chen and Dickey20–Reference Bauer, Kleber and Schmuki31 and nonaqueous organic electrolyte solutions.Reference Paulose, Shankar, Yoriya, Prakasam, Varghese, Mor, Latempa, Fitzgerald and Grimes10–Reference Ghicov and Schmuki12, Reference Ruan, Paulose, Varghese, Mor and Grimes32–Reference Macak, Albu and Schmuki40
The anodization takes place in two steps: electrochemical oxidation of the titanium surface followed by chemical dissolution of the oxides that form.Reference Cai, Paulose, Varghese and Grimes21 The chemical dissolution requires an acidic solution environment and a source of F− anions. In their early work, Gong and coworkersReference Gong, Grimes, Varghese, Hu, Singh, Chen and Dickey20 used an aqueous electrolyte and hydrogen fluoride (HF) to achieve these anodization conditions. They found that the tube length (250 nm) was largely independent of anodization time and that higher voltages were needed as HF concentration was diluted. The Schmuki groupReference Beranek, Hildebrand and Schmuki23, Reference Tsuchiya, Macak, Ghicov, Taveira and Schmuki26, Reference Ghicov, Tsuchiya, Macak and Schmuki30, Reference Bauer, Kleber and Schmuki31 discovered that longer tubes (500 nm) with tunable pore sizes could be produced by adjusting pH (with acids such as H2SO4 and H3PO4) and F− concentration, thereby adjusting the rate of dissolution. Dickey et al.41 reported nanotubes of lengths up to 400 nm anodized in aqueous HF electrolytes at an applied voltage of 20 V. Later workReference Cai, Paulose, Varghese and Grimes21, Reference Shankar, Mor, Fitzgerald and Grimes22, Reference Macak, Sirotna and Schmuki24–Reference Macak, Tsuchiya and Schmuki27, Reference Taveira, Macak, Sirotna, Dick and Schmuki29–Reference Bauer, Kleber and Schmuki31, Reference Macak and Schmuki39 replaced the hazardous HF with more environmentally benign fluoride salts. These studies all show that lowering pH increases the chemical dissolution rate. The optimal pH range was found to be 3–5 (producing tubes up to 4.4 μm long at a pH of 4.5).Reference Cai, Paulose, Varghese and Grimes21 By raising the pH, thereby decreasing dissolution rate, nanotube length increased with increasing anodization time. The pH of the electrolyte solution plays a role in determining nanotube length. However, all physical aspects (morphology, density, and pore diameter) were greatly dependent on anodic potential—current, voltage, and sweep rate (rate of increasing voltage to target anodization voltage). Tube length and pore size were both found to increase with increasing voltage. All nanotubes over 1 μm had pore diameters ≥100 nm. Although anodized titanium oxide (ATO) nanotube lengths of 5 μm can be formed in aqueous electrolyte solutions,Reference Paulose, Varghese, Shankar, Mor, Grimes, Heben, Robertson, Stumpf and Vogt42 much longer nanotube lengths can be obtained in organic electrolytes. The nanotubes anodized in organic electrolytes can be grown longer without increasing pore size and maintain smooth uniform tube architectures.
Not only did Ruan and coworkersReference Ruan, Paulose, Varghese, Mor and Grimes32 show a time dependence of nanotube length when anodizing in ethanol electrolyte solution, they were also able to produce long nanotubes (2.3 μm) with a smaller pore size (60 nm). Macak et al.Reference Macak, Tsuchiya, Taveira, Aldabergerova and Schmuki36 reported growing long nanotubes (7 μm) with an average pore size of only 40 nm when the titanium foil was anodized in glycerol for 13 h. They later showedReference Macak and Schmuki39 that long, smooth nanotubes can be grown in viscous ethylene glycol and glycerol electrolyte solutions. They also achieved a closely packed, hexagonally ordered array of nanotubes when anodization took place in an ethylene glycol/ammonium fluoride (NH4F) electrolyte and using high-purity (99.99%) titanium foils. Researchers in Grimes’s group were able to grow the longest TiO2 nanotubes. In 2006, they grew nanotube arrays that were 134 μm long in ethylene glycol/NH4F.Reference Paulose, Shankar, Yoriya, Prakasam, Varghese, Mor, Latempa, Fitzgerald and Grimes10 They increased that length to 360 μm a year later by adding a small amount of water to the NH4F ethylene glycol electrolyte and anodizing the titanium foil for nearly 100 h.Reference Prakasam, Shankar, Paulose, Varghese and Grimes34 These nanotubes were highly ordered and closely packed hexagonally. Grimes et al.35 later reported that by using a 0.6 wt%NH4F in 3.5% H2O ethylene glycol electrolyte, they were able to completely anodize the titanium foil, creating a TiO2 nanotube array 1 mm in length.
Although there has been a significant amount of work on the anodization of titanium to produce highly ordered arrays of TiO2 nanotubes, more on-going studies are still being reported.Reference Gong, Lai and Lin9, Reference Rani, Roy, Paulose, Varghese, Mor, Kim, Yoriya, LaTempa and Grimes11, Reference Ranney, Mansfield, Sun and Schwank17 As new anodization methods develop the architecture, the properties of the nanotubes change as well. Herein we provide a detailed analysis and comparison of the anodization of titanium foils in varying electrolyte solutions (aqueous, ethylene glycol, and glycerol), at various temperatures, and for various times to produce nanotubes with engineered architectures (thereby affecting nanotube properties). We also demonstrate the possibility of producing and harvesting single discrete TiO2 nanotubes by anodization in glycerol for 6 h at an elevated anodization temperature (52 °C).
II. EXPERIMENTAL
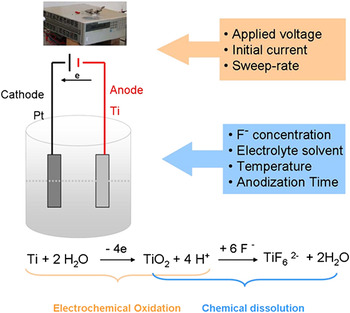
A basic anodization procedure was used in all experiments. The experimental setup and scheme are detailed in Fig. 1. Titanium foil (99.99%, 0.127 mm thick; Alfa Aesar,West Deptford, NJ) cut into 1.0 × 2.0-cm2 rectangles served as the anode with a 1 × 1-inches platinum plate serving as the cathode. The electrodes were cleaned ultrasonically for 1 min each in chloroform, acetone, isopropanol, and deionized (DI) water, sequentially. The electrodes were connected to the power supply at an interspacing of 2.0 cm. A teflon container was then filled with 50 mL of electrolyte solution, and half of the electrodes were immersed. Anodization was done in environments of both aqueous and nonaqueous electrolyte solutions. Aqueous electrolyte contained 1M ammonium sulfate (99.9%; Fischer Scientific, Pittsburgh, PA) and 0.5 wt% NH4F (99.0%; J.T. Baker, Deventer, Netherlands) [i.e., 132.05 g (NH4)2SO4 + 5.25 g NH4F in 1 L DI H2O], with pH typically adjusted to 4.83. Nonaqueous anodization experiments were performed in one of the following organic solutions: 0.5 wt% NH4F (2.89 g NH4F) 572.9 g or 0.25 wt% NH4F (1.45 g NH4F)in glycerol (572.9 g) (anhydrous 99.9%; Fisher Scientific) or 0.25 wt% NH4F in ethylene glycol (anhydrous 99%; Fisher Scientific) (0.7 g NH4F in 279.9 g ethylene glycol). Organic electrolytes were made without adding any water, and solutions were stirred over two to three days until all NH4F dissolved. All reagents were used as received, with no attempt to remove any ambient water from the organic solvents. The DC power supply used in the current-limiting anodization experiments was either a Hewlett Packard 6615A 0-60V/0-9A or an HP 6653A 0-35V/0-15A model. Unless otherwise noted, voltage and current were set to 20 V and 0.02 A, respectively; anodization was run at varying temperatures (room temperature = 24.5 °C) for varying lengths of anodization time. After anodization the titanium foils were rinsed with DI water and cleaned ultrasonically for 1 min to remove surface deposits. Samples were then left to dry in air. Microscopic images of sample surfaces were obtained using either a Hitachi S4700 scanning electron microscope (SEM, Hitachi, Pleasanton, CA) or a Zeiss Merlin field emission SEM (Carl Zeiss International, Berlin, Germany).
Experimental setup and scheme.

III. RESULTS AND DISCUSSION
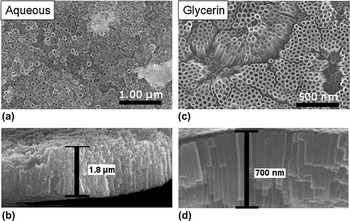
When anodized at applied voltages of 20 or 25 V for 6 h at room temperature and initial current of 0.02 A (standard conditions are 20 V, at 0.02 A, at room temperature), the resultant ATO nanotubes obtained in aqueous 0.5 wt%NH4F electrolyte solutions had thicker nanotube walls and relatively thicker nanotube array films than ATO nanotubes formed in nonaqueous glycerol solutions under identical conditions (Fig. 2). However, anodization in glycerol electrolyte solution produced nanotubes that had a more homogeneous nanotube array with narrow distribution of nanotube pore diameter and nanotube wall thickness, and much less bridging or connecting structures between nanotubes. Nanotube pore diameters anodized from aqueous electrolyte ranged from 18 to 75 nm; in glycerol the pore diameters were within 28–52 nm. The nanotube wall thickness showed a similar pattern, with nanotubes anodized in aqueous electrolyte ranging from 8 to 29 nm, and 3 to 16 nm in glycerol electrolyte. Anodization in glycerol led to an overall less damaged ATO nanotube structure and smoother, more uniform tube walls.
Scanning electron microscope (SEM) images of anodized titanium oxide (ATO) nanotubes anodized in 0.5 wt%NH4F electrolytes at an applied voltage of 20 V for 6 h at room temperature. Images (a, b) (surface and cross section) are of ATO nanotubes formed in aqueous electrolyte; images (c, d) in glycerol electrolyte.

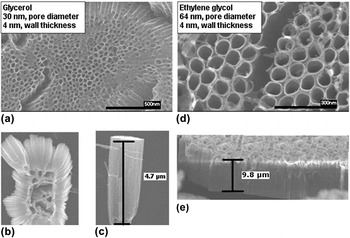
For the ATO nanotubes anodized in nonaqueous glycerol or ethylene glycol (0.25 wt% NH4F) electrolyte for 24 h at room temperature, applied voltage of 20 V, and initial current of 0.001A, the ethylene glycol produced longer nanotubes with larger pore diameters than those produced from glycerol (Fig. 3). The ethylene glycol is less viscous than the glycerol electrolyte, which led to slightly higher dissolution rates inside the tubes and created larger pores and longer tubes. The nanotube wall thickness was not affected by electrolyte as both electrolytes, glycerol and ethylene glycol, produced nanotubes with a wall thickness (near the top surface) of ∼4 nm as seen in SEM images. In both cases, SEM images revealed a fiber-like oxide precipitate on the nanotube array surface.
SEM images of ATO nanotubes anodized in organic electrolytes for 24 h at room temperature, initial current of 0.001A. Images (a)–(c) are nanotubes anodized in glycerol electrolyte; images (d, e) were anodized in ethylene glycol.

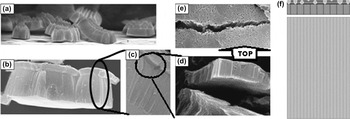
ATO nanotubes of a three-layer architecture (Fig. 4) were produced in glycerol electrolyte, anodized for 24 h at room temperature at an initial current of 0.001 A. The sweep rate, the rate of voltage increase from zero to target voltage, was manually controlled from 0 to 25 V at a step increase of 3 V per step in 36.41 s. The bottom layer was the nanotube array, with thickness ranging from 2 to 5 μm; the middle layer was another shorter nanotube array, with larger pore sizes and array thickness ranging from 0.45 to 0.75 μm; and the top was a thin porous oxide layer [Fig. 4(e)]. As observed in SEM analysis, the top and middle layers were intimately connected. However, the attached top and middle layers were easily removed (detached) from the bottom layer [Fig. 4(d)]. This layered phenomenon is similar to that observed by Schmuki and coworkers.Reference Taveira, Macak, Sirotna, Dick and Schmuki29
(a)–(e) SEM images and (f) schematic of three-layer nanotube architecture of ATO nanotubes anodized in glycerol electrolyte 24 h at room temperature, initial current of 0.001 A with manually controlled sweep rate of 3 V per step in 36.41 s. (a) The bottom layer of ATO nanotubes, (b) overall three-layer architecture, (c) close-up view of the three-layer architecture, (d) detachment of the top and middle layer from the bottom layer, (e) surface view of the top layer, (f) schematic of three-layer architecture.

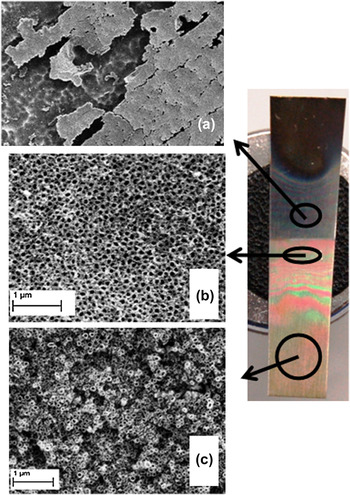
Under SEM analysis it was observed that the architecture of the ATO nanotubes was dependent on their location on the titanium foil relative to the air–electrolyte solution interface. Different ATO nanotube architectures were observed above, at, and below this interface. The location effect was observed in samples anodized at various times, temperatures, and electrolyte solutions (aqueous and nonaqueous). The architectures at different locations on the titanium foil showed a dependence on time and the type of electrolyte solution.
In samples anodized in an aqueous electrolyte solution under standard conditions, the ATO nanotube array located slightly above the electrolyte–air interface (aqueous electrolyte climbed up along the foil due to capillary effects) was covered by an oxide precipitate [Fig. 5(a)]. The architecture at the interface displayed a densely packed and uniform ATO nanotube array [Fig. 5(b)]. A similar architecture was seen at the interface location regardless of anodization time. The architecture of nanotubes completely submerged in electrolyte was greatly affected by anodization time. With shorter anodization times (3 h) the architecture of the completely submerged ATO nanotube array was uniform, but the nanotubes were not packed as densely as those at the interface. The submerged nanotubes on a titanium foil anodized for 6 h were loosely packed and nonuniform [Fig. 5(c)]. With longer anodization times (24 h), the architecture of the completely submerged ATO nanotube array was disordered and had a porous structure.
Titanium foil anodized in aqueous electrolyte under standard conditions for 6 h; SEM images of the resultant ATO nanotube arrays (a) above, (b) at, and (c) below the air–electrolyte interface.

The location effect was also observed in samples anodized in aqueous electrolyte for 24 h at 5 °C. A cross-sectional view of the ATO nanotube array at the electrolyte–air interface indicates densely packed uniform nanotubes, whereas a cross-sectional view of the submerged ATO nanotube array displays a nonuniform porous structure.
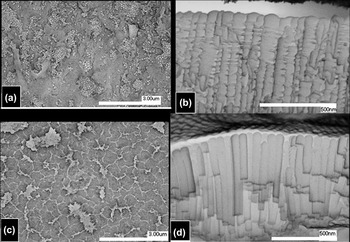
SEM analysis of a titanium foil anodized in glycerol electrolyte for 6 h at room temperature showed similarly location-dependent ATO nanotube array architectures (Fig. 6).
SEM images of ATO nanotube array anodized in glycerol electrolyte for 6 h at room temperature. (a) Straight-on view and (b) cross-sectional view of array at interface; (c) straight-on view and (d) cross-sectional view of fully submerged ATO nanotube array.

The ATO nanotubes at the electrolyte–air interface were covered by an oxide [Fig. 6(a)] (as seen in aqueous electrolyte) and were also ridged [Fig. 6(b)]. Researchers explain that this ridge or “ripple” feature arises from current oscillations.Reference Macak, Tsuchiya, Taveira, Aldabergerova and Schmuki36, Reference Cao, Li, Wang, Song and Sun43 However [as seen in Figs. 6(c) and 6(d)], smooth nanotubes (from the area of titanium foil submerged in electrolyte) are present on the same titanium foil as the rippled nanotubes. ATO nanotube arrays anodized in glycerol electrolyte for 6 h at 14 °C showed a similar location effect, with ridged nanotubes at the electrolyte–air interface and smooth nanotubes on the titanium foil submerged in the glycerol electrolyte. It is possible that variations in concentration and interaction with O2 from the air at the surface of the glycerol electrolyte gave rise to varied diffusion rates so, consequently, ridged nanotubes were observed only at the interface and nowhere else. No current oscillation experiments were preformed in these studies; however, it is clear that oxygen from the air does play a role in the formation of ridged nanotubes. The concentration of O2 would be greater at the surface of the electrolyte due to diffusion from air. This higher concentration of O2 would affect nanotube growth.
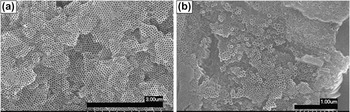
Stirring the electrolyte solution during anodization did not eliminate the location effect. Stirring also produced a less homogeneous surface architecture throughout the entire ATO nanotube array. However, the nanotubes produced while stirring the electrolyte during anodization were significantly longer with average lengths of 1.24 μm compared to 725 nm without stirring (anodized in glycerol electrolyte for 6 h at room temperature). Figure 7 displays this surface nonuniformity; a closely packed, highly hexagonally ordered nanotube array [Fig. 7(a)] and a multioriented nanotube array [Fig. 7(b)] are both present on the same titanium foil. The two SEM images are of areas that were in close proximity to each other on the anodized titanium foil. In the case of no stirring, although there is a location effect, the morphology of the overall nanotube array was relatively uniform in the vicinity of a certain area.
SEM images of ATO nanotube array produced by stirring of the electrolyte while anodizing in glycerol for 6 h at room temperature. (a) Closely packed, highly hexagonally ordered nanotube array and (b) multioriented nanotube array.

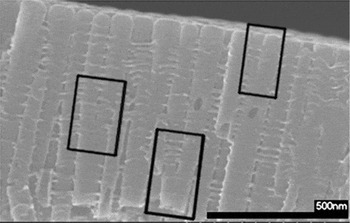
Another architectural feature formed due to stirring of the electrolyte during anodization was converging nanotubes (Fig. 8). As one nanotube grew during anodization while stirring the electrolyte, it diverged into two separate tubes.
SEM cross-sectional view of ATO film formed by anodization in glycerol electrolyte for 6 h at room temperature while stirring electrolyte. The converging nanotubes are outlined.

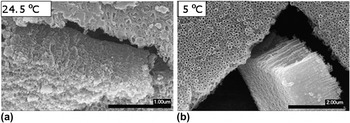
As stated above, temperature can have major effects on tube length and morphology. In aqueous electrolyte lower temperatures produced less structurally damaged (i.e., more homogeneous) ATO nanotubes (Fig. 9). This was due to the faster rates of dissolution (R d) at higher temperatures, which led to faster damage from F− on ATO nanotube structure. Nanotubes formed during low temperature anodization were twice as long as the nanotubes formed at 24.5 °C (average lengths equal to ∼1500 nm versus ∼750 nm) when anodized for 6 h. When anodization time was increased to 24 h, the nanotubes anodized at 5 °C were only 1 μm long.
SEM images of ATO nanotubes anodized in aqueous electrolyte for 6 h at (a) 24.5 °C and (b) 5 °C (low temperature).

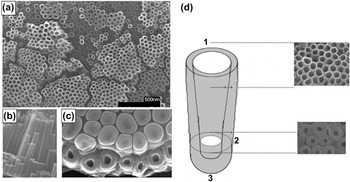
ATO nanotube arrays anodized under standard conditions for 6 h in glycerol solution at room temperature produced conical-shaped nanotubes. These nanotubes had small pore diameters (average = 19.8 nm) and thick tube walls (average = 16.6 nm) near the end of the nanotube closest to the titanium foil and had larger pore diameters (average = 37.9 nm) and thinner tube walls (average = 7.8 nm) near the top end (Fig. 10). Some of these nanotubes were ridged as well [Fig. 6(b)].
SEM images of ATO nanotubes anodized for 6 h in glycerol at room temperature showing the conical architecture of nanotubes. (a) Top view of ATO nanotube array; (b) cross-sectional view of nanotubes; (c) bottom view of nanotubes (some nanotube bottoms, TiO2 barrier layer, broken off during removal of nanotube array from titanium foil); (d) schematic of observed nanotube architecture: (1) wide pore opening near top of nanotube, (2) narrow pore opening near bottom of nanotube, (3) TiO2 barrier layer (nanotube bottom).

In the ATO nanotube arrays anodized in glycerol electrolyte for 6 h at 14 °C, patches of a porous oxide layer covered the nanotube array surface. This was due to the slower rate of chemical dissolution (R diss) of TiO2. The lower temperature increased viscosity, thereby decreasing R diss.Reference Macak and Schmuki39 The formation of a self-organized ATO nanotube array involves the formation of a porous oxide layer in the first stage, which will be dissolved given sufficient reaction time. The length of the ATO nanotubes formed at 14 °C (570 nm) was 150 nm shorter than those formed at room temperature (720 nm).
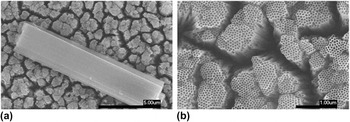
ATO nanotubes produced from the anodization of titanium foil in glycerol for 6 h at 52 °C had an average pore diameter of 44.3 nm and an average wall thickness of 9.3 nm. The pore diameters and wall thicknesses were just slightly wider (6.4 nm) and thicker (1.5 nm), respectively, than those of ATO nanotubes formed at room temperature. ATO nanotube length, on the other hand, was significantly increased to 12.5 μm by anodizing at a higher temperature. That is over 17 times longer than the tubes grown at room temperature. The ATO nanotubes anodized at 52 °C were homogenous and straight with very smooth tube walls (Fig. 11). The nanotubes were not densely packed but rather were clusters of packed tubes spaced inhomogeneously. In other words, in this condition, individual nanotubes could be separated from each other because they were loosely bound together, perhaps offering an opportunity to harvest freely dispersed nanotubes or single nanotubes.
SEM images of ATO nanotube arrays anodized for 6 h in glycerol solution at 52 °C. In these images the tubes are located ∼5 mm from the titanium foil bottom. (a) A cluster of nanotubes on top of the nanotube array. (b) The top of the nanotube array at higher magnification.

Anodization in organic electrolyte (glycerol) at higher temperatures increases the growth rate of nanotubes.Reference Rani, Roy, Paulose, Varghese, Mor, Kim, Yoriya, LaTempa and Grimes11 The conical effect observed in ATO nanotubes anodized at room temperature was absent when anodized at elevated temperatures. Also, the nanotubes anodized at 52 °C were not ridged, as seen in those anodized at room temperature [Fig 6(b)].
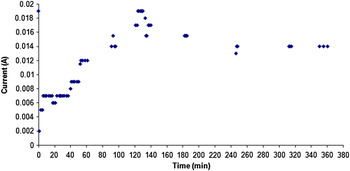
Anodization time also plays a crucial role in determining ATO nanotube architecture. From the plot of current versus time of anodization in aqueous electrolyte at room temperature for 6 h (Fig. 12), it can be seen that the current reached a minimum at ∼1 min and reached a peak at ∼2 h. After the peak, the current dropped slightly, remaining steady throughout the remainder of the anodization.
Plot of current versus time for an anodization in aqueous electrolyte for 6 h at room temperature under standard conditions (applied voltage 20 V and initial current 0.02 A).

A three-stage anodization was hypothesized from the current versus time plot: Stage 1 is the formation of the oxide layer, which is shown in the plot from the beginning of the anodization until the current reached a minimum. At this stage, the current decreases because the growth of the oxide layer leads to large resistant. During Stage 1, t = 0 to 1 min, and rate of oxidation (R ox) > rate of dissolution (R diss), resulting in oxide growth with no nanotube growth. Stage 2 is the initial etching of the oxide layer, where the current is increasing from the minimum to the maximum. During this stage, t = 1 to 120 min, and R diss > R ox, resulting in a porous titanium oxide layer. Stage 3 is the growth of nanotubes. During this stage, t = 120 to 380 min, and R ox is only slightly larger than R diss, resulting in nanotube growth. In aqueous electrolyte, a true equilibrium between R ox and R diss is never reached as anodization times greater than 6 h will begin to etch and shorten existing nanotubes (i.e., R diss > R ox at longer times).
In aqueous electrolyte solution, longer anodization times will lead to F− damaged nanotube array architectures and overall shorter nanotubes. However, the length of the ATO nanotubes anodized in glycerol electrolyte increased with increasing anodization times, as seen in Figs. 16 and 17. This was due to the slower R diss in the more viscous glycerol electrolyte. After 3 h of anodization in aqueous electrolyte, R ox nearly equaled R diss. This was not the case when anodizing in glycerol electrolyte. Longer tubes were produced at longer anodization times; therefore, in glycerol electrolyte, R ox was always larger than R diss.
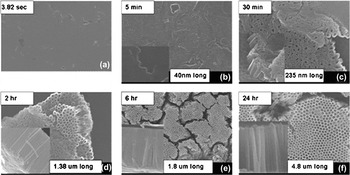
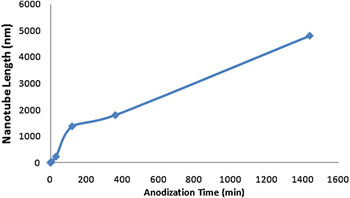
Investigation of the time dependence of the ATO nanotube formation in glycerol electrolyte (Figs. 13 and 14) confirmed a three-stage formation, as seen in the anodization in aqueous electrolyte solution: (i) formation of the oxide layer, with voltage ramping up to 20 V from the open circuit (3.82 s to 5 min); (ii) etching of the oxide layer and formation of the ATO nanotube array (5–30 min); and (iii) growth of the ATO nanotube array (beyond 30 min). The oxide layer was totally dissolved between 2 and 6 h. Between 2 and 6 h, the growth rate of nanotubes was calculated as 105 nm/h; between 6 and 24 h, the nanotube growth rate increased to 167 nm/h. Thus the dissolution of the oxide layer influenced and slowed the growth of ATO tubes.
(a)–(f) SEM images of ATO nanotubes anodized in glycerol electrolyte at room temperature for varying anodization times.

Plot of ATO nanotube length versus anodization time (anodized in glycerol electrolyte at room temperature).

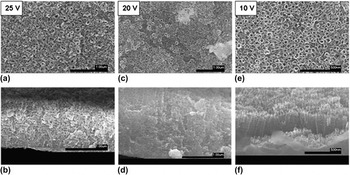
The anodization voltage effect in aqueous electrolyte is shown in Fig. 15. Titanium foil samples were anodized in aqueous electrolyte under standard conditions for 6 h at applied voltages of 10, 20, and 25 V. Anodization at an applied voltage of 25 V produced a damaged array of inhomogeneous nanotubes that was ∼1 μm thick. These nanotubes are very nonuniform, with their pore diameters ranging from 28 to 67 nm (average diameter 43.9 nm) and a wall thickness of 23.5 nm. Anodization at an applied voltage of 20 V produced a less damaged and thicker (1.8 μm) ATO nanotube array consisting of relatively uniform nanotubes. These nanotubes had a pore diameter of 36.9 ± 16 nm and a wall thickness of 18.4 nm. Anodization at an applied voltage of 10 V produced a more homogeneous ATO nanotube array, although the array was considerably thinner (∼300 nm). The nanotubes were quite uniform and had a smaller pore diameter (25.3 nm) and thinner walls (4.7 nm). Anodization at low voltage also led to less damaged and smoother tubes with a narrow distribution of pore diameter and wall thickness, as shown in Fig. 15. As the applied voltage was increased from 10 to 25 V, the length of the nanotubes increased, but a damaged nanotube array consisting of inhomogeneous nanotubes was observed. The distribution of nanotube pore size and nanotube wall thickness increased as voltage increased (another indication of less-ordered nanotube arrays).
SEM images of ATO nanotubes anodized in aqueous electrolyte at room temperature at 25, 20, and 10 V; (a), (c), (e) top views and (b), (d), (f) cross-sectional views.

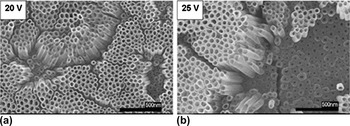
The effects of anodization voltage in glycerol electrolyte are shown in Fig. 16. Two voltages, 20 and 25 V, were used to anodize the ATO nanotubes in glycerol electrolyte. The resulting nanotube architectures were quite similar with slight differences in pore diameter (Fig. 16). Anodizing at 20 V produced nanotubes with slightly smaller pores than those produced at 25 V. The wall thickness was similar in both cases (8 ± 3 nm). Nanotube pore diameter increased slightly with applied voltage, 37 ± 9 nm at 20 V; the nanotubes anodized at 25 V were less uniform with pore diameters ranging from 27 to 54 nm (average pore diameter 43 nm). As seen with aqueous electrolyte, the higher voltage of 25 V did not increase ATO nanotube length, due to critical applied voltage.
SEM images of ATO nanotubes anodized in glycerol at room temperature for 6 h at (a) 20 V and (b) 25 V.

Lowering the initial current from 0.02 to 0.001 A increased the nanotube length to 1.8 μm (almost double) at 20 V and to 1.96 μm at 25 V. At the lower current, the pore diameter and wall thickness of the ATO nanotubes both decreased. The initial current effect on the pore diameter and wall thickness was enhanced by elevated applied voltage. The average pore diameter decreased by 7.5 nm at 20 V and by 18.2 nm at 25 V. The average wall thickness did not dramatically decrease (only by 1.00 nm at 20 V and by 1.84 nm at 25 V). Initial current also represents the sweep rate. Lower initial current produces a slower sweep rate. A lower current means relatively slower oxidation, which produces less resistance at the same time span. According to Ohm’s law, at a fixed current, applied voltage increases with resistance. Thus slower increased resistant leads to slower increased voltage (i.e., slower sweep rate).
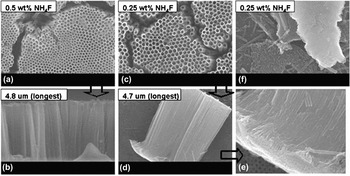
ATO tube lengths of 4.8 μm were produced in glycerol electrolyte solutions containing NH4F concentrations of 0.25 and 0.5 wt%. ATO nanotube array thickness was not influenced by the F− concentration. However, the nanotube array architecture was influenced by F− concentration. The nanotube pore diameters were slightly larger (∼5 nm) at higher F− ion concentrations. There were also some structural artifacts in the 0.5 wt% electrolyte that were not present in the 0.25 wt% electrolyte. These artifacts were remnants of the porous oxide layer that were not completely dissolved. The 0.5 wt% electrolyte had a larger R diss than the 0.25 wt% electrolyte as the oxide layer is still observed in SEM images of the 0.25 wt% sample (Fig. 17). Interestingly, individual free nanotubes can be seen in those samples.
SEM images [(a), (c), (f) top and (b), (d), (e) cross-sectional views] of ATO anodized in two concentrations of NH4F at an initial current of 0.001 A for 24 h in glycerol electrolyte at room temperature.

The above discussions are essentially on the basis of the key driving forces involved during nanotube-forming anodization process including (i) Ti oxidation (of the Ti to form barrier layer, (ii) dissolution of oxide (near front barrier layer, near internal wall, and near top surface of nanotubes). The oxidation process for the barrier layer formation is a mechanism to progress and penetrate into the Ti metal. In literature, it is known that the oxide dissolution rate near the front end of the barrier layer is faster than the nanotube wall because of the difference in electrochemical and electrolyte species/concentration distribution. That is why nanotube forms preferentially toward the barrier layer direction. According to the Einstein–Stokes relation:

viscosity, η, and absolute temperature, T, of the solution affect particle diffusion rate, D, (for species in the electrolyte solution), and thus, affect the oxidation or the dissolution rates. The length of nanotubes is determined by the overall balance of oxidation rates and by the dissolution rates (namely the diffusion rate of F−, which is responsible for the dissolution of TiO2 in the form of TiF62− see scheme in Fig. 1). It is clear that temperature affects viscosity and that the organics used in these experiments ethylene glycol and glycerol are more viscous than water (30.2, 934, 0.890 mPa s, respectively, at 25 °C) and thus slow down the diffusion rates (D) which leads to lowered dissolution rates near the top surface of nanotube layer, and thus longer nanotubes are preserved. On the other hand, when the electrolyte is less viscous, higher diffusion rates (D) lead to higher dissolution rate (particularly true in the scenario that the dissolution rate near the barrier layer is faster than near the top surface or wall), shorter nanotubes with larger diameters are produced. For species F− in these electrolytes, we can simplify the Einstein–Stokes diffusion rate to D = A/η, where A combines all the constants for said species at temperature T. Then the diffusion rates (D) in water, ethylene glycol, and glycerol become 1.12, 3.31 × 10⁻², and 1.07 × 10⁻³ A, respectively. According to solution viscosities and diffusion rates, one would expect to see longer nanotubes in glycerol than in water, which is what is reported herein. Temperature affects both the oxidation and dissolution rate, and according to the Vogel–Fulcher equation, the viscosity of the electrolyte solutions as well. Typically higher temperature decreases the viscosity and increases the oxidation or dissolution processes. Viscosity affects the diffusion rate of O2− through the electrolyte solutions toward the interface metal barrier layer and thus affects the oxidation rate. The oxidation of the barrier layer affects the rate of nanotube growth rate. Therefore, the viscosity affects the nanotube growth. The submerging positional effects (in relative to the solution–air interface) may be due to the nonuniform distribution of concentrations of electrolyte species like H+ (which affects the dissolution) or oxygen in solution (which affects the oxidation of Ti species).
IV. CONCLUSIONS
The effects of electrolyte solution, location on the anodized titanium foil, anodization temperature, anodization time, applied voltage, and initial current on ATO nanotube array architecture were all studied. Of these factors, electrolyte (aqueous versus organic), temperature, and time had the most dramatic effects on the overall architecture. Nanotubes nearly 5 μm long were formed in glycerol after 24 h of anodization. Anodization in glycerol electrolyte produced densely packed, homogeneous nanotube arrays that increased in length as anodization time increased. Anodization in aqueous electrolyte produced damaged architectures that were continually etched over time, with nanotube length decreasing as anodization time increased. It was observed that regardless of anodization electrolyte, nanotube array architecture was dependent on the location of the nanotubes on the anodized titanium foil relative to the air–solution interface. Nanotubes that formed near or slightly above the interface (in the case of aqueous electrolyte) were covered by an oxide layer. Nanotubes that formed on a titanium foil surface fully submerged in electrolyte exhibited no oxide coating. In aqueous electrolyte, nanotubes that formed near the bottom of the foil were significantly more damaged than those that formed in the middle of the foil. More uniform nanotube arrays were formed in aqueous electrolyte when anodized at lower temperatures (5 °C); these nanotubes were twice as long as those formed under similar anodization conditions at room temperature. In glycerol electrolyte the opposite trend is true, with the longest nanotubes (12.5 μm) formed in just 6 h at 52 °C. Lower applied voltages produced less damaged arrays of uniform nanotubes when anodizing in aqueous electrolyte; however, these nanotube arrays are much shorter (300 nm) than ones formed at higher voltages (1 and 1.8 μm at 25 and 20 V, respectively). Applied voltage did not affect nanotube arrays anodized in glycerol electrolyte. Lowering the initial current from 0.02 to 0.001 A doubled the length of nanotubes anodized in glycerol electrolyte. In this work, we also showed the possibility of producing some freely dispersed individual nanotubes.
ACKNOWLEDGMENT
The submitted manuscript has been authored by a contractor of the U.S. government under Contract No. DE-AC05-00OR22725.