Introduction
Thailand is one of the major rice-exporting countries in the world. In 2015, rice generated more than US$4500 million of foreign exchange to the national economy, with fragrant rice contributing approximately half (Thai Rice Exporter Association, 2016). Farmers in 11 provinces in Thailand primarily grow a local fragrant rice variety called Khao Dawk Mali 105 (KDML 105), developed through the collaboration and teamwork of rice breeding efforts in Thailand during the 1970s–1980s (Grandstaff et al., Reference Grandstaff, Grandstaff, Limpinuntana and Suphanchaimat2008). This area covers approximately 4.2 Mha, resulting in a total annual production of 9–12 million tones (Mt) of rice (OAE, 2013, 2014, 2015). KDML 105 is a photoperiod-sensitive rice variety that can only be grown during the rainy season from June to December. Therefore, estimates of the seasonal KDML 105 rainfed rice production are important for policymakers and exporters in making decisions for rice marketing and stock management, and for farmers for the allocation of resources to mitigate various types of risk. Each year, the Office of Agricultural Economics (OAE) uses a farm survey, crop cutting and statistical methods to estimate rice production, but the rice production statistics are released several months after the harvesting period. In order for policymakers, exporters and farmers to be able to make efficient and timely decisions, estimates of the seasonal KDML 105 rice production are needed well in advance of the final harvest of rice.
Estimates of seasonal crop yield are important for several aspects. Timely and accurate crop yield estimate information is an essential management tool for the European Union in its attempts to regulate the common agricultural market (Supit, Reference Supit1997). The results of estimates are also important for the improvement of crop production outcomes of decisions made by stakeholders (Challinor, Reference Challinor2009) and for low-input, high-efficiency, sustainable agricultural practices and precision farming (Zhang et al., Reference Zhang, Wang and Wang2002). Therefore, a tool for estimating seasonal crop yield is essential for any agricultural information system. This type of tool has been developed for cotton (Baigorria et al., Reference Baigorria, Chelliah, Mo, Romero, Jones, O'Brien and Higgins2010; Mauget et al., Reference Mauget, Leiker and Nair2013), for several crops in Europe (Cantelaube and Terres, Reference Cantelaube and Terres2005), for summer crops in Serbia and Austria (Lalić et al., Reference Lalić, Firanj Sremac, Eitzinger, Stričević, Thaler, Maksimović, Daničić, Perišić and Dekić2017), for rice in the Philippines (Koide et al., Reference Koide, Robertson, Ines, Qian, DeWitt and Lucero2013) and for integration with seasonal climate forecasts (Shelia et al., Reference Shelia, Hansen, Sharda, Porter, Aggarwal, Wilkerson and Hoogenboom2019). Recently, Klemm and McPherson (Reference Klemm and McPherson2017) summarized advances in seasonal crop forecasts since 2000 and showed that these tools have often been employed for in-season yield forecasting.
In Thailand, seasonal crop forecasting has been conducted regularly to estimate the current rice production. Since 2014, the Geo-Informatics and Space Technology Development Agency (GISTDA) has produced fortnightly estimates of planted area and yield that are disseminated on its web portal at https://rice.gistda.or.th. To estimate the fragrant rice yield of each specific region, GISTDA's researchers use an approach that multiplies the average rice yield for a fixed crop duration of 120 days after planting with the estimated planted area of rice, derived from satellite images. This estimate, however, could be improved if a more realistic estimate of rice yield were used, such as with process-based crop models that simulate crop growth, development and yield (Jones et al., Reference Jones, Hoogenboom, Porter, Boote, Batchelor, Hunt, Wilkens, Singh, Gijsman and Ritchie2003). These models are able to capture various management practices that directly influence crop duration and yield such as planting date, crop variety, water management, nitrogen chemical fertilizer management and crop residue management (Tsuji et al., Reference Tsuji, Uehara and Balas1994; Hoogenboom, Reference Hoogenboom2000; Jones et al., Reference Jones, Hoogenboom, Porter, Boote, Batchelor, Hunt, Wilkens, Singh, Gijsman and Ritchie2003; Basso et al., Reference Basso, Liu and Ritchie2016; Hoogenboom et al., Reference Hoogenboom, Porter, Shelia, Boote, Singh, White, Hunt, Ogoshi, Lizaso, Koo, Asseng, Singels, Moreno and Jones2017). For rice, the Cropping System Model-Crop Environment Resource Synthesis for Rice (CSM-CERES-Rice) model has been used widely across the globe (Jones et al., Reference Jones, Hoogenboom, Porter, Boote, Batchelor, Hunt, Wilkens, Singh, Gijsman and Ritchie2003; Hoogenboom et al., Reference Hoogenboom, Porter, Shelia, Boote, Singh, White, Hunt, Ogoshi, Lizaso, Koo, Asseng, Singels, Moreno and Jones2017). This model was developed by the International Benchmark Sites Network for Agrotechnology Transfer (IBSNAT) project (Ritchie et al., Reference Ritchie, Alocilja, Singh and Uehara1987; Tsuji et al., Reference Tsuji, Uehara and Balas1994; Hoogenboom et al., Reference Hoogenboom, Jones, Porter, Wilkens, Boote, Hunt and Tsuji2010) and is one of the main cereal models of the Decision Support System for Agrotechnology Transfer (DSSAT) (https://www.DSSAT.net; Hoogenboom et al., Reference Hoogenboom, Porter, Shelia, Boote, Singh, White, Hunt, Ogoshi, Lizaso, Koo, Asseng, Singels, Moreno and Jones2017). The model was designed to determine the duration of growth stages, dry matter production and partitioning, root system dynamics, effects of soil water and soil nitrogen content on photosynthesis and photosynthate partitioning, carbon balance and water balance, and, ultimately, to estimate yield for both rainfed and irrigated rice. The current and previous versions of the model have been tested and applied successfully in Thailand (Jintrawet, Reference Jintrawet1991; Buddhaboon et al., Reference Buddhaboon, Jintrawet and Hoogenboom2018) and in numerous other regional studies (Timsina and Humphreys, Reference Timsina and Humphreys2006; Basso et al., Reference Basso, Liu and Ritchie2016). The CSM-CERES-Rice model can be used for seasonal yield forecasting to simulate the rice growing season duration and yield for different planting dates prior to harvest, providing more realistic estimates of rice yield for use in seasonal rice production forecasting.
The CSM-CERES-Rice model, however, requires inputs that include soil and weather data, management practices and crop-specific genetic coefficients for model simulation (Jones et al., Reference Jones, Hoogenboom, Porter, Boote, Batchelor, Hunt, Wilkens, Singh, Gijsman and Ritchie2003; Hoogenboom et al., Reference Hoogenboom, Jones, Traore, Boote, Kihara, Fatondji, Jones, Hoogenboom, Tabo and Bationo2012). To support the estimation of KDML 105 rice yield and production 3–4 months prior to harvest would require the integration of spatial databases provided by various Thai agencies, including seasonal weather forecasts, with the CSM-CERES-Rice model for an integrated agro-informatics system. Jintrawet and Kaeomuangmoon (Reference Jintrawet and Kaeomuangmoon2016) developed a prototype interface tool called Decision Support System for Seasonal Rice Yield Forecast System (DSS-SRY4cast (Rice4cast shell)) that allowed users to produce rice yield forecasts 4–6 months in advance for six planting dates during the 2016 main rice season in Thailand. However, they did not specifically focus on the estimation of seasonal KDML 105 production. The goal of the current study was, therefore, to demonstrate the capacity of an integrated agro-informatics system (Rice4cast shell) to estimate rainfed fragrant rice production at both the district and national levels using a process-oriented CSM-CERES-Rice model and agricultural resource data routinely collected by government agencies. The specific objectives were to parameterize and evaluate the CSM-CERES-Rice model and to use the system for seasonal fragrant rice yield and production forecasting, based on local data sets from Thailand.
Materials and methods
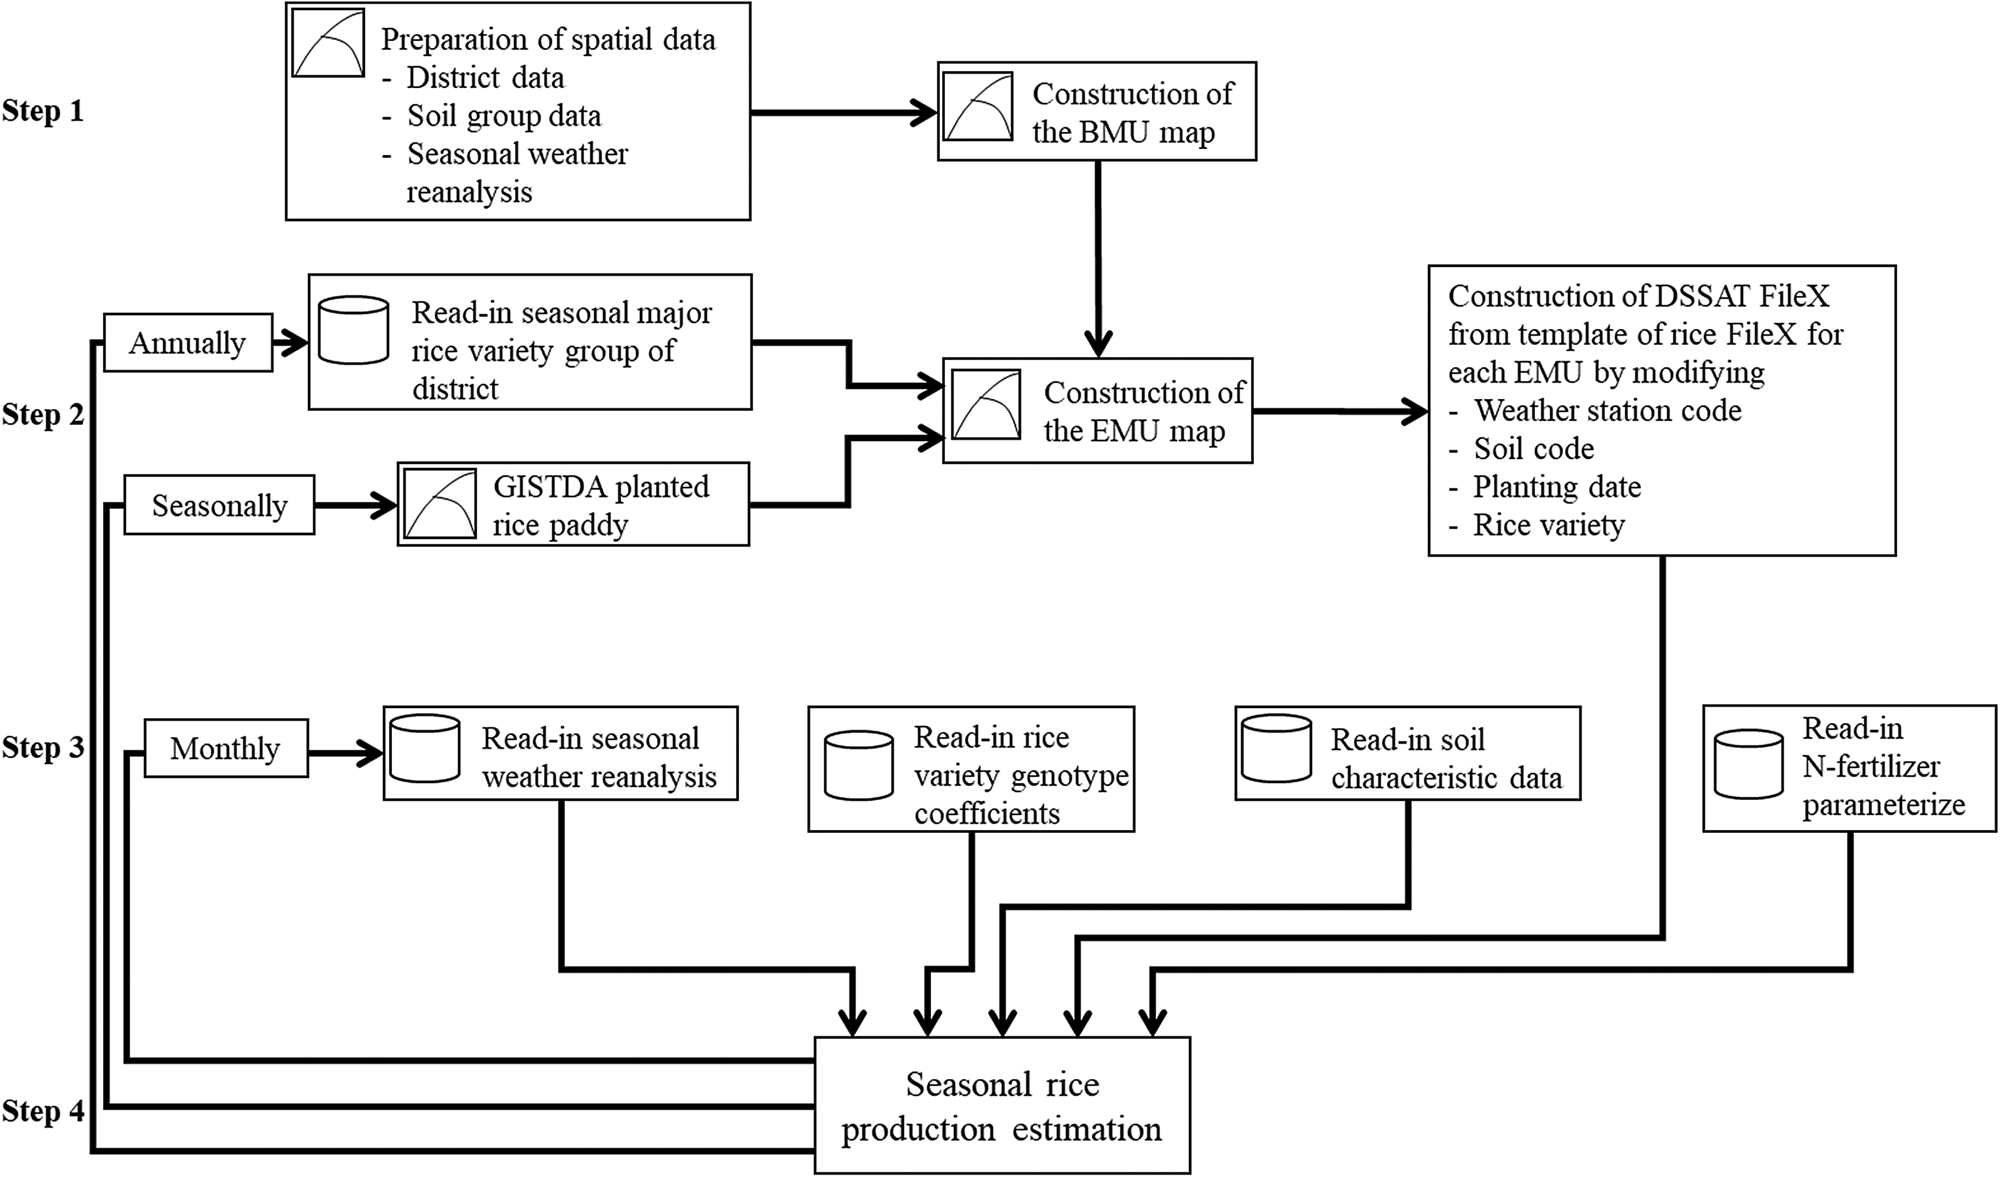
The study used the process-based CSM-CERES-Rice simulation model (Jones et al., Reference Jones, Hoogenboom, Porter, Boote, Batchelor, Hunt, Wilkens, Singh, Gijsman and Ritchie2003; Hoogenboom et al., Reference Hoogenboom, Porter, Shelia, Boote, Singh, White, Hunt, Ogoshi, Lizaso, Koo, Asseng, Singels, Moreno and Jones2017) and spatial and attribute data sets, including the seasonal weather forecast products from the Weather Research and Forecasting (WRF) model (Chotamonsak et al., Reference Chotamonsak, Salathé, Kreasuwan, Chantara and Siriwitayakorn2011, Reference Chotamonsak, Salathé, Kreasuwan and Chantara2012). These data sets are collected routinely by various government agencies in Thailand. Steps in the seasonal KDML 105 rice production estimation using the Rice4cast shell are shown in Fig. 1.
Main steps of Rice4cast system for seasonal KDML 105 rice production estimation. BMU, Basic Mapping Unit; EMU, Estimation Mapping Unit.

Study area
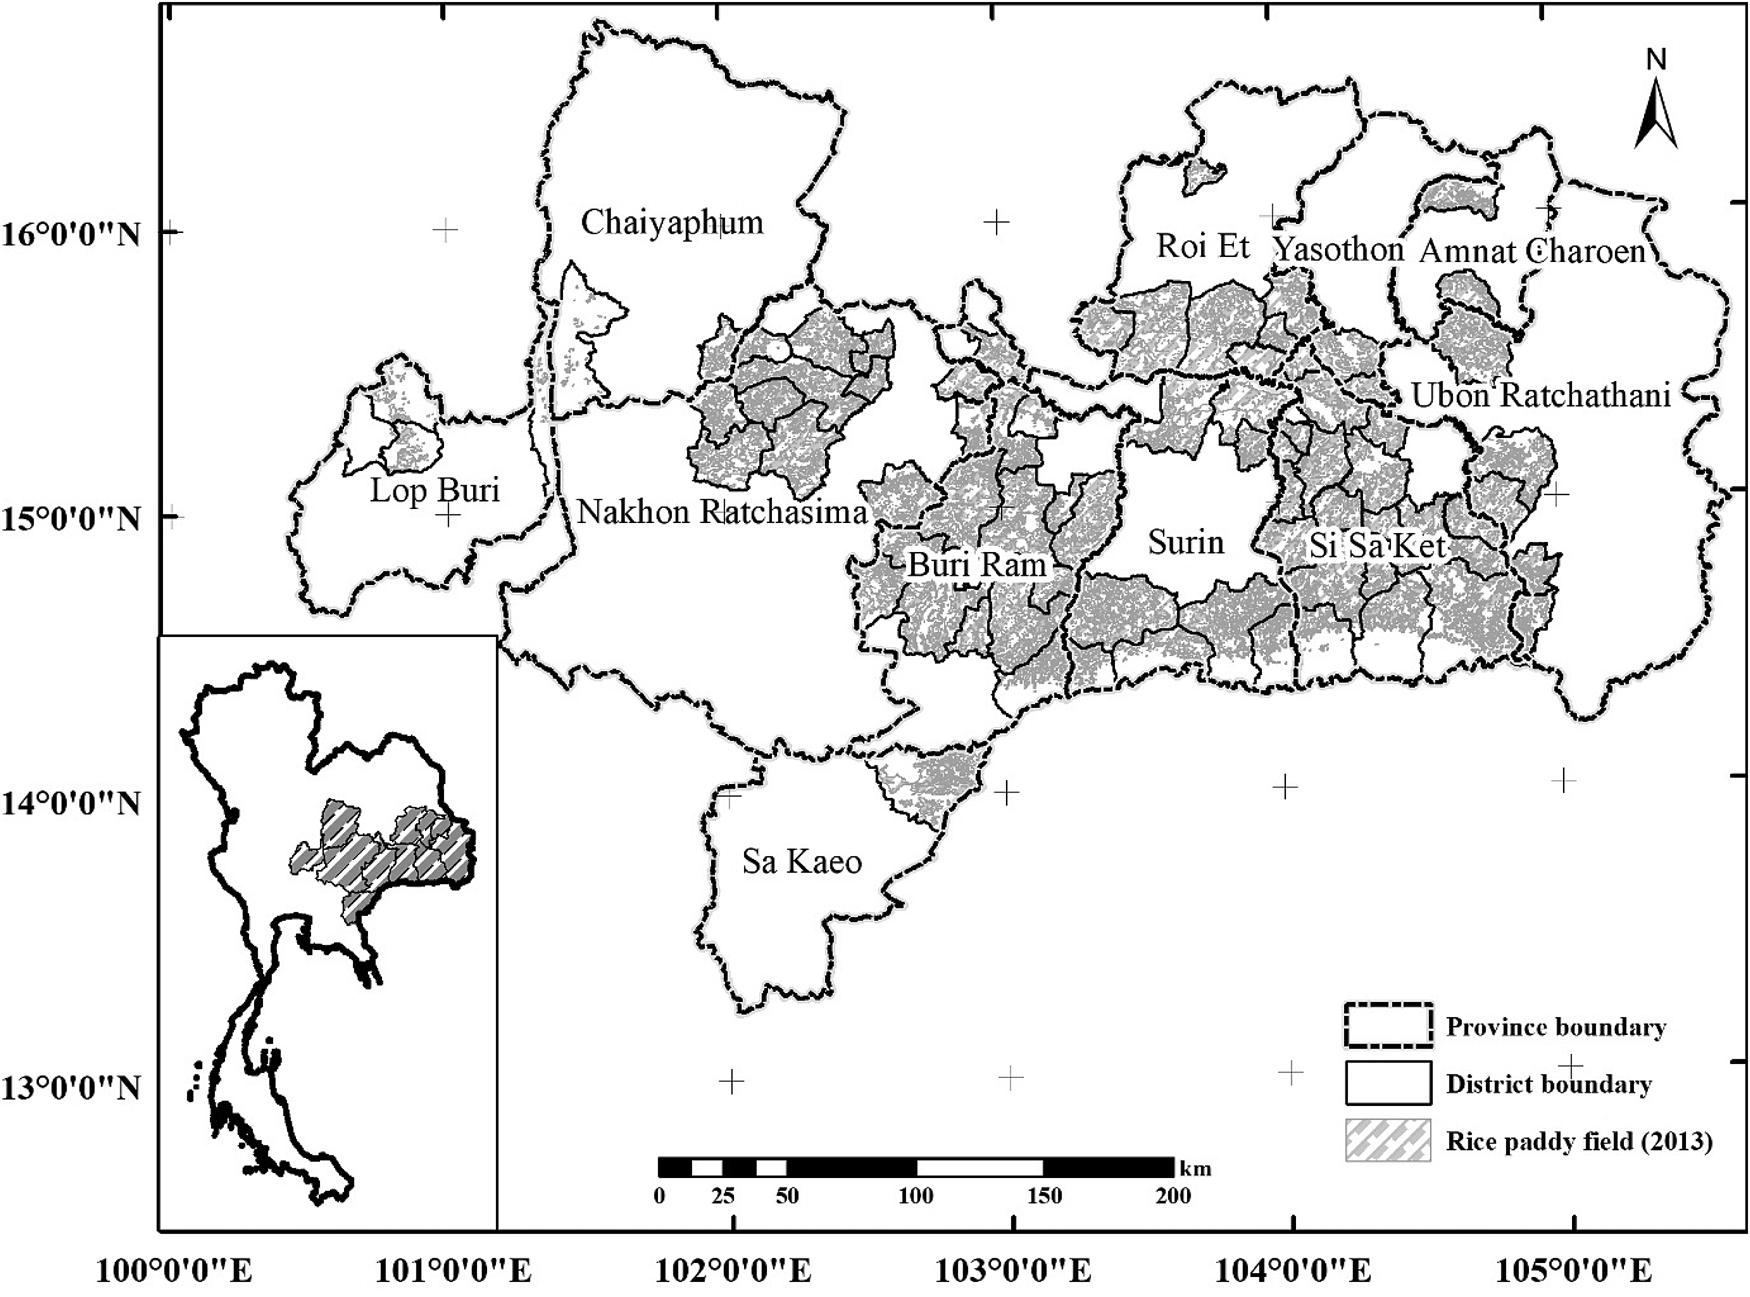
In 2015, approximately 4.2 Mha of the rice planted area were allocated to the production of the KDML 105 rice variety, which accounts for about 0.45 of the total rice planted area during the main rice-growing season in Thailand (OAE, 2015). The current study focused on 77 districts of 11 provinces for the main rice-growing seasons from 2013 to 2015 (Fig. 2). In each district, KDML 105 rice was the dominant rice variety, covering more than 0.90 of the total rice planted area of each district. From 2013 to 2015, the total planted area for KDML 105 in the 77 selected districts in 11 provinces ranged from 1.8 to 2.0 Mha, which was approximately 0.94 of the total KDML 105 rice planted areas in Thailand (OAE, 2013, 2014, 2015). The majority of these districts were located in the lower part of Northeast Thailand in Si Sa Ket, Surin, Buriram, Roi Et and Nakhon Ratchasima provinces. Farmers in these areas depend on rainfall as the major source of water for rice production.
Locations of 77 districts in 11 provinces in Thailand that were the study sites of the seasonal KDML 105 rice production estimation.

Minimum Data Set for Khao Dawk Mali 105 rice production estimate
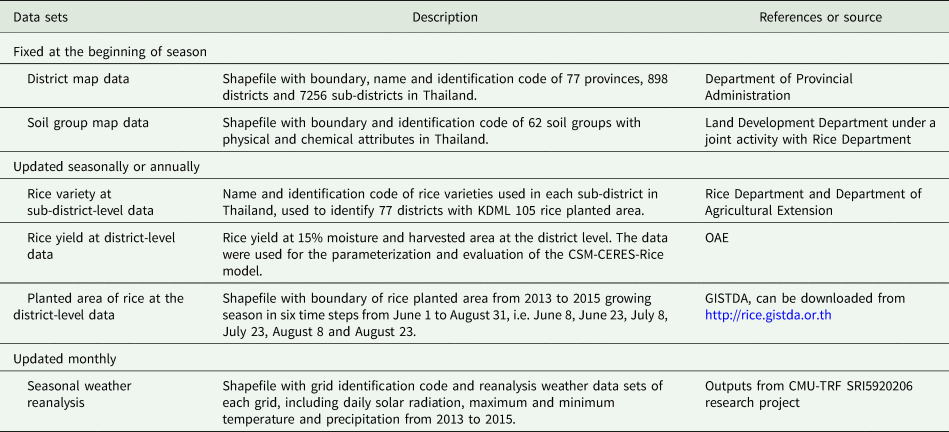
The current study implemented the DSS-SRY4cast system (Jintrawet and Kaeomuangmoon, Reference Jintrawet and Kaeomuangmoon2016) in order to calculate KDML 105 rice production 3–4 months prior to harvest. The system required Minimum Data Sets (MDS) consisting of both spatial and attribute data sets for each administrative level (Table 1). The spatial data set consisted of an administration map, seasonal climate forecasts from the WRF model grid map, a soil group map and a map of the planted area of fragrant rice. This MDS allowed the spatial limit of the scope of seasonal rice production estimate to be defined as a function of simulated rice yield and area planted for each rice variety. In addition, the MDS was also used to create an Estimate Mapping Unit (EMU), with unique administrative, weather station and soil identification codes for each EMU.
The Minimum Data Set (MDS) required for seasonal estimation of KDML 105 rice production at the district level in Thailand using Rice4cast shell

Administration map
The Department of Provincial Administration provided the administration map in a shapefile format with the province, district (Amphoe) and sub-district (Tambon) boundaries. These maps were polygon shapefiles expressed in geographic coordinates and referenced to WGS1984. Currently, in Thailand, there are 77 provinces, 878 districts and 7256 sub-districts.
Khao Dawk Mali 105 rice-planted area maps
Estimates of the area planted with rice were released fortnightly by GISTDA and posted on their website (https://rice.gistda.or.th). The rice-planted areas acquired for the current study from 2013 to 2015 were processed from the Moderate Resolution Imaging Spectroradiometer (MODIS) surface reflectance 8-day L3 Global 250m SIN Grid V005 or MOD09Q1 data set (Bridhikitti and Overcamp, Reference Bridhikitti and Overcamp2012). To obtain the area planted with KDML 105 rice, the fortnightly shapefiles released by GISTDA in six time-steps per year during the main rice-growing season from June to August in 2013, 2014 and 2015 were linked to the farmer registration database administered and operated by the Department of Agricultural Extension. By linking data from these two sources, the KDML 105 rice-planted area shapefiles data sets (Table 1) were created with administration codes for 2013–2015 growing seasons for six planting dates per year. During the period encompassing the six planting dates, on average all 77 districts received about 180–300 mm of rain per month, which was sufficient to produce a reasonably good rice crop (Yoshida, Reference Yoshida1981).
The Weather Research and Forecasting reanalysis grid map
The WRF model version 3.7.1, developed at the National Center for Atmospheric Research (NCAR), was used as a regional climate model in the current study. The WRF model configuration and parameterizations used here follow previous studies and have been tested satisfactorily for Thailand (Chotamonsak et al., Reference Chotamonsak, Salathé, Kreasuwan, Chantara and Siriwitayakorn2011, Reference Chotamonsak, Salathé, Kreasuwan and Chantara2012). The 6-hourly temporal and 2.5-degree spatial resolution of National Center for Environmental Prediction (NCEP)/NCAR Reanalysis (Skamarock et al., Reference Skamarock, Klemp, Dudhia, Gill, Barker, Duda, Huang, Wang and Powers2008) were used as initial and boundary conditions and dynamically downscaled by the WRF regional climate model for the years 2013–2015. The WRF-NCEP/NCAR Reanalysis Project (NNRP or R1) regional climate model was run using two-way nesting at 36 and 12 km horizontal grid spacings and 35 vertical levels with 10 mb of the top model. This model system was investigated by the Seasonal Climate Forecasting Model for Rice Yield Modeling over Thailand (CMU-TRF SRI5920206) research project. In that project, the precipitation, maximum and minimum temperatures from 12 km downscaled outputs were compared to the 125 Thai Meteorological Department (TMD) observed stations to evaluate the model performance. The results showed that the WRF-NNRP model captured the maximum and minimum temperature in the focus area well (represented by Si Sa Ket, Surin, Buriram, Roi Et and Nakhon Ratchasima stations) with high correlation coefficients (0.7–0.9) and a slightly cold bias of 1–2 °C. The correlation coefficients for precipitation at the focused study area ranged from 0.6 to 0.7. In the present study, the WRF-NNRP nested domain data consisting of precipitation (mm/day), maximum and minimum temperature (°C) and solar radiation (MJ/m2/day), with a 12 km grid spacing, were converted to a grid shapefile and intersected with the KDML 105 rice planted area shapefiles to provide a link with the WRF-NNRP reanalysis downscaled data set which was released on a monthly basis. These were used in the forecasts of rice yield and production which were conducted each year in early June 3–4 months prior to harvest.
Soil map and attribute tables
The Land Development Department provided the national soil group map shapefile and soil group profile characteristics, including physical, chemical and morphological attributes. There were 62 soil group profiles, with 256 soil series profiles in Thailand (OSLD, 2007). The soil group profiles were constructed to store and provide minimum soil data in the CSM-CERES-Rice model format (Hoogenboom et al., Reference Hoogenboom, White, Acosta-Gallegos, Gaudiel, Myers and Silbernagel1997, Reference Hoogenboom, Jones, Traore, Boote, Kihara, Fatondji, Jones, Hoogenboom, Tabo and Bationo2012, Reference Hoogenboom, Porter, Shelia, Boote, Singh, White, Hunt, Ogoshi, Lizaso, Koo, Asseng, Singels, Moreno and Jones2017). In this step, the soil group map shapefile was intersected with all above shapefiles, i.e. administration map, KDML 105 rice planted area map, seasonal climate forecasts and WRF grid map and soil map, to generate unique KDML 105 seasonal rice production EMUs for 77 districts of 11 provinces in Thailand, which were used as the unit of analysis in the current study.
Cropping system model-crop environment resource synthesis-rice model
To estimate these detailed characteristics of growth and development, the rice model required an MDS as previously described, crop management and genetic coefficients (Hoogenboom et al., Reference Hoogenboom, Jones, Porter, Wilkens, Boote, Hunt and Tsuji2010, Reference Hoogenboom, Jones, Traore, Boote, Kihara, Fatondji, Jones, Hoogenboom, Tabo and Bationo2012). The CSM-CERES-Rice model assumes nine stages of rice plant development: pre-sowing, germination, emergence, juvenile, floral induction, heading, flowering, grain filling and harvesting (Ritchie et al., Reference Ritchie, Alocilja, Singh and Uehara1987; Singh et al., Reference Singh, Ritchie and Godwin1989). Completion of these growth stages is determined by an accumulation of degree-days based on a set of rice variety-specific genetic coefficients. The soil parameters, depth of soil layers, root growth factors, saturated hydraulic conductivity, bulk density (moisture), per cent of organic carbon, per cent of clay, silt, sand and nitrogen, pH in water and cation exchange capacity in the model create a more realistic soil and soil-water scenario. The model simulates growth and development using daily time steps and ultimately predicts final yield and yield components when harvest maturity is reached.
Model parameterization and evaluation
For each of the 77 districts, two different approaches for model parameterization and evaluation were implemented. In the first approach, 1 year of data for model parameterization and the remaining 2 years of data for model evaluation were used, while for the second approach, 2 years of data were used for model parameterization and the remaining 1 year of data for model evaluation.
The first approach included the following combinations:
(a) The data for 2013 were used for parameterization and those for 2014 and 2015 for evaluation.
(b) The data for 2014 were used for parameterization and those for 2013 and 2015 for evaluation.
(c) The data for 2015 were used for parameterization and those for 2013 and 2014 for evaluation.
The second approach includes the following combinations:
(a) The data for 2013 and 2014 were used for parameterization and the 2015 data for evaluation.
(b) The data for 2013 and 2015 were used for parameterization and 2014 data for evaluation.
(c) The data for 2014 and 2015 were used for parameterization and the 2013 data for evaluation.
In the parameterization phase, the planting date for each district was determined to be the most frequent planting dates released fortnightly by GISTDA for all EMUs in each respective district. Planting dates for all EMUs for the three growing seasons were 18 June 2013, 2 August 2014 and 16 July 2015. It was also assumed that the rice farms in each EMU had implemented the same management practices, called ‘recommended management guidelines’ by the BRRD (2010). Urea fertilizer was applied in one application at 30 days after transplanting at a nitrogen (N) rate of 17–30 kg N/ha at a depth of 10 cm, following the recommendation of the BRRD (2010). In the parameterization years, the N rate was adjusted by 1 kg N/ha in each iteration until the simulated rice yield was close to the corresponding OAE reported rice yield in each district. The average N rate applied for 1-year data parameterization was 30, 16 and 22 kg N/ha for 2013, 2014 and 2015, respectively, and for 2-year data parameterization was 23, 26 and 19 kg N/ha for 2013–2014, 2013–2015 and 2014–2015, respectively. These adjusted N application rates were used for the corresponding evaluation years. The model was configured to simulate KDML 105 growth and development under rainfed conditions and to maintain a bund height of 10 cm during the growing season to ensure sufficient standing water for rice development and growth. Daily weather data from June to December for 2013–2015 were retrieved from the WRF portal (www.rcces.soc.cmu.ac.th) and converted into DSSAT format. During the evaluation phase, planting dates were retrieved from GISTDA for each EMU in each district and the OAE reported rice data sets were used for model evaluation.
Office of Agricultural Economics procedures to obtain rice planted area and rice yield
Rice planted and harvested areas of the individual district data sets were obtained from field survey and remote-sensing data analysis by OAE staff during the months of November and December. The data sets were reviewed and approved by the OAE team, Provincial, Regional and Ministry of Agriculture and Cooperatives sub-committees and, finally, by the Ministrial level committee chaired by the Permanent Secretary of Ministry of Agriculture and Cooperatives.
Rice yield for the individual districts data sets was obtained from yield samplings which were conducted by OAE staff during harvest from 2013 to 2015, using the procedure established by a collaborative project with the Japanese Government (OAE, 2005). In each village, three 1 × 1 m plots of KDML 105 rice were identified and two were randomly selected for rice yield determination. The rice grains from the sampled plots were air-dried until a constant weight was obtained, then weighed to obtain the average rice yield for the village. The results were reported to OAE to calculate the average yield for KDML 105 at the district level. The OAE is the sole government agency responsible for the release of district-level data sets, and only the OAE reported rice yield and production data sets were used for both parameterization and evaluation of the model in the present study.
Statistical tests
During the parameterization and the evaluation phases, three statistical methods were used to determine the accuracy of the model, namely R 2 or coefficient of determination as shown in Eqn (1) (Kammen and Hassenzahl, Reference Kammen and Hassenzahl2001), Root Mean Square Error (RMSE) as shown in Eqn (2) (Wallach and Goffinet, Reference Wallach and Goffinet1987; Timsina and Humphreys, Reference Timsina and Humphreys2006) and normalized Root Mean Square Error (nRMSE) as shown in Eqn (3) (Loague and Green, Reference Loague and Green1991). The difference between the simulated and reported data, as indicated by the nRMSE value, can be described as the smaller the nRMSE value, the smaller the difference or the better the agreement. The agreement between the simulation results and the corresponding reported data was considered good when nRMSE < 10, was fairly good when 10 < nRMSE < 20, was moderate when 20 < nRMSE < 30 and was poor when nRMSE > 30 (Rinaldi et al., Reference Rinaldi, Losavio and Flagella2003).

where Sim i = simulated harvested rice grain yield value of the i th district; Sim mean = mean of simulated harvested rice grain yield values; Obs i = OAE rice grain yield value of the i th district; Obs mean = mean of OAE rice grain yield values.

where Sim i = simulated harvested rice grain yield value of the i th district, Obs i = OAE rice grain yields value i th district.

where Obs mean = averaged OAE rice yields values.
Results
Rice planted areas in 2013–2015
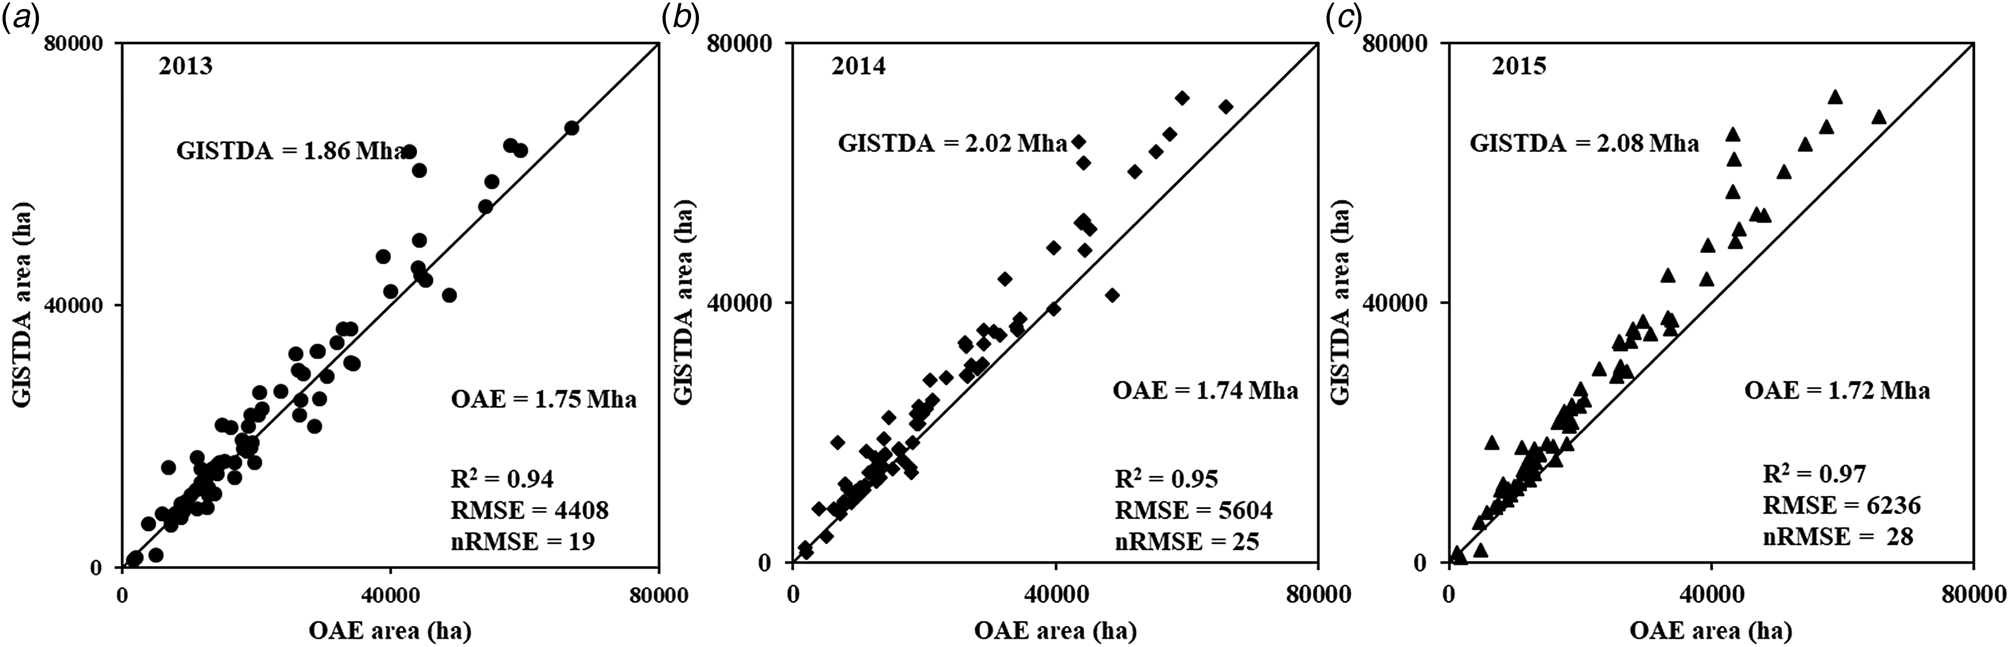
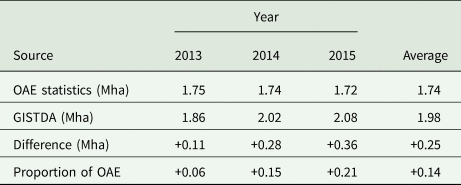
Based on the GISTDA's satellite data for the six planting dates during the main rice-growing season in 2013, 2014 and 2015, the KDML 105 rice-planted areas for the 77 districts in the current study covered approximately 1.86, 2.02 and 2.08 Mha, respectively (Table 2 and Fig. 3). These figures were higher than the corresponding OAE statistics, which were 1.75, 1.74 and 1.72 Mha for 2013, 2014 and 2015, respectively. The difference was rather small (+0.06) in 2013 but was much larger in 2014 (+0.15) and 2015 (+0.21). Averaging over these 3 years, the GISTDA data for planted area over-estimated the OAE data by +0.14. A comparison between the planted areas from GISTDA and OAE for the individual districts showed a fairly good agreement between the two data sources in 2013, with nRMSE being 19, but clearly indicates an over-estimation of GISTDA planted areas data in both 2014 and 2015, with nRMSE being 25 and 28, respectively (Fig. 3). Evidently, the degree of difference in planted areas between GISTDA and OAE data sets varied among the years. In the current study, however, the rice-planted areas were considered for a normal El Niño Southern Oscillation (ENSO) phase in 2013–2014 and for an El Niño ENSO phase in 2015 (CPC-NWS, 2017).
Comparison of KDML 105 rice variety planted areas in 2013 (a), 2014 (b) and 2015 (c) from OAE statistics and GISTDA data sets.

KDML 105 rice planted area (Mha) from OAE statistics and GISTDA data sets

The + sign indicates an over-estimation by GISTDA data sets.
Parameterized and evaluated seasonal rice yield for 2013–2015
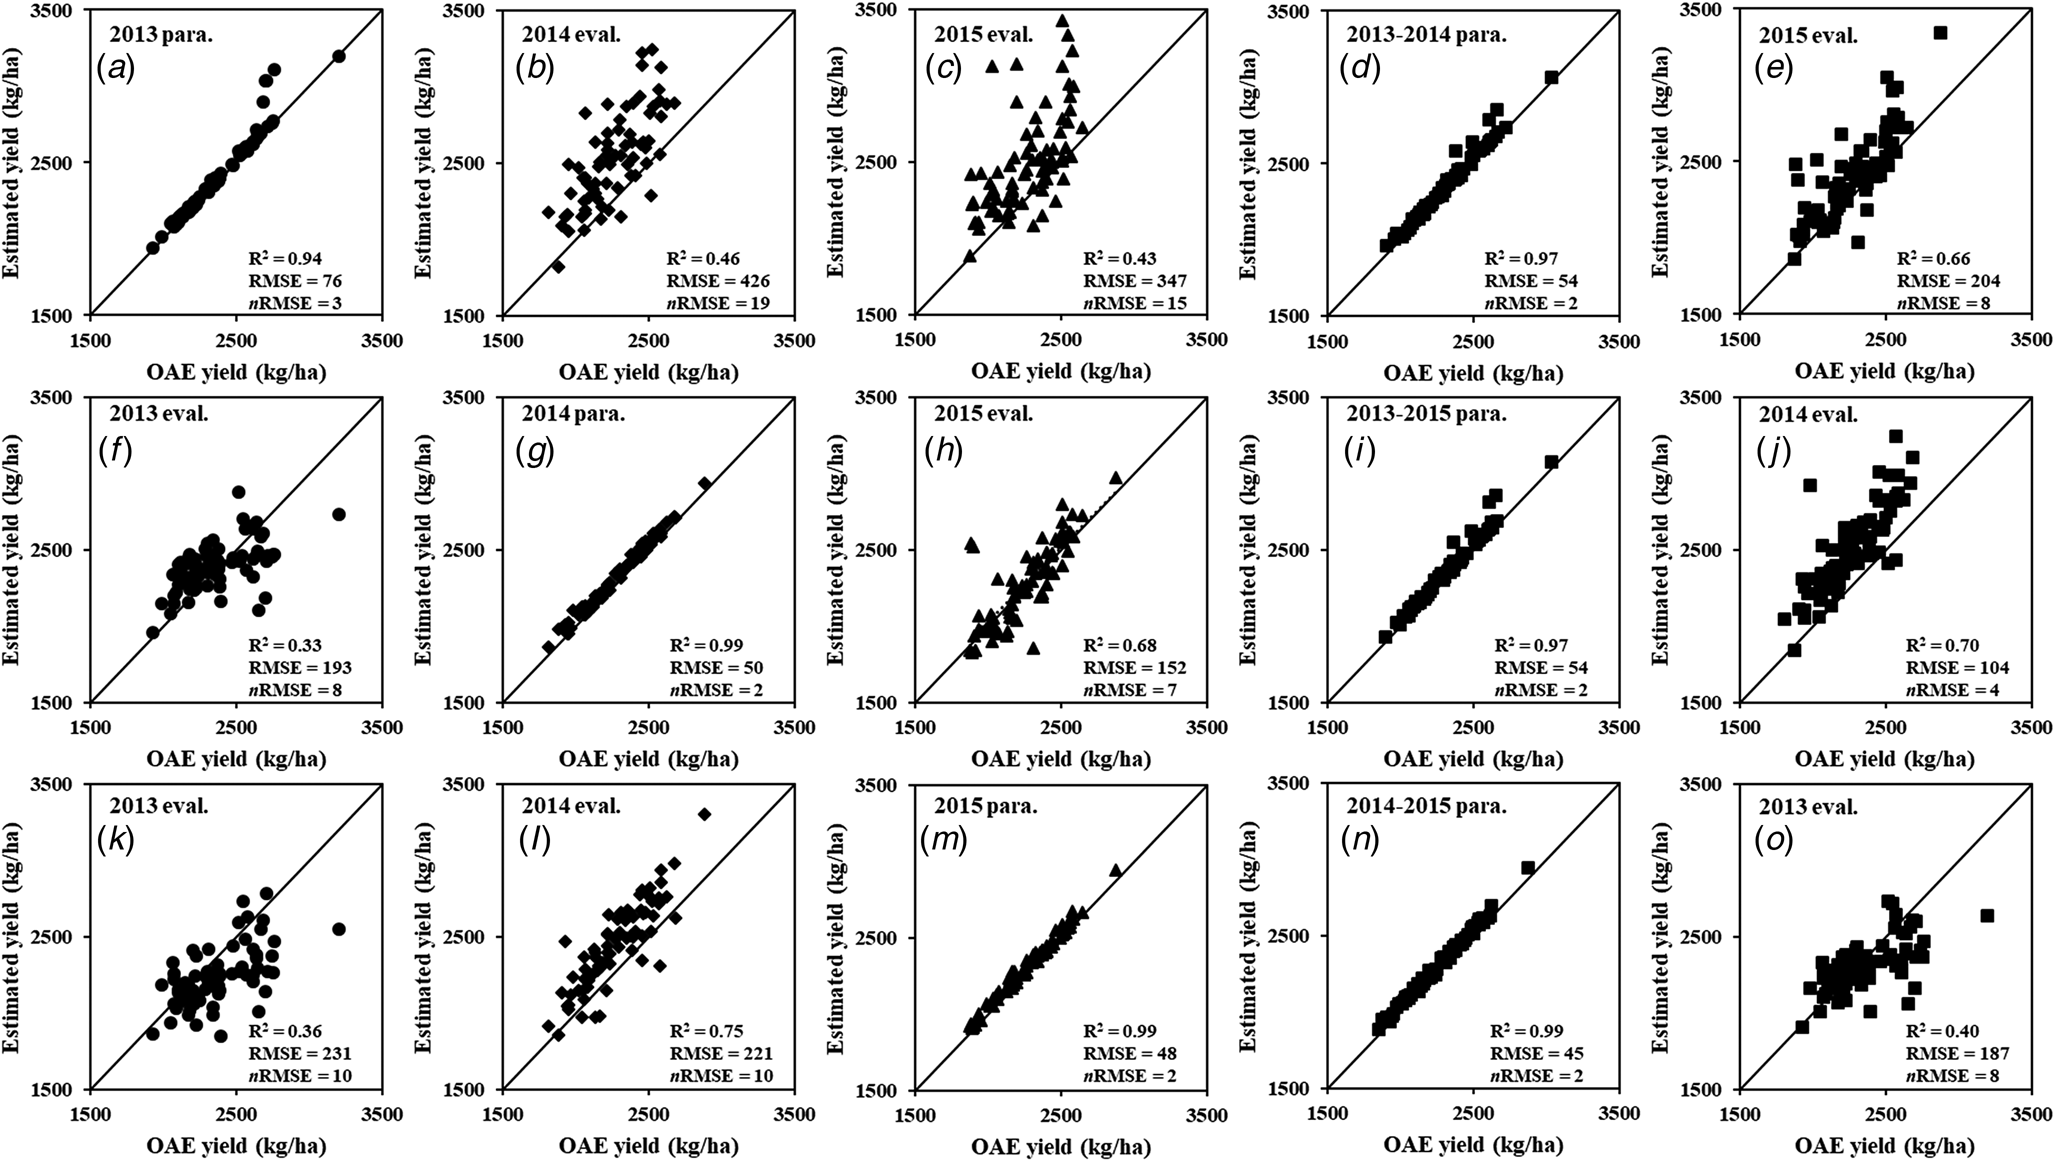
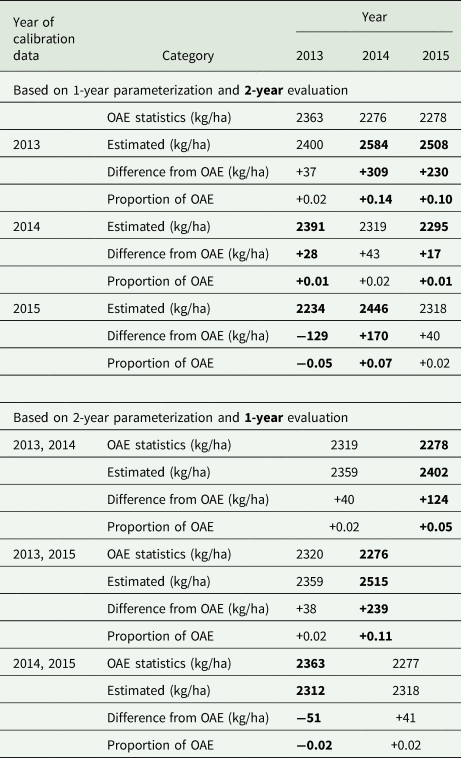
Table 3 shows the parameterized and evaluated KDML 105 rice yield for the 2013–2015 growing seasons, using 1- or 2-year data sets for parameterization and the remaining 2- or 1-year data sets for evaluation. The comparison between predicted yield and OAE yield of KDML 105 rice for the individual 77 districts in all these parameterized and evaluated years is shown in Fig. 4. In all cases of parameterization using both 1- and 2-year data, the Rice4cast shell gave average predicted rice yields that were close to those of the OAE statistics, with a difference of +0.02 for both the 1-year data parameterization and the 2-year data parameterization (Table 3). The comparison between predicted rice yield and OAE yield for the individual districts shows a good agreement in all parameterized years, regardless of whether 1-year data (Figs 4(a), (g), (m)) or 2-year data (Figs 4(d), (i), (n)) were used. In all these parameterized years, most of the predicted yields fell on the respective 1:1 lines, with R 2 values ranging from 0.94 to 0.99 and nRMSE values very low, between 2 and 3. These results indicated that all parameterizations were performed well and were able to adjust the predicted yields to be close to the OAE yields, as intended.
Comparison of OAE reported and simulated rice yield of KDML 105 rice variety using 1-year data set for parameterization (para.) and the remaining 2-year data sets for evaluation (eval): Set 1 (2013 para) – (a), (b), (c); Set 2 (2014 para) – (f), (g), (h); Set 3 (2015 para) – (k), (l), (m); and using 2-year data sets for parameterization (para.) and the remaining 1-year data set for evaluation (eval): Set 4 (2013–2014 para) – (d), (e); Set 5 (2014–2015 para) – (i), (j); Set 6 (2013–2015 para) – (n), (o).

Comparison of parameterized and evaluated KDML 105 rice yields (kg/ha) from OAE statistics and Rice4cast shell estimated results for 77 districts in Thailand

Bold figures were evaluation years, + sign indicates over-estimation and − sign indicates under-estimation by Rice4cast shell.
For model evaluation, the difference between the average predicted yield and the corresponding OAE average yield varied somewhat depending on the year of parameterization. The 2013 parameterized year gave the biggest differences between the predicted and the OAE average yield in the two evaluated years (+0.14 and +0.10 for 2014 and 2015, respectively), while 2014 parameterized year gave close predictions to OAE values, with the differences being only +0.01 for both 2013 and 2015 evaluation, and 2015 parameterized year gave intermediate differences (−0.05 in 2013 and +0.07 in 2014; Table 3). With 2-year data parameterization, the Rice4cast gave a similar range of differences between predicted and corresponding OAE average yields in the evaluated years, with a difference of +0.02 for 2013, 2014 and 2015 (Table 3). The comparisons between predicted and OAE yield for the individual districts showed a good to fairly good agreement for all evaluated years, with nRMSE values ranging from 7 to 19 for 1-year data parameterization (Figs 4(b), (c), (f), (h), (k), (l)) and from 4 to 8 for 2-year data parameterization (Figs 4(e), (j), (o)). However, no clear advantage of 2-year data over 1-year data parameterization or vice versa was observed. Although there was some variation in the degree of agreement between the predicted and the OAE yield among years, overall the Rice4cast shell performed reasonably well for the evaluation of rice yield prediction with independent data sets.
Predicted seasonal rice production for 2013–2015
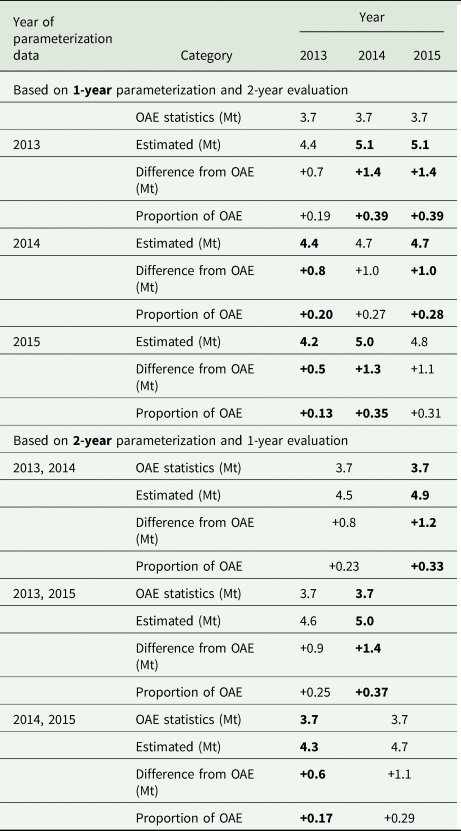
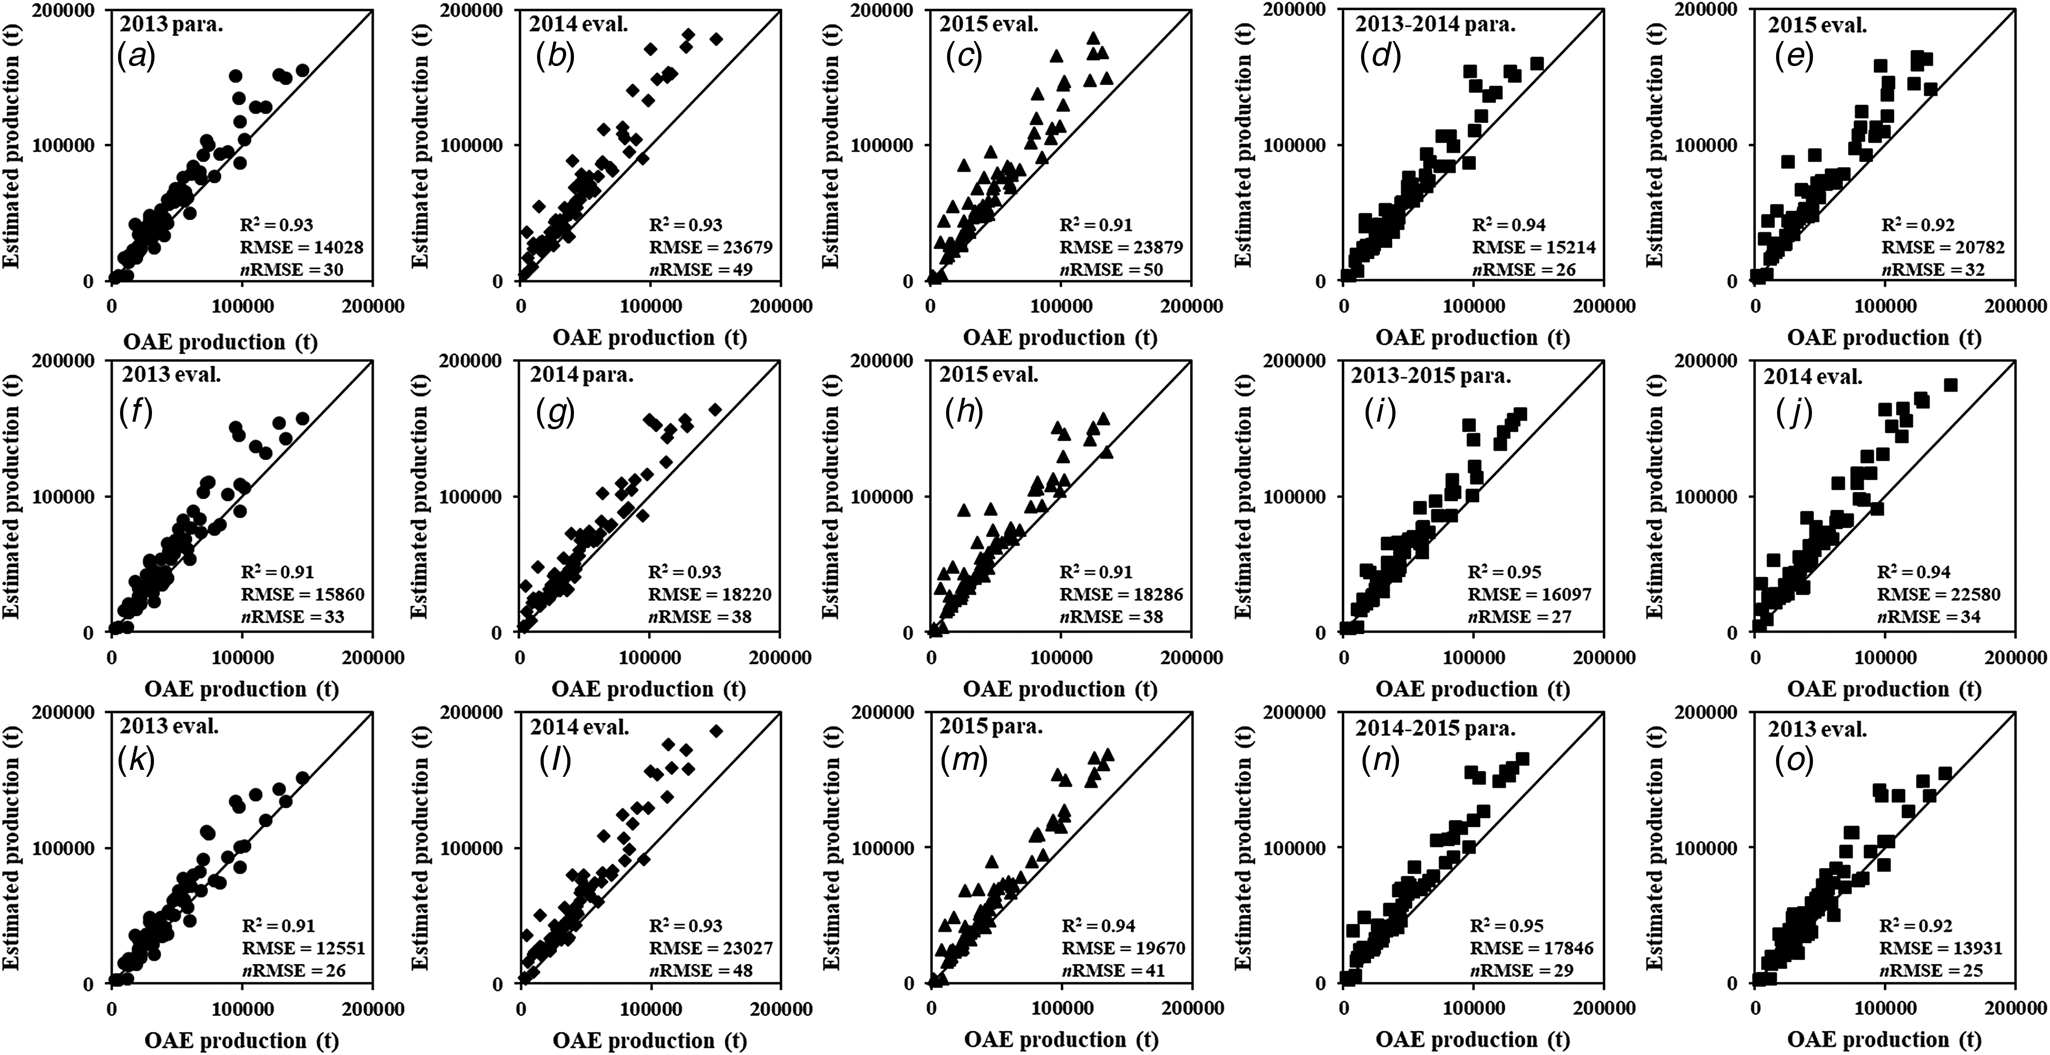
Table 4 shows the estimated and the OAE reported values of the total production for KDML 105 rice for the 2013–2015 growing seasons for all cases of parameterization and evaluation. In all cases, the Rice4cast shell and its MDS over-estimated rice production of the study area as compared to the OAE statistics, with the differences ranging from 0.5 to 1.4 Mt or +0.13 to +0.39 of the corresponding OAE values (Table 4). Even in the parameterized years for which the estimated rice yield was intentionally adjusted to fit the corresponding OAE reported yield, the differences between the estimated production and the corresponding OAE reported production were still substantial, ranging from 0.7 to 1.1 Mt (+0.19 to +0.31 proportion of OAE production) in the years with 1-year data parameterization and from 0.8 to 1.1 Mt (+0.23 to +0.29 proportion of OAE production) for the years with 2-year data parameterization. More over-estimations were shown for the years that were evaluated, with the differences ranging from 0.5 to 1.4 Mt (+0.13 to +0.39 proportion of OAE production) for 1-year data parameterization and from 0.6 to 1.4 Mt (+0.17 to +0.37 proportion of OAE production) for 2-year data parameterization (Table 4).
Reported total KDML 105 rice production (million tons: Mt) from OAE and estimated production from Rice4cast shell system for 77 districts in Thailand

Bold figures were evaluation years, + sign indicates an over-estimation by Rice4cast shell.
The over-estimation of KDML 105 rice production is clearly shown in Fig. 5 when the estimated rice production for the individual 77 districts is compared to the corresponding OAE production for all parameterized and evaluated years. Of the 15 cases (Figs 5(a)–(o)), only five gave moderate estimation of rice production with the Rice4cast shell (Figs 5(d), (i), (k), (n), (o)), with nRMSE ranging from 25 to 29, while the remaining ten showed a poor prediction of rice production, with nRMSE ranging from 30 to 50. Although the R 2 values are quite high (0.91–0.95) in all the cases, they were not a relevant indicator as they indicate the goodness of fit of the estimations around the regression lines, not around the 1:1 lines which were the basis for the comparisons in the current study.
Comparison of OAE reported and estimated rice production of KDML 105 rice variety using 1-year data set for parameterization (para.) and the remaining 2-year data sets for evaluation (eval): Set 1 (2013 para) – (a), (b), (c); Set 2 (2014 para) – (f), (g), (h); Set 3 (2015 para) – (k), (l), (m); and using 2-year data sets for parameterization (para.) and the remaining 1-year data set for evaluation (eval): Set 4 (2013–2014 para) – (d), (e); Set 5 (2014–2015 para) – (i), (j); Set 6 (2013–2015 para) – (n), (o).

Discussion
The main aim of the current study was to demonstrate the capability of an integrated agro-informatics system (the Rice4cast shell) in forecasting the total production of KDML 105 rice variety for Thailand in a given year well in advance of the crop harvesting period, utilizing data collected by various government agencies and a process-oriented crop simulation model for rice (the CSM-CERES Rice model). There were two aspects of the proposed system to be considered: (1) the capability of the Rice4cast shell to integrate the required agro-informatics data and the CSM-CERES Rice model to generate a forecast of KDML 105 rice production for Thailand in a given year, and (2) the accuracy of the forecast as it was important for the KDML 105 rice stock management of the country.
The capability of the Rice4cast shell in generating production forecasts for different areas and for different years from the required collected data and a rice simulation model was well illustrated by the results of the current study. The system is menu-driven and provides a user-friendly interface for easy access to available data as well as retrieval of an updated rice planted areas map from the GISTDA website (https://rice.gistda.or.th), allowing a user to create EMUs and enter required parameters for the CSM-CERES-Rice model to generate rice yield for the target districts. With the retrieval of the planted areas and planting dates from the GISTDA website, the production of KDML 105 rice for the target districts was generated, and finally, the forecast of the country production of KDML 105 for a given year was derived. The question was whether such a forecast was sufficiently accurate.
In evaluating the accuracy of the forecast, the OAE annual data sets on production, area planted and yield of KDML 105 for the study area were used as a reference because they were recognized as the authorized official statistical data of the country. The KDML 105 rice production forecast in the current study was a macro prediction, thus, the agreement between the absolute value of the forecast and the OAE report for the country total production was more important than the agreement between the forecasted and the OAE production values for the individual districts, as indicated by the R 2, RMSE and nRMSE values.
The results clearly show that, in almost all the cases, the forecasted total production values were substantially higher than the reported total production values from OAE, even in the parameterized years. This clearly indicated the over-estimation of the methodology. Even the lowest difference still amounted to 0.5 Mt per year, and many of them were more than 1 Mt in a year. These differences were sufficiently large to have significant implications on the KDML 105 rice stock management decisions for the country. As total production came from total area (ha) × average yield (t/ha), the discrepancy could come from the difference in the total area or the difference in the average yield or both.
The results of yield prediction show variations in the differences between the forecasted yield and the corresponding reported OAE yield for the different years for both the average yield and the individual district yield. For this assessment, only the evaluated years should be considered, as in the parameterized year, the yield of the individual districts was intentionally adjusted (parameterized) to be close to the OAE district yield. Although the goodness of fit of the yield predictions for all evaluations was either good or fairly good, as judged by the values of nRMSE, the differences between the predicted and the OAE average yield varied somewhat among years. It appeared that the year of parameterization affected the predictability of the model to some extent for the evaluation years. For example, the 2014 parameterization resulted in a predicted yield for 2013 and 2015 that was close to the corresponding OAE yield, while the 2013 parameterization resulted in larger over-predictions of yield for 2014 and 2015, but the 2015 parameterization resulted in under-prediction of yield for 2013 but an over-prediction for 2015. Similar results were also shown for the 2-year data parameterization. However, no clear advantage of parameterization with either 2-year or 1-year data was observed. Overall, the results mostly show over-estimations of rice yield, but the values were not significantly large.
The effect of a parameterized year on the predictability of the model for the corresponding evaluated years could be explained in term of differences in weather conditions between the parameterized and the evaluated years. In 2013, the rainy season started in mid-May and rainfall was well-distributed throughout the growing season with a total of 1200 mm. In 2014, rainfall was erratic with a total of 608 mm, much less than the 30-year average. Although the rainy season in this year started at the end of June, farmers were able to begin their planting activities in August. In 2015, the rainy season started in the third week of May, with a total rainfall of 886 mm, which was in between the 2013 and 2014 growing seasons (Climatological Center of TMD, 2019a, 2019b, 2019c). These differences in weather conditions resulted in different planting dates of the rice crop in the 3 years studied, i.e. early planting (June 8) in 2013, late planting (August 2) in 2014 and mid-season planting (July 16) in 2015.
In the current study, the process of model parameterization was essentially adjusting the N-fertilizer rate until the predicted yield in the individual districts were close to the corresponding OAE yield, using the planting date of the crop in the parameterized year. It turned out that the parameterized rate of N-fertilizer was highest in the year with early planting (30 kg N/ha for 2013), was lowest in the year with late planting (16 kg N/ha for 2014) and was intermediate in the year with mid-season planting (22 kg N/ha for 2015). These rates were in line with the recommendation of the Rice Department to apply a lower rate of fertilizer for late planting than for early planting (BRRD, 2010). In the model evaluation for 1-year data parameterization, the rate of nitrogen used in model simulation in the evaluated years was the one obtained from the parameterized year with different planting date. Thus, the rates of N-fertilizer used in the three series of the model evaluation were inappropriate for the dates of planting in the respective evaluated years. This also happened in the cases of 2-year data parameterization in which a parameterized N-rate was essentially the average of a pair of parameterized years with different planting dates from that of the corresponding evaluated year.
Although the CSM-CSRES-Rice model overall performed fairly well in predicting rice yield under different weather conditions, the above discussion suggested that the accuracy of yield prediction by the model could be further improved by using an N-fertilizer rate appropriated to the planting date of the rice crop in the predicting year. In the current study, parameterized rates of N-fertilizer had been derived for early, mid-season and late planting dates of the rice crop. In actual practice, the rice production forecast for a given year would be done during the start of the growing season, and both planted area and planting date would be retrieved from GISTDA website. Thus, at the time of model simulation, the planting date for the forecasting year should be known, and the parameterized N-fertilizer rate suitable for the identified planting date could be chosen for model simulation. This would make yield prediction more accurate. This suggestion, however, should be evaluated with long-term data.
The results of planted area estimation clearly show that the total planted areas of GISTDA were significantly more than the OAE values in all the years, especially in 2014 and 2015. Furthermore, the OAE values also were the reported planted area. However, production should be derived from multiplying yield by harvested area. Thus, if the OAE production value is divided by the OAE reported rice yield of the same year, the harvested area of that year could be derived. From such an estimation, the KDML 105 harvested areas in 2013, 2014 and 2015 turned out to be 1.55, 1.62 and 1.62 Mha, respectively, less than the OAE planted areas in the corresponding years (1.75, 1.74 and 1.72 Mha, respectively), and much less than the planted areas estimated from GISTDA (1.86, 2.02 and 2.08 Mha, respectively). In a given year, the difference between the planted area and the harvested area would be from the damaged area, mainly from drought, flood, diseases and pests. As the values of the production forecasts were calculated from GISTDA planted areas, certainly, this would result in over-estimations of KDML 105 rice productions in the individual years. The similarity of the graph patterns in planted areas and total rice production compared to those for the simulated rice yield and total rice production suggests that over-prediction of total production was largely due to the over-estimation of rice planted areas by GISTDA data sets, which in the calculation did not account for the damaged area particularly from drought and flood which normally occurred in Northeast Thailand. Thus, the inaccuracy (over-estimation) of the production forecast was primarily from the use of inappropriate area data in the estimation, i.e. using planted area rather than harvested area. Since production forecasting would be done early in the season, only planted areas from GISTDA would be available. To improve the accuracy of production forecast, the planted areas from GISTDA should be adjusted down to account for damage areas, i.e. estimating the harvest areas for use in the calculation of production forecast. The OAE annual statistics also reported the damage areas of the rice crop. Long-term records of the OAE could be used in estimating the annual percentage of damage areas of rice for use in area adjustment in the calculation of production forecast.
In the future, it is recommended to implement a localized and participatory data collection system for rice production at the village level. A ‘Village Data Working Group’ should be established to be responsible for collecting and reporting all field-level rice production activities, e.g. planting date, planted area, date, rate and amount of fertilizer application, harvesting date, harvested area and rice yield. A farmer-friendly data management system that allows for both offline and online reporting and visualization should also be developed. These data are required not only for production forecasting but also for implementing other government policies, particularly precision farming and large-scale management of the rice crop. For production forecasting, these data sets could eventually be used to re-parameterize and improve the model predictability of rice yield for the years with early planting, normal planting and late planting. Furthermore, the data could also be used to adjust for the un-harvested rice planted areas at the end of the growing season to improve the accuracy of the seasonal KDML 105 rice production forecast for Thailand.
Conclusion
The research presented here provides evidence that the Rice4cast integrated agro-informatics shell can be used to predict fragrant rice production for the 77 districts of 11 provinces in Thailand, covering 0.94 of planted area of fragrant rice in the country. However, the accuracy of the forecast of total KDML 105 rice production needs to be improved, especially to account for the difference between the GISTDA planted area which is used in the production estimation and the harvested area which is the basis for calculating the reported production. The system, however, can also facilitate the simulation of rice yield at the field level under various management, climatic and soil conditions within the capability of the CSM-CERES-Rice model, thus, can be used in various applications, e.g. evaluating seasonal yield variations, comparing different management options, etc. The system can be further developed to include other rice cultivars and other crop models. The system, thus, is a practical and valuable tool for decision making by policymakers, government and private agencies, and also farmers, not only in Thailand but in other countries as well.
Acknowledgements
We are grateful for the constructive comments from two anonymous reviewers and we appreciate the valuable suggestions provided by Dr Carol Wilkerson for improvement of the English language.
Financial support
This research was partially supported by four research grants CMU-TRF-RDG58A0013, CMU-TRF-SRC5920201, CMU-TRF-SRC6020201 and CMU-TRF-SRC6220005. All products in this publication are solely for the purpose of KDML 105 fragrant rice production forecast development and do not imply recommendation or endorsement by The Thailand Research Fund (TRF).
Conflict of interest
None.
Ethical standards
Not applicable.