Implications
We estimated genetic (co)variance components and analysed possible genotype by environment (G×E) interactions in dual-purpose Black and White (DSN) and Holstein Friesian (HF) dairy cows based on defined herd descriptors via multiple-trait animal models (MTAM). Generally, larger heritabilities and additive-genetic variances for both genetic lines were observed within ‘superior’ herd groups (e.g. herds with higher milk production levels). Genetic correlations lower than 0.80, especially for low heritability functional traits, indicated possible G×E interactions. Different genetic parameters in different herd groups, and indications for possible G×E interactions, imply consideration of herd descriptors in genetic evaluations.
Introduction
Daughter records of influential artificial insemination (AI) sires are available in different environments. Such daughter distribution allows estimations of genetic correlations between same traits across country borders, that is, studies on G×E interactions for country classifications. Furthermore, having focus on production system characteristics, bulls can be ranked according to environmental-specific breeding values (Hammami et al., Reference Hammami2009). For bull comparisons across country borders, Schaeffer (Reference Schaeffer1994) developed the multiple-trait across country evaluation methodology. Instead of country borders, Weigel and Rekaya (Reference Weigel and Rekaya2000) suggested a ‘borderless clustering’ approach for genetic evaluations of sires, where herds were allocated into different clusters based on their management practices, climatic conditions or genetic herd architectures. The idea behind this approach is that herds located in different countries may be more similar regarding management, climate and genetic compositions, than herds from the same country. Against this background, various studies considered the aspect of G×E interactions, defining different environments (Weigel and Rekaya, Reference Weigel and Rekaya2000), feeding systems (Kolver et al., Reference Kolver, Rocher, De Veth, Thorne and Napper2002) or management and housing characteristics (Fatehi et al., Reference Fatehi, Stella, Shannon and Boettcher2003) within and across countries. In addition, phenotypic herd trait characteristics were used as environmental descriptors, such as herd production levels (Kolmodin et al., Reference Kolmodin, Strandberg, Madsen, Jensen and Jorjani2002). However, they identified minor re-rankings of sires, only when studying the extreme herd production levels. Instead of a MTAM application, Kolmodin et al. (Reference Kolmodin, Strandberg, Madsen, Jensen and Jorjani2002) studied phenotypic and genetic variations for protein yield on a continuous herd scale via reaction norm models. In this regard, most of the G×E interaction studies were conducted in large dairy cattle populations, especially in HF.
European milk market changes with decreasing prices and increasing fodder costs force dairy farmers to switch from conventional to alternative dairy production systems, for example, changing from high-input indoor to low-input pasture based production. However, there are certain requirements for dairy cows kept in grazing systems, regarding metabolic stability, robustness and fertility (Dillon et al., Reference Dillon, Buckley, O’Connor, Hegarty and Rath2003). Differences between intensive indoor systems and grazing systems with respect to nutrient contents of feedstuff specifically should affect high yielding HF breeds (Dillon et al., Reference Dillon, Buckley, O’Connor, Hegarty and Rath2003). Due to their long process of adaptation to grassland or ecological production systems, we hypothesize that so-called indigenous dual-purpose cattle are more robust to challenges in harsh environments. In such context, the definition of robustness also implies quite homogeneous genetic values and genetic (co)variance components with environmental alterations (König, Reference König2017). The DSN cattle have the ability to convert pasture into milk efficiently, without feeding concentrates in small-scale grassland or organic family farms. Belonging to the lowland breeds, DSN cattle originated from the coastal grassland regions of northern Germany. Black and White cattle populations from the Netherlands and Poland are descendants from common German founders, and considered as a robust breed for similar grassland production systems (Nauta et al., Reference Nauta, Veerkamp, Brascamp and Bovenhuis2006). Hence, in order to provide optimal genetic material for specific European environments, a borderless estimation of breeding values should be taken into consideration, instead of strict national genetic evaluations for DSN. Nevertheless, the quality of across country genetic evaluations or borderless clustering approaches via MTAM strongly depends on genetic connectedness among clusters or herd strata (König et al., Reference König, Simianer and Swalve2002).
There is only limited research addressing the impact of heterogenic environmental effects and of genetic connectedness on genetic (co)variance estimates in endangered native dual-purpose cattle breeds. Hence, the objectives of this study were (i) to estimate genetic (co)variance components in discrete herd environments via MTAM applications, and (ii) to study genetic correlation estimates across herd environments against the background of genetic connectedness between herd groups. Results for DSN were compared with genetic parameter estimates from HF and ‘mixed’ breed analyses, using the same herd database and same strategies for data stratification according to environmental and herd descriptors.
Material and methods
Dual-purpose cattle herds and traits
Herds were located in three major geographic regions: (1) intensive grazing systems on coastal marshlands, (2) large-scale farms in one region of former East Germany and (3) small-scale family farms in the middle and the south of Germany. Apart from the eastern German region, farms predominantly reflected pasture based low input production systems.
The study included 3659 DSN and 2324 HF cows from parities one to three, kept in 46 different herds. Herds always kept DSN cows, but in most cases, herds were ‘mixed’ herds (Mixed) including cow records from both genetic lines HF and DSN simultaneously. The percentage of DSN cows within herds ranged from 11% to 100%, with an average of 59.59%. In calving years 2014 and 2015, herd sizes ranged from 11 to 1712 cows, with an average of 130 cows per herd, and a SD of 250 cows. The large SD for herd size is mainly due to one large-scale farm from the German Federal state Brandenburg, located in East Germany. In the calving year 2014, all other herds kept less than 100 cows.
It was our main motivation to study genetic parameters for different genetic lines under challenging stress situations. Regarding black and white genetic line comparisons for novel traits, May et al. (Reference May, Brügemann, Yin, Scheper, Strube and König2017) found significant differences for trait recordings close to the calving date. Hence, with a focus on the naturally occurring negative energy balance in the early lactation period, traits of interest were test-day records from the 1st official test-day after calving for a production trait (milk yield: Milk-kg), an indicator trait for udder health (somatic cell score (SCS)) and a trait reflecting metabolic stability (fat-to-protein ratio (FPR)). For test-day trait preparation, we considered a short time window, representing only 1st test-day records between 10 and 30 days in milk. The mean value for days in milk comprised 22.12 days, with a SD of 5.99 days. Cow test-day traits represented the first three lactations from calving years 2010 to 2015. Descriptive statistics for the test-day traits are given in Table 1.
Descriptive statistics (SD; minimum (Min.); maximum (Max.)) for milk yield (Milk-kg), somatic cell score (SCS) and fat-to-protein ratio (FPR) from the 1st official test-day after calving for the three genetic lines German Black and White dual-purpose cattle (DSN), Holstein Friesian (HF) and a mixture of both (Mixed)

Herd grouping
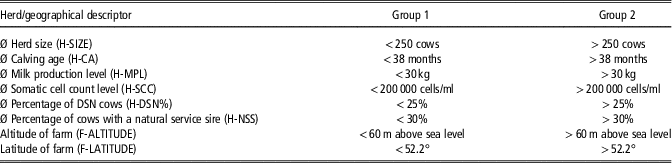
The chosen herd descriptors for herd grouping considered classical management factors (average herd size, average herd calving age), production levels (average herd milk production level, average herd somatic cell count level), genetic characteristics (average percentage of DSN cows within herds, average percentage of cows with a natural service sire) and strict environmental descriptors (altitude and latitude of farm). Consequently, eight discrete descriptive herd descriptors were defined for herd grouping (Table 2): herd size (H-SIZE), herd calving age (H-CA), herd milk production level (H-MPL), herd somatic cell count level (H-SCC), percentage of DSN cows (H-DSN%), percentage of cows with a natural service sire (H-NSS), altitude of farm (F-Altitude) and latitude of farm (F-Latitude). Herd grouping according to herd descriptor means considered all cows (i.e. HF and DSN) from the same herd. An overview for the number of cows within herd groups for all herd descriptors is given the Supplementary Table S1.
Applied herd and geographical descriptors and respective thresholds for the classification of cattle herds into herd group 1 or herd group 2

DSN=German Black and White dual-purpose cattle.
In addition, herds were clustered considering all eight herd descriptors simultaneously. The FASTCLUS procedure (SAS Institute Inc., 2008) was applied, in order to generate disjoint herd clusters based on Euclidean distances for standardized herd descriptors (herd descriptor variables were standardized applying the STANDARD procedure in SAS (SAS Institute Inc, 2008)). In this regard, herds were allocated to three clusters (Supplementary Table S2).
Genetic relationships within and between groups and clusters
Inbreeding coefficients and pedigree based genetic relationships between and within herd descriptor groups and clusters were calculated applying the software package CFC (Sargolzaei et al., Reference Sargolzaei, Iwaisaki and Colleau2006). The pedigree considered 74 319 individuals from birth years 1925 until 2013.
Estimation of genetic parameters
All genetic analyses were done separately for all genetic lines × herd descriptor combinations. For the MTAM applications, same traits were considered as different traits in herd groups 1 and 2. Estimation of genetic (co)variance components was accomplished in bivariate runs, using the AI-REML algorithm from the software packages VCE6 (Groeneveld et al., Reference Groeneveld, Kovac and Mielenz2010) and DMU (Madsen and Jensen, Reference Madsen and Jensen2012). The same cow cannot perform simultaneously in groups 1 and 2. Hence, non-existing residual covariances among traits were assumed. Same analyses were performed (i) considering all cows from both genetic lines DSN and HF from the same herd (i.e. Mixed analyses), (ii) only considering cows from the DSN line and (iii) only considering cows from the HF line. In matrix notation, the genetic statistical model including the two traits was:
 $$\left[ \rm{\matrix{ \bf {y_{1} } \cr \bf {y_{2} } \cr } } \right]{\equals}\rm\left[ {\matrix{ \bf {X_{1} b_{1} {\plus}Z_{1} u_{1} {\plus}W_{1} p_{1} {\plus}e_{1} } \hfill \cr \bf {X_{2} b_{2} {\plus}Z_{2} u_{2} {\plus}W_{2} p_{2} {\plus}e_{2} } \hfill \cr } } \right]$$
where y 1 and y 2 were vectors of test-day records for cows in groups 1 and 2, respectively; b 1 and b 2 the vectors of fixed effects including the genetic line effect in the Mixed analyses, and calving year, calving season, herd and parity classes in all studies for the two traits; u 1 and u 2 the vectors of additive-genetic animal effects for the two traits; p 1 and p 2 the vectors of permanent environmental effects for the cows for the two traits (repeated measurements due to trait recording in different parities); and e 1 and e 2 the vectors for the random residual effects for both traits. X 1 , X 2 , Z 1 , Z 2 , W 1 and W 2 the incidence matrices for b 1 , b 2 , u 1 , u 2 , p 1 and p 2 , respectively. Due to the narrow time window for days in milk (see the trait description section), we did not account for days in milk in mixed model analyses. In preliminary analyses without genetic effects, we run models with and without days in milk, and least-square means for test-day traits were almost identical. Hence, in order to reduce the number of effects in multiple-trait analyses for the small DSN population, we decided to exclude the days in milk effect from all genetic models.
The variance-covariance structure for the random effects was:
 $${\rm var}\left[ {\matrix{ \bf{u_{1} } \hfill \cr \bf{u_{2} } \hfill \cr \bf{p_{1} } \hfill \cr \bf{p_{2} } \hfill \cr \bf{e_{1} } \hfill \cr \bf{e_{1} } \hfill \cr } } \right]{\equals}\left[ {\matrix{ \rm{g_{{11}} {\bf{A}} } \hfill & \rm{g_{{12}} {\bf{A}} } \hfill & 0 \hfill & 0 \hfill & 0 \hfill & 0 \hfill \cr \rm{g_{{21}} {\bf{A}} } \hfill & \rm{g_{{22}} {\bf{A}} } \hfill & 0 \hfill & 0 \hfill & 0 \hfill & 0 \hfill \cr 0 \hfill & 0 \hfill & {\rm{\sigma _{{p1}}^{2} \bf l_{{p1}} }} \hfill & 0 \hfill & 0 \hfill & 0 \hfill \cr 0 \hfill & 0 \hfill & 0 \hfill & \rm {\sigma _{{p2}}^{2} \bf l_{{p2}} } \hfill & 0 \hfill & 0 \hfill \cr 0 \hfill & 0 \hfill & 0 \hfill & 0 \hfill & \rm{r_{{11}} } \hfill & 0 \hfill \cr 0 \hfill & 0 \hfill & 0 \hfill & 0 \hfill & 0 \hfill & \rm{r_{{22}} } \hfill \cr } } \right]$$
where g11 and g22 were additive-genetic variances for the two traits; g12 and g21 were additive-genetic covariances between both traits; A was the additive-genetic relationship matrix,
 $\rm\sigma _{{p1}}^{2} $
and
 $\rm\sigma _{{p2}}^{2} $
were the variances for permanent environmental effects for both traits;
 $\rm I_{{p_{1} }} $
and
 $\rm I_{{p_{2} }} $
were identity matrices for the cows with records for both traits; r11 and r22 were residual variances for both traits.
Standard errors of genetic correlations were calculated according to Lynch and Walsh (Reference Lynch and Walsh1998):
 $$\eqalignno{ {\rm var(}r_{g} {\rm ){\equals}} & \left( {r_{g}^{2} } \right)\left[ {{{{\rm var}(g_{1} )} \over {4g_{1}^{2} }}{\plus}{{{\rm var}(g_{2} )} \over {4g_{2}^{2} }}{\plus} {{{\rm var}(g_{{12}} )} \over {g_{{12}}^{2} }}} \right \cr &\quad \left {\plus} {{{\rm cov}(g_{1} ,g_{2} )} \over {2g_{1} g_{2} }}{\minus}{{{\rm cov}\left( {g_{1} ,g_{{12}} } \right)} \over {g_{1} g_{{12}} }}{\minus}{{{\rm cov}(g_{{12}} ,g_{2} )} \over {g_{{12}} g_{2} }}} \right]$$
where
 ${\rm var}\;\left( {g_{1} } \right) \;{\rm and \;var}\;\left( {g_{2} } \right) $
are the variances of the genetic variances for the two traits,
 $g_{{12}} $
the genetic covariance between traits 1 and 2,
 ${\rm var}(g_{{12}} )$
the variance of the genetic covariance between traits 1 and 2,
 ${\rm cov}(g_{1} ,g_{2} )$
the covariance between the genetic variance of traits 1 and 2,
 ${\rm cov}\left( {g_{1} , g_{{12}} } \right)$
the covariance between the genetic variance of trait 1 and the genetic covariance of the two traits and
 ${\rm cov}(g_{{12}} ,g_{2} )$
the covariance between the genetic covariance of the two traits and the genetic variance of trait 2.
Results
Heritabilities and variance components within herd groups
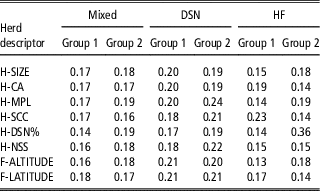
Especially for Milk-kg and for all genetic line analyses (Table 3), heritabilities and were substantially larger in herd groups indicating superior herd management, for example, high productivity herds (group 2 for H-MPL). In addition, a higher percentage of DSN cows within herds (H-DSN% group 2) contributed to larger heritabilities for Milk-kg. Larger heritabilities in superior herd management groups were mainly due to increasing additive-genetic variances. All variance components from the genetic analyses for Milk-kg stratified by genetic lines are given in the Supplementary Table S3. For Mixed, additive-genetic Milk-kg variances were 4.42 kg2 in H-DSN% group 1, but 6.63 kg2 in group 2. Corresponding values were 3.86 kg2 in group 1 and 6.37 kg2 in group 2 from the separate DSN analysis, and 4.62 kg2 in group 1 and even 11.56 kg2 in group 2 from the separate HF analysis. With regard to herd stratifications according to H-NSS, and according to classical environmental (geographical) descriptors F-ALTITUDE and F-LATITUDE, additive-genetic variances and heritabilities for Milk-kg were quite constant in groups 1 and 2 for all genetic line analyses. In HF, heritabilities and additive-genetic variances for Milk-kg were substantially larger in H-SCC group 1 (low SCC), but were almost identical in groups 1 and 2 for Mixed and for DSN.
Heritabilities (h2) for milk yield from the 1st test-day after calving within groups of herd descriptors stratified by genetic lines (Mixed=DSN+HF; DSN=German Black and White dual-purpose cattle; HF=Holstein Friesian) (SE of h2 for all calculations <0.09)

H-SIZE=Ø Herd size; H-CA=Ø Calving age; H-MPL=Ø Milk production level; H-SCC=Ø Somatic cell count level; H-DSN%=Ø Percentage of DSN cows; H-NSS=Ø Percentage of cows with a natural service sire; F-ALTITUDE =Altitude of farm; F-LATITUDE=Latitude of farm.
Permanent environmental variance components for Milk-kg mostly followed the pattern of additive-genetic variances in groups 1 and 2 (Supplementary Table S3): Herd groups indicating a superior environment or herd management (larger herds, lower calving age, lower herd level for SCC, higher herd production level) showed larger permanent environmental variances. In herd groups indicating suboptimal herd management, permanent environmental variances were smaller in the DSN and Mixed populations, compared to corresponding group estimates in HF. Apart from H-SCC, also residual variances for Milk-kg were larger in herd groups indicating a superior herd management (Supplementary Table S3).
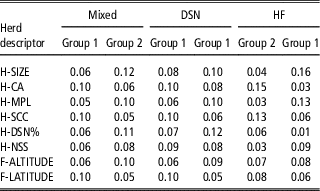
For test-day SCS, all genetic lines showed a similar trend regarding heritabilities in herd descriptor groups for H-SIZE, H-CA, H-MPL, H-SCC, F-ALTITUDE and F-LATITUDE (Table 4). Again, heritabilities were larger in herd groups indicating a superior herd management, that is, in the larger herds allocated to group 2, in the herds with a lower calving age allocated to group 1, in the herds with a higher milk yield production level allocated to group 2, and in the herds with a lower somatic cell count level allocated to group 1. Moreover, for SCS, major impact on heritability increase in superior herd environments was due to larger additive-genetic variances (Supplementary Table S4). Heritabilities for SCS within superior herd groups were larger for HF compared to corresponding groups in the DSN or Mixed analyses. These large SCS heritabilties for HF are due to a pronounced additive-genetic variation. The largest additive-genetic variance for SCS was 0.51, and the largest heritability was 0.16, both estimated in HF for H-SIZE group 2. However, differences in additive-genetic variances across genetic lines were larger than heritability differences, due to larger residual variances in HF. In contrast to Milk-kg, residual variances for SCS from all genetic line analyses were smaller in the superior herd groups compared to the respective suboptimal herd groups for H-SIZE, H-CA, H-MPL and H-SCC (Supplementary Table S4).
Heritabilities (h2) for somatic cell score from the 1st test-day after calving within groups of descriptive herd descriptors stratified by genetic lines (Mixed=DSN+HF; DSN=German Black and White dual-purpose cattle; HF=Holstein Friesian) (SE of h2 for all calculations <0.09)

H-SIZE=Ø Herd size; H-CA=Ø Calving age; H-MPL=Ø Milk production level; H-SCC=Ø Somatic cell count level; H-DSN%=Ø Percentage of DSN cows; H-NSS=Ø Percentage of cows with a natural service sire; F-ALTITUDE=Altitude of farm; F-LATITUDE=Latitude of farm.
For test-day FPR (Table 5), in all groups and for all herd descriptors, only minor heritability differences were identified. Additive-genetic variances were almost identical, especially for Mixed and DSN in a quite narrow range from 0.005 to 0.007 (Supplementary Table S5). Hence, minor alterations in heritabilities for FPR were due to variations in the residual variance component. Nevertheless, also for FPR, heritabilities for FPR were larger in the superior herd management groups for H-SIZE (group 2), for H-CA (group 1), for H-MPL (group 2) and for H-SCC (group 1). This was the case for all genetic line analyses. Almost identical heritabilities and variance components across herd groups and genetic lines were identified for the geographical descriptors F-ALTITUDE and F-LATITUDE, especially when comparing within-group estimates from the Mixed and DSN analyses. Interestingly, only for the HF analysis, the FPR heritability was substantially lower (0.02) in herds with a larger percentage of DSN cows (H-DSN% group 2), compared to the FPR heritability in group 1 for H-DSN% (0.10). Such heritability differences for FPR between H-DSN% groups 1 and 2 were not observed for Mixed and DSN. Similarly, herd grouping according to H-NSS was associated with larger heritability differences between groups 1 and 2 in HF (0.18 and 0.07, respectively) compared to group heritabilties in Mixed and DSN. Overall, heritability alterations for FPR were most obvious in HF (0.02–0.22), but in a narrow range in the Mixed line (0.09 to 0.17) and in DSN (0.11 to 0.17). For FPR, quite small permanent environmental variance components in the range from 0.0001 to 0.006 were estimated for all groups across genetic lines (Supplementary Table S5).
Heritabilities (h2) for fat-to-protein ratio from the 1st test-day after calving within groups of descriptive herd descriptors stratified by genetic lines (Mixed=DSN+HF; DSN=German Black and White dual-purpose cattle; HF=Holstein Friesian) (SE of h2 for all calculations <0.03)

H-SIZE=Ø Herd size; H-CA=Ø Calving age; H-MPL=Ø Milk production level; H-SCC=Ø Somatic cell count level; H-DSN%=Ø Percentage of DSN cows; H-NSS=Ø Percentage of cows with a natural service sire; F-ALTITUDE=Altitude of farm; F-LATITUDE=Latitude of farm.
Genetic correlations between same traits recorded in different herd groups and clusters
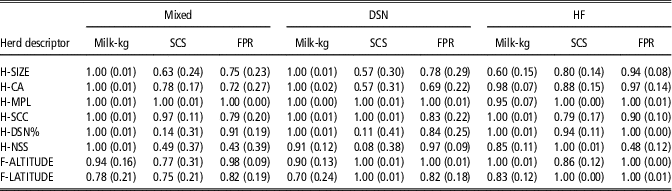
From 72 bivariate runs, 29 genetic correlations were exactly or very close to 1 (Table 6). Most of these large genetic correlations with a value of 1 were estimated for Milk-kg (result from 14 bivariate runs), being the trait with the largest heritability. Generally, genetic correlations were larger for Milk-kg (range from 0.60 to 1) compared to estimates for the low heritability functional traits SCS (range from 0.08 to 1) and FPR (range from 0.43 to 1). Regarding genetic correlations for Milk-kg, estimates lower than 0.80 were found for the geographical descriptor F-LATITUDE (Mixed=0.78, DSN=0.70), and for the herd descriptor H-SIZE (HF=0.60). Somatic cell score was the trait exhibiting the smallest genetic correlations, especially in the DSN analyses when stratifying herds according to H-DSN% (0.11) or according to H-NSS (0.08). Furthermore, the stratification according to H-SIZE and H-CA with genetic correlation estimates lower than 0.78 indicated G×E interactions for Mixed (SCS, FPR) and for DSN (SCS, FPR). For all genetic lines, genetic correlations were quite large when grouping herds according to herd means for productivity (H-MPL) and udder health (H-SCC). Genetic correlations were in the range from 0.95 to 1 (H-MPL), and in the range from 0.79 to 1 (H-SCC). For the herd management indicators H-SIZE and H-CA, genetic correlations were in a moderate to high range from 0.57 to 1. Holstein Friesian only displayed a few genetic correlations lower than 0.80 indicating G×E interactions (for the low heritability trait SCS), and for FPR when stratifying the data according to H-NSS. The proportions of genetic correlations lower than 0.80 were larger in Mixed and in DSN than in HF.
Genetic correlations with SE (in brackets) between same traits (milk yield (Milk-kg), somatic cell score (SCS) and fat-to-protein ratio (FPR)) from herd groups 1 and 2 of the defined herd descriptors, stratified by genetic lines (Mixed=DSN+HF; DSN=German Black and White dual-purpose cattle; HF=Holstein Friesian)

H-SIZE=Ø Herd size; H-CA=Ø Calving age; H-MPL=Ø Milk production level; H-SCC=Ø Somatic cell count level; H-DSN%=Ø Percentage of DSN cows; H-NSS=Ø Percentage of cows with a natural service sire; F-ALTITUDE =Altitude of farm; F-LATITUDE=Latitude of farm.
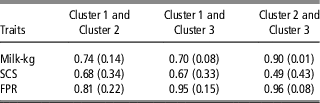
Regarding the different clusters (Table 7) in the Mixed breed analyses for the trait Milk-kg, genetic correlations were lower than 0.80 between cluster 1 and cluster 2 (0.74), and between cluster 1 and cluster 3 (0.70). In agreement with the across herd group analyses, genetic correlations were smaller for low heritability SCS (0.68 between cluster 1 and cluster 2, 0.67 between cluster 1 and cluster 3, and only 0.49 between cluster 2 and cluster 3) compared to moderate heritability Milk-kg.
Genetic correlations with SE (in brackets) between same traits (milk yield (Milk-kg), somatic cell score (SCS) and fat-to-protein ratio (FPR)) from different clusters for the Mixed breed analyses (Mixed=combined analyses for German Black and White dual-purpose and Holstein Friesian cattle)

Genetic relationships within and between herd groups and clusters
For most of the herd descriptors, genetic relationships within groups were larger for HF and DSN compared to the corresponding Mixed groups (Supplementary Figure S1). Apart from HF, relationships within groups 1 or 2 were always larger compared to between group relationships. For HF, between group relationships were larger compared to relationships within groups for herd stratifications according to H-MPL and H-NSS. As expected, herd grouping according to the genetic descriptor H-NSS implied large genetic relationships within group 1 (the group with a larger percentage of AI daughters), because a large fraction of cows in group 1 had the same sire. In addition, large within group relationships for groups 1 and 2 were identified for herd groupings according to the herd management descriptors H-MPL and H-CA. In most scenarios for Mixed, DSN and HF, stronger genetic relationships were found within groups representing the superior herd environment (H-MPL, group 2=high milk production level; H-SCC, group 1=low SCC; H-CA, group 1=low calving age; H-SIZE, group 2=large herds).
Associations between genetic correlations and relationship coefficients
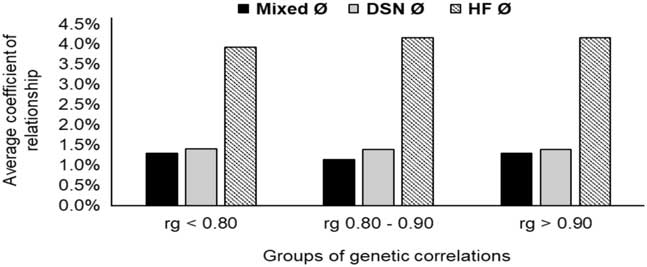
Figure 1 displays average coefficients of relationships between groups based on a ‘genetic correlation estimates’ categorization. For same r g – categories, coefficients of relationships were always largest for HF, but substantially lower and on a similar level for DSN and Mixed. Categorization of bivariate runs according to the r g – categories ‘r g <0.80’, ‘r g 0.80 to 0.90’ and ‘r g >0.90’ gave almost identical average coefficients of relationships between groups for same genetic lines. Hence, only a slight trend for larger genetic relationships between groups with increasing r g -estimates was identified, neglecting our hypothesis that genetic connectedness between groups has impact on rg estimates in MTAM.
Average coefficient of relationship (in %) between groups 1 and 2 (as defined in Table 2) for different classifications of genetic correlation estimates (rg) within genetic lines Mixed (DSN+HF), German Black and White dual-purpose cattle (DSN), and Holstein Friesian (HF).

Discussion
Heritabilities and genetic variances within herd groups and clusters
Ideally, random regression or reaction norm models should be applied to study genetic (co)variance components in dependency of both descriptors simultaneously, that is, in dependency of time and of continuous environmental alterations (Schaeffer, Reference Schaeffer2004). Nevertheless, such sophisticated modelling approaches require large datasets, especially for the estimation of reliable genetic parameters and breeding values at the extreme ends of the ‘days in milk’ scale (e.g. Yin and König, Reference Yin and König2018). In consequence, we applied more robust MTAM with a focus on one specific test-day and on only two herd descriptors in bivariate runs. Robust modelling implied quite small SE for heritabilities, and acceptable SE for genetic correlation estimates (see additional files S3, S4 and S5).
In most cases, for all genetic lines and traits, heritabilities and additive-genetic variances were larger in herd groups reflecting superior herd management. In this study, ‘superior management’ included larger herd sizes and thus automated farm processes, low calving ages, high milk yield and an improved udder health status. Results confirmed findings by Gernand et al. (Reference Gernand, Waßmuth, von Borstel and König2007) in HF populations, who identified superior management and low calving ages in large-scale herds, contributing to larger heritabilities and a pronounced genetic differentiation. Homogenous variance components and heritabilities across groups and genetic lines for F-ALTITUDE and F-LATITUDE suggest that these geographic descriptors were not considerably different environments, causing distinct genetic control of traits. Ojango and Pollott (Reference Ojango and Pollott2002) identified environmental impact on genetic parameter estimates due to the combined effect of climate and geography. In analogy, Fikse et al. (Reference Fikse, Rekaya and Weigel2003) identified genetic parameter variations for production traits when considering at least three environmental descriptors (within-herd standard deviation, peak milk yield, herd size) out of a set of 15 possible herd descriptors. In our study, four herd descriptors mainly contributed to the milk yield heritability differences between groups, including the cow associated herd descriptors H-MPL, H-SCC, H-DSN% and H-NSS. This finding in line with Yin and König (Reference Yin and König2018), who studied the impact of these herd descriptors in genomic studies. In contrast to Fikse et al. (Reference Fikse, Rekaya and Weigel2003), the classical environmental descriptors herd size and geography were of minor importance when explaining genetic trait variations. In our study, impact of herd descriptors on variance component estimates partly differed for Milk-kg and SCS. Accordingly, results from structural equation models suggest consideration of trait-specific environmental or herd descriptors, in order to describe variance heterogeneity depending on the trait of interest (Fikse et al., Reference Fikse, Rekaya and Weigel2003).
Additive-genetic variances and heritabilities, especially for milk-kg, increased with increasing intra-herd DSN percentages (group 2 for H-DSN%). Herds only keeping DSN, or herds with a large percentage of DSN cows, traditionally breed dual-purpose Black and White cows in grassland systems (Jaeger et al., Reference Jaeger, Scheper, König and Brügemann2018). In contrast, most of the herds with a small percentage of DSN cows recently converted from indoor to grazing systems. Against this background, one explanation could be an optimized grassland farm management for the herds in group 2 representing larger intra-herd DSN percentages, contributing to the fully phenotypic expression of their true genetic potential. In herds with a larger percentage of HF cows (group 1 for H-DSN%), intensive selection on milk production traits was a major breeding strategy during decades (König et al., Reference König, Lessner and Simianer2007). Following the theoretical principles of animal breeding, intensive selection decreases additive-genetic variances of quantitative traits. Falconer and Mackay (Reference Falconer and Mackay1996) referred to genetic architectures of quantitative traits, and mentioned the reduction of additive-genetic variance being proportional to the increase of inbreeding coefficients. More intensive selection in HF cows compared to DSN contributed to higher intra-herd inbreeding coefficients (i.e. in the herds in group 1 for H-DSN%), and, in consequence, reduced genetic variation. Regarding variance components for milk yield in superior herd groups according to herd size (H-SIZE group 2) and according to calving age (H-CA group 1), additive-genetic variances were larger in the Mixed group analyses compared to the studies basing only on DSN or HF subsets. In such context, we assume two effects contributing to genetic differentiation. The first aspect addresses the herd descriptor effect, that is, better differentiation in superior herd environments. Second, we noticed increasing genetic distances between DSN and HF due to different selection strategies during the past decades (Naderi, Reference Naderi2018), contribution to increasing additive-genetic variances in Mixed line studies.
Quite constant additive-genetic variances and heritabilities for Milk-kg within groups 1 and 2 for H-NSS, F-ALTITUDE and F-LATITUDE imply that these chosen environments or herd descriptors did not contrast enough in order to initiate different genetic mechanisms for Milk-kg with environmental alterations. Hammami et al. (Reference Hammami2009) stated that minor environmental differences mainly contribute to scaling effects, implying quite constant variance ratios in different environments. Nevertheless, also in HF, additive-genetic variances substantially differed in herd groups 1 and 2 for some single-herd descriptors. For example, HF cows showed a reduced genetic variation for Milk-kg in harsh or ‘challenging’ environments (i.e. high intra-herd SCC in group 2), but a considerable larger heritability and additive-genetic variance for Milk-kg in H-SCC group 1. Such results indicate environmental sensitivity for HF. Hence, two different mechanisms might explain variance component levels in high yielding HF. On one hand, there is the impact of intensive selection contributing to a decrease of genetic variation and to an increase of inbreeding (König and Simianer, Reference König and Simianer2006). However, on the other hand, environmental sensitivity contributes to alterations of breeding values with herd descriptor changes (Streit et al. Reference Streit, Reinhardt, Thaller and Bennewitz2013), implying an increase of additive-genetic variances. Byrant et al. (Reference Byrant, López-Villalobos, Pryce, Holmes, Johnson and Carrick2006) analysed production traits for a broad range of different feeding levels. ‘Environmental sensitivity’ was more obvious in high yielding North American HF, compared to New Zealand HF or Jerseys. In consequence, Byrant et al. (Reference Byrant, López-Villalobos, Pryce, Holmes, Johnson and Carrick2006) described North American HF strains as specialists (high production output in superior feeding level environments), and New Zealand HF and Jersey breeds as generalists, tolerating environmental changes. In addition, Kolmodin et al. (Reference Kolmodin, Strandberg, Madsen, Jensen and Jorjani2002) observed significant variation between sires with respect to daughter sensitivity in different farm environments. Sires with a high genetic merit for production traits reacted more sensitive to changes in herd environments than sires with low a genetic merit.
For SCS, environmental sensitivity (i.e. alterations of additive-genetic variances with environmental alterations) was stronger in HF compared to DSN and Mixed. Calus et al. (Reference Calus, Janss and Veerkamp2006) made similar observations for high yielding HF at the 1st test-day early in lactation. In high yielding cows, the lower resistance against major pathogens early in lactation causes clinical mastitis, contributing to increased variance components for SCS. On the other hand, small and quite constant SCS variance components early in lactation for DSN might be due to better adaptive mechanisms, and due to scaling effects (generally lower SCS levels in DSN).
Genetic correlations between herd groups and clusters, and genotype by environment interactions
Robertson (Reference Robertson1959) suggested a genetic correlation equal or lower than 0.80 as an indicator for G×E interactions. Genetic correlations between the same traits in groups 1 and 2 for the same environmental or herd descriptor were in the range from 0.08 to 1. Genetic correlations between same traits from different clusters ranged between 0.49 and 1. Genetic correlations for Milk-kg mostly exceeded 0.80. Correspondingly, using an international borderless clustering approach for Holstein, Zwald et al. (Reference Zwald, Weigel, Fikse and Rekaya2003) reported genetic correlations larger than 0.90 for lactation milk yield for most of the cluster combinations. In their study, only cluster 5 (=the cluster representing the dairy herds from New Zealand), showed lower genetic correlations with remaining clusters, in the range from 0.59 to 0.75. Hammami et al. (Reference Hammami2009) stated that differences in genetic (co)variance components for productions traits were mostly due to scaling effects. They deduced that small environmental differences within European countries do not justify separate breeding schemes in different environments. When stratifying the data via cluster analysis, genetic correlations for Milk-kg in the Mixed line were 0.74 between the first and second cluster, 0.70 between the first and the third cluster, and 0.90 between the first and third cluster (0.90). As suggested by Fikse et al. (Reference Fikse, Rekaya and Weigel2003), considering several herd parameters simultaneously contributed to production system diversity. Hence, we observed correlations very close to 1 for single herd descriptors, but not from the clustering approach.
In all genetic lines, the impact of environmental changes on genetic covariances and genetic correlations was more pronounced for low heritability SCS than for Milk-kg. These results are in agreement with Calus et al. (Reference Calus, Janss and Veerkamp2006), who identified genetic correlations in the broad range from 0.43 to 0.89 for SCS. Similar observations were made for low to moderate heritability FPR, with genetic correlations lower than 0.80 for different genetic lines × herd descriptor combinations. In contrast to Milk-kg, genetic correlations between clusters FPR were larger compared to genetic correlation estimates from single herd descriptor analyses, encouraging deeper analyses in this regard.
Best herd descriptors in terms of environmental sensitivity (i.e. small genetic correlations) for all genetic lines and traits were H-SIZE, H-CA and H-NSS. Accordingly, Osorio-Avalos et al. (Reference Osorio-Avalos, Menéndez-Buxadera, Serradilla and Molina2015) stated that herd management systems and herd size were most efficient criteria for herd grouping. Herd size was the most important herd variable in the international borderless clustering approach, and accordingly, receiving the highest herd variable weighting factor (Zwald et al. Reference Zwald, Weigel, Fikse and Rekaya2003).
Herd descriptor × trait combinations causing low genetic correlations differed between DSN and HF. Differences in genetic correlation estimates suggest that different herd descriptors have different importance in different genetic lines of Black and White dairy cattle. Having focus on small genetic correlations, one specific genetic line × trait combination (HF × Milk-kg) was strongly influenced by a herd management descriptor (H-SIZE), while another genetic line × trait combination (DSN × SCS) obviously responded to genetic herd descriptors (H-DSN% and H-NSS). Zwald et al. (Reference Zwald, Weigel, Fikse and Rekaya2003) considered both parameters herd size and the percentage of North American HF genes as important herd descriptors for HF cows. These findings are in agreement with the estimates from the present study, showing small genetic correlations especially for classifications according to H-SIZE and H-DSN%.
Impact of genetic relationships on genetic correlations
Stronger genetic relationships within herd descriptor groups and clusters than between group relationships depict the impact of management or environmental classifications on genetic herd compositions (Yin and König, Reference Yin and König2018). Quite high within-group relationships for H-MPL groups 2 for DSN and HF are due to intensive selection on milk yield in both genetic lines, leading to decreased genetic variability and strong genetic connectedness.
Clément et al. (2001) stated that even under an AI breeding program a poor genetic connectedness might be found as this would be the case for regionally operating AI organizations and small endangered breeds. Results from the present study reject our hypothesis, that is, that group relationships have impact on genetic correlation estimates. This was also an assumption phrased by König et al. (Reference König, Simianer and Swalve2002), because genetic correlations in protein yield between two regions were larger when basing the calculations on proven bulls with a large number of daughters in both regions, compared to an analysis only using young sires. Recently, Yin and König (Reference Yin and König2018) used genomic marker data from genotyped cows kept in large-scale contract herds, finding substantial alterations in genetic correlations when creating herd groups according to genomic intra-herd inbreeding coefficients. The explanation for differences compared to our present study might be due to different genetic herd architectures in large-scale pure HF herds v. the smaller family farms keeping DSN cows. The large-scale herds as used in the study by Yin and König (Reference Yin and König2018) only are located in previous East Germany. These herds used synthetic black and white breeds until reunification (Freyer et al., Reference Freyer, König, Fischer, Bergfeld and Cassell2008), and afterwards, they switched to a very fast Holsteinization process. Hence, the genetic founders might be different compared to our present study. Nevertheless, such speculations suggest ongoing studies in this regard.
Conclusion
Larger heritabilities and additive-genetic variances for all genetic lines DSN, HF and Mixed were detected within ‘superior’ herd environments, that is, herd groups representing higher milk production levels, lower calving ages, larger herd sizes and lower somatic cell count. Trait recording or the implementation of progeny testing schemes in selected herds with larger additive-genetic variances imply more extreme breeding values, contributing to a pronounced genetic differentiation of selection candidates. Differences in additive-genetic variances between herd descriptor groups were stronger for HF than for Mixed or DSN, indicating environmental sensitivity for HF. For Milk-kg from different herd groups or clusters, genetic correlations mostly exceed the ‘genotype by environment threshold’ of 0.80. Genetic correlations for SCS were low when grouping herds according to H-SIZE and H-CA and across clusters, suggesting multiple trait model applications in genetic evaluations. As a further extension, low genetic correlations across German herd groups for low heritability functional traits suggest a borderless genetic evaluation for DSN cattle, for example, combining similar DSN herds from Germany, Poland and the Netherlands. Nevertheless, in this study, we only had focus on records from the 1st official test-day. When basing the studies on a larger DSN data set on a European scale, it might be possible to apply random regression models with environmental and time dependent covariates, in order to infer genetic (co)variance components for a broad grid time × herd descriptor levels.
Supplementary material
To view supplementary material for this article, please visit https://doi.org/10.1017/S1751731119000144
Acknowledgements
The author(s)/editor(s) acknowledge the financial support for this project provided by transnational funding bodies, being partners of the FP7 ERA-net project, CORE Organic Plus, and the cofound from the European Commission.
Declaration of interest
The authors declare that they have no competing interests.
Ethics statement
None.
Software and data repository resources
The data analysed in the current study and the produced outputs are available by request from the corresponding author.