


Introduction
In addition to global warming, the global increase in nitrogen pollution in the atmosphere and across a wide range of ecosystems is a major threat to biodiversity (Krupa Reference Krupa2003). Since most nitrogen emissions derive from the agricultural sector (Olivier et al. Reference Olivier, Bouwman, van der Hook and Berdowski1998; Webb et al. Reference Webb, Menzi, Pain, Misselbrook, Dämmgen, Hendriks and Döhler2005) and the human population is over-exponentially increasing, a reduction of the nitrogen pools currently accumulating in most ecosystems all over the world is not in sight. Lichens are known to be sensitive to nitrogen pollution (Hauck Reference Hauck2010). While evidence on noxious effects of high concentrations of nitrate (Schmull et al. Reference Schmull, Hauck, Vann, Johnson and Runge2002) or nitric acid (Riddell et al. Reference Riddell, Nash and Padgett2008) in precipitation are scarce, ammonia is well documented to damage cytoplasma membranes and to reduce the chlorophyll fluorescence yield at photosystem II (Munzi et al. Reference Pirintsos, Munzi, Loppi and Kotzabasis2009a, Reference Pirintsos, Munzi, Loppi and Kotzabasisb; Pirintsos et al. Reference Pirintsos, Munzi, Loppi and Kotzabasis2009). Detailed surveys, especially of the epiphytic lichen vegetation in highly nitrogen-polluted areas, showed that many species decline at high nitrogen levels, whereas other eutrophication-tolerant or even nitrogen-demanding species increase (van Dobben & ter Braak Reference van Dobben and ter Braak1998, Reference van Dobben and ter Braak1999; van Herk Reference van Herk1999). With decreasing nitrogen levels, as regionally found in the Netherlands, these shifts in lichen vegetation can partly be reversed (Sparrius Reference Sparrius2007), though many nitrogen-sensitive species with dispersal limitations do not survive temporary peaks of nitrogen pollution.
Since recent investigations have suggested that the production of lichen substances is involved in the uptake and tolerance of lichens to cations including various metals and protons (Hauck & Jürgens Reference Hauck and Jürgens2008; Hauck et al. Reference Wirth2009a, Reference Wirthb), the present study investigated whether the ambient nitrogen level influences biochemical diversity of lichen vegetation. Specifically, the hypothesis was tested that the diversity of lichen secondary metabolites is reduced at high nitrogen levels. To test this hypothesis, a macroecological approach was applied linking published data on the eutrophication tolerance of lichens from Europe with the known secondary chemistry of the species. Two different data sets were employed which rank European lichen species after their eutrophication tolerance. The first supra-regional data set provides indicator values across a range of more than 500 species of lichen-forming ascomycetes (Wirth Reference Wirth2010). The second data set derives from a regional study of the epiphytic lichen vegetation in the Netherlands, which was selected as a case example because of the extraordinarily high levels of ammonia pollution in this area (van Dobben & de Bakker Reference van Dobben and de Bakker1996). Analyses were conducted on the species and for the first data set also at the family level. The family-wise analysis was included in order to test the hypothesis that the correlations between the diversity of lichen substances and the eutrophication tolerance are not merely due to the individual traits of a few species-rich families, including the Parmeliaceae, Physciaceae and Teloschistaceae.
Materials and Methods
Sources for vegetation and nitrogen-tolerance data
For the supra-regional analysis of Central European lichen species, indicator values were extracted from Wirth (Reference Wirth2010). The methodology for obtaining these values is based on the ecological indicator values introduced by Ellenberg (Reference Ellenberg1974, Reference Ellenberg1992) for vascular plants. These indicator values have repeatedly been used for ecological analyses in vascular plants, but rarely in lichens (Hauck & Wirth Reference Hauck and Wirth2010). Eutrophication tolerance is estimated with these indicator values on a nine-point scale (Table 1). Wirth (Reference Wirth2010) includes a total of 516 species of lichens and closely related fungi, which is c. 15–20% of the Central European lichen flora. The 516 species include 510 lichen-forming ascomycetes, three closely related non-lichenized ascomycetes (belonging to the Microcaliciaceae and Mycocaliciaceae), and two lichen-forming basidiomycetes. For the data analyses in the present study, the nine-point scale of Wirth (Reference Wirth2010) is converted into a three-point scale of eutrophication tolerance (low, moderate, high), also shown in Table 1.
Definition of indicator values estimating eutrophication tolerance of Central European lichens (Wirth Reference Wirth2010)

* n, number of lichen species included in the study (total number of species is 516)
A regional assessment of the eutrophication tolerance of specific epiphytic lichen species was extracted from van Dobben & de Bakker (Reference van Dobben and de Bakker1996). This study includes eight study areas representative of different regions of the Netherlands. In these areas, a total of 1216 sampling points (each with up to ten broad-leaved trees) was sampled. Based on these data and the known atmospheric ammonia mean concentrations of the individual areas, the species were classified as eutrophication-tolerant nitrophytes, eutrophication-sensitive acidophytes or indifferent towards the nitrogen supply in a canonical correspondence analysis. All species classified by van Dobben & de Bakker (Reference van Dobben and de Bakker1996) as eutrophication-tolerant (n = 18) and eutrophication-sensitive (n = 15) are included in the present analysis.
Sources for data on lichen secondary chemistry and phylogenetic relationships
Secondary chemistry of relevant lichen species listed in van Dobben & de Bakker (Reference van Dobben and de Bakker1996) or all 516 species included in Wirth (Reference Wirth2010) was extracted from the literature (e.g. Wirth Reference Wirth1995; Smith et al. Reference Smith, Aptroot, Coppins, Fletcher, Gilbert, James and Wolseley2009). Secondary metabolites were assigned to classes of lichen substances using Huneck & Yoshimura (Reference Huneck and Yoshimura1996) and Huneck (Reference Huneck2001). In the case of lichen substances occurring in chemosyndromes, only the main compounds were included, because closely related compounds of one chemosyndrome reflect interstage- or by-products or even decay products, for which in many cases no known biological function is assumed, at least not if these compounds occur in low concentrations (Leuckert Reference Leuckert1985; Søchting Reference Søchting1997). Species listed in Wirth (Reference Wirth2010) were assigned to families based on Lumbsch & Huhndorf (Reference Lumbsch and Huhndorf2007) and modifications compiled in Smith et al. (Reference Smith, Aptroot, Coppins, Fletcher, Gilbert, James and Wolseley2009).
Data analysis
Two target variables are analyzed: 1) the percentage of all lichen species with a given eutrophication tolerance producing the relevant compound or class of compounds; 2) the number of lichen substances produced by the lichen species of a given level of eutrophication tolerance. Analyses were limited to the quantitatively most important substance classes of the depsides, depsidones, dibenzofurans, xanthones, fatty acids, triterpenoids, pulvinic acids (i.e. tetronic acid derivatives), and anthraquinones. Statistical significance of differences in the frequencies of data sets is tested with the chi-square test. Yates' correction of chi-square values is applied in the regional data set, which is characterized by a limited set of lichen species and, with it, lichen substances.
Results
Secondary chemistry and eutrophication tolerance of more than 500 Central European lichens
Altogether 125 lichen substances are known to be produced by the species treated by Wirth (Reference Wirth2010). Most of these substances are rare, with 88% occurring in less than 1% of the studied species. Only a few depsides (atranorin as well as gyrophoric, lecanoric, thamnolic and squamatic acids), depsidones (norstictic, fumarprotocetraric and stictic acids) and dibenzofurans (usnic acid) occur in more than 10% of the more than 500 analyzed lichen species (data not shown). Depsides and depsidones are the most frequent classes of lichen substances in the studied lichens (Fig. 1A). Both substance classes and the dibenzofurans are significantly more frequent in lichen species from nitrogen-poor sites than in species with high tolerance to eutrophication. By contrast, anthraquinones and pulvinic acids occur more frequently in lichens with high nitrogen tolerance than in eutrophication-sensitive species. However, the number of anthraquinones and pulvinic acids is much lower than that of depsides and depsidones (Fig. 1B). The frequent occurrence of anthraquinones in eutrophication-tolerant lichens is due to the abundance of a single substance, parietin, which is produced by 20% of the highly tolerant species, but by only 9% of species with moderate tolerance and only 5% with low tolerance.
A, frequency distribution of lichen substances belonging to selected substance classes among lichen species; B, number of lichen substances of different substance classes in lichen species with low, moderate or high eutrophication tolerance based on indicator values published by Wirth (Reference Wirth2010). Asterisks indicate significant differences between levels of eutrophication tolerance (* P ≤ 0·05, ** P ≤ 0·01, *** P ≤ 0·001).
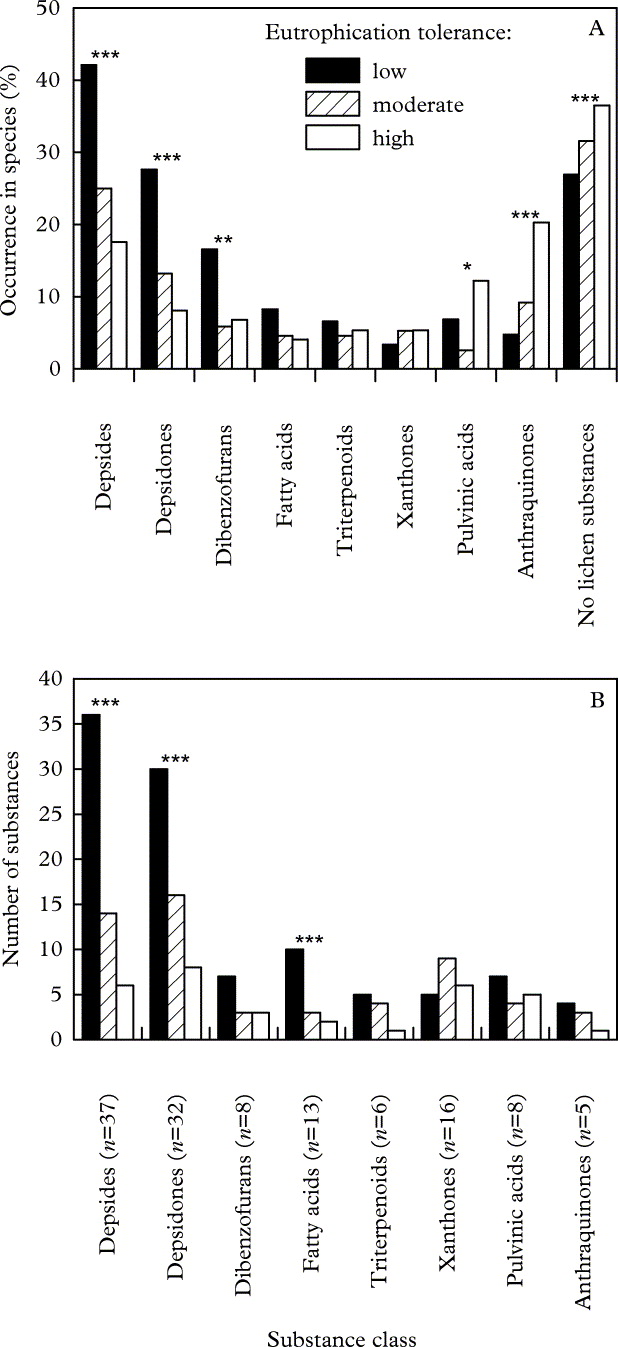
The total diversity of depsides, depsidones and fatty acids decreases along with eutrophication tolerance, whereas there is no such trend for xanthones and pulvinic acids and only a weak tendency for anthraquinones and triterpenoids (Fig. 1B). The dibenzofurans show a trend for more substances occurring in lichens with low eutrophication tolerance than in other lichens, but this trend is not significant (P = 0·08). Except for the xanthones, almost all lichen substances studied occur in species of low eutrophication tolerance (Fig. 1B). A major impoverishment of lichen substances is already observed in species of moderate eutrophication tolerance (Fig. 1B). In the largest classes of lichen substances, namely depsides and depsidones, further impoverishment occurs between species of moderate and high eutrophication tolerance, but not as steep as between species of moderate and low tolerance (Fig. 1B). The proportion of lichen species which do not produce lichen substances increases with increasing tolerance to high nitrogen levels (Fig. 1A).
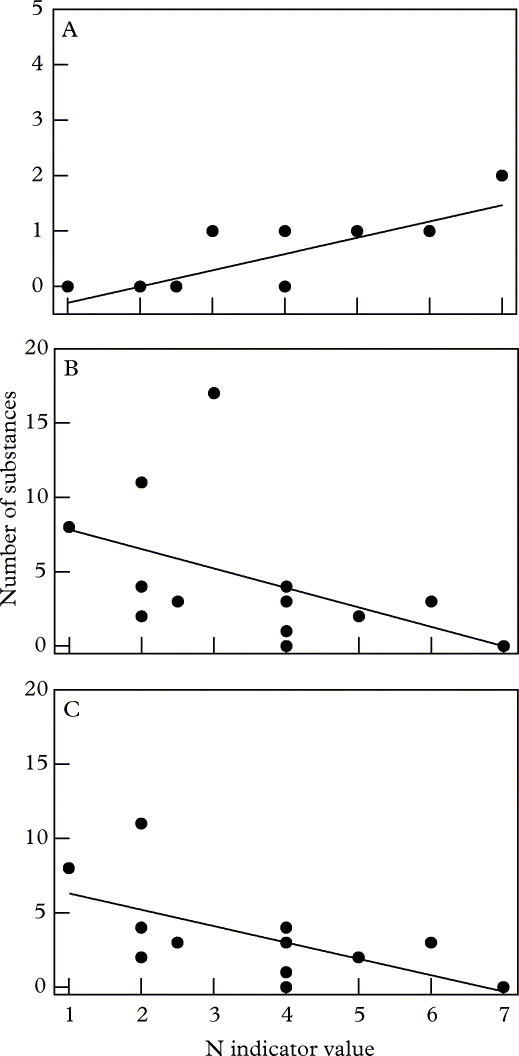
The 516 analyzed species represent 55 families of ascomycetes (509 species) and one family of basidiomycetes (2 species). Five lichen-forming ascomycetes could not be assigned to a family (Cystocoleus, Leprocaulon, Petractis, Racodium, Strangospora). Most families contain only a few relevant species. Only 13 families include at least 10 relevant species; overall 68% of the 516 species belong to these 13 families. Table 2 shows the number of lichen substances found in the species of these 13 families. In none of these 13 families are all lichen substances of a certain substance group produced, not even in the Parmeliaceae, which harbour the highest diversity of lichen substances and species (Table 2) among the lichen families studied. Even in the Parmeliaceae, 20 out of 37 depsides and 18 out of 32 depsidones are not known to be produced. Plotting the median of the number of lichen substances per family against the eutrophication tolerance indicator value shows a significant increase in anthraquinones (Fig. 2A) and a significant decrease in depsides (Fig. 2B), which becomes even more significant if members of the Parmeliaceae are removed (Fig. 2C).
Number of lichen substances found in species in 13 families with at least 10 species, arranged according to indicator values of Wirth (Reference Wirth2010). Each datum point represents the median number of lichen substances produced by the species from the N tolerance category indicated. Data are plotted against median N indicator values of the families. A, anthraquinones (r = 0·77, P = 0·001); B, depsides (r = −0·47, P = 0·05); C, depsides without Parmeliaceae (r = −0·62, P = 0·02).
Number of lichen substances found in species of the families with at least 10 species occurring in the analysis of Wirth's indicator values (Wirth Reference Wirth2010)

* IQ, interquartile range
** AN, anthraquinones (n = 5); DE, depsides (n = 37); DO, depsidones (n = 32); DI, dibenzofurans (n = 8); FA, fatty acids (n = 13); PU, pulvinic acids (n = 8); TT, triterpenoids (n = 8); XA, xanthones (n = 16).
Case study of epiphytic lichens from the Netherlands
Depsides and depsidones are found in approximately two-thirds of the eutrophication-sensitive lichens, but in only one-third (depsides; P = 0·06) or none (depsidones; P < 0·001) of the nitrophytes. While the depside atranorin occurs in lichen species irrespective of their tolerance to high nitrogen levels, six other depsides and all depsidones are limited to eutrophication-sensitive species (Table 3). Pulvinic acids lacking in the eutrophication-sensitive species occur in more than half of the eutrophication-tolerant species. The number of xanthones is higher in the sensitive than in the tolerant lichens, but this difference is merely due to one species (Pyrrhospora quernea) that produces three different xanthones. Therefore, the proportion of xanthone-producing species does not appear to differ between eutrophication-tolerant and -sensitive species.
Total lichen substances of different substance classes in eutrophication-sensitive and eutrophication-tolerant epiphytic lichens recorded by van Dobben & de Bakker (Reference van Dobben and de Bakker1996) in 1216 plots in the Netherlands

Discussion
Results of this study clearly show that lichen species tolerant or intolerant to high nitrogen concentrations differ in their secondary chemistry. Most depsides and depsidones, which form the largest groups of lichen substances (Huneck & Yoshimura Reference Huneck and Yoshimura1996; Huneck Reference Huneck2001) are produced by species with low tolerance to eutrophication. The steep decline of chemical diversity in lichens between species tolerating low and moderate levels of eutrophication suggests that the reduction of chemical diversity caused by nitrogen pollution is not limited to a few heavily polluted areas. Production of anthraquinones and pulvinic acids appears to be more widespread among eutrophication-tolerant lichens than sensitive species, but this cannot compensate for the loss of most other biochemical diversity with increasing nitrogen levels, as only relatively few anthraquinones and pulvinic acids are known. Many depsides, depsidones, dibenzofurans, fatty acids and other lichen substances are produced by only a few lichen species from nitrogen-poor sites, which suggests that even slight shifts in species diversity can cause substantial losses of biochemical diversity. The case study of epiphytic lichens from the Netherlands (van Dobben & de Bakker Reference van Dobben and de Bakker1996) confirms this view.
The family-wide analysis shows that the trend for a loss of lichen substance diversity with increasing eutrophication is not the result of the behaviour of a few species-rich lichen families, such as the predominantly eutrophication-sensitive Parmeliaceae or the mostly eutrophication-tolerant Physciaceae or Teloschistaceae. The absence of many lichen substances in the 13 largest families in the analysis implies that many substances are only found in families with a few species. This indicates that the reduced biochemical diversity due to eutrophication is a real diversity effect and not merely due to the individual traits of a few large families.
The mechanisms behind the relationship between eutrophication tolerance and secondary chemistry are not yet clear. Since lichen substances are known to influence the demands of lichens for the pH of their environment (i.e. the substratum and precipitation) (Hauck et al. Reference Hauck, Jürgens, Huneck and Leuschner2009a, Reference Hauck, Jürgens, Willenbruch, Huneck and Leuschnerb), the increase of pH by the dissociation of ammonia in water may play a role in this relationship. Some depsides and depsidones and the dibenzofuran usnic acid were shown to be involved in the adaptation of lichens to acidity (Hauck & Jürgens Reference Hauck and Jürgens2008; Hauck et al. Reference Takani, Yajima, Masuda and Yamauchi2009a, Reference Takani, Yajima, Masuda and Yamauchi2010a). The pH-dependent metal complexation by lichen substances (Takani et al. Reference Takani, Yajima, Masuda and Yamauchi2002; Hauck et al. Reference Hauck2009b, Reference Hauck2010b) apparently influences the pH preferences of lichen species, probably as metal complexation is the initial step in the control of metal homeostasis by lichen substances (Hauck Reference Hauck2008; Hauck et al. Reference Hauck, Jürgens and Leuschner2009c). Usnic acid, for example, which was shown to promote the uptake of Cu2+ in Evernia mesomorpha and Ramalina menziesii (Hauck et al. Reference Hauck, Jürgens and Leuschner2009c), binds to this ion and other metals in the acidic range, whereas the anthraquinone parietin forms metal complexes under alkaline conditions (Takani et al. Reference Takani, Yajima, Masuda and Yamauchi2002; Hauck et al. Reference Hauck, Jürgens, Willenbruch, Huneck and Leuschner2009b). This difference would explain the increasing abundance of parietin along with increasing eutrophication tolerance.
This study indicates that changes in lichen frequency along nitrogen gradients take place not only among lichens that produce lichen substances but also lichens that do not produce them. A proposed mechanism for nitrogen tolerance both in vascular plants and lichens is the capability of species to provide sufficient carbon skeletons to assimilate ammonium into amino acids rapidly (Schortemeyer et al. Reference Schortemeyer, Stamp and Feil1997; Hauck & Wirth Reference Hauck and Wirth2010), because of the high toxicity of free ammonium and ammonia (Neuhäuser et al. Reference Neuhäuser, Dynowksi, Mayer and Ludewig2007). Since large amounts of carbohydrates are allocated to lichen substances in species producing such compounds, fewer carbohydrates can be expected to be available for ammonium assimilation in species with lichen substances than those without. This could explain the apparent tolerance to eutrophication of lichens without compounds. However, as many lichen species without lichen substances are low-productive crustose lichens with thin thalli (Lakatos et al. Reference Lakatos, Rascher and Büdel2006; Weber et al. Reference Weber, Scherr, Reichenberger and Büdel2007), not all lichens without lichen substances are tolerant to eutrophication (Hauck & Wirth Reference Hauck and Wirth2010).
In conclusion, the present study can only show that there is some coincidence between the diversity of lichen substances and the nitrogen level of the environment. The high number of species (>500) and the large geographical scale (Central Europe) covered by the analysis suggest the existence of some causal link between the eutrophication tolerance and the biochemical diversity in lichens. Searching for mechanistic explanations, the possibility should be considered that the low biochemical diversity in lichens from nitrogen-rich environments and the known low biochemical diversity in nitrogen-fixing cyanolichens (Culberson Reference Culberson1969) with high intrathalline nitrogen concentrations (Nash Reference Nash and Nash2008) might go back to similar (not yet known) causalities.
Prof. Dr. Volkmar Wirth is thanked for providing me with an electronic file of his indicator values published in Wirth (Reference Wirth2010). Dr James D. Lawrey made valuable comments on the manuscript.



