1 Introduction
Supersonic jets operating at off-design conditions are characterized by three distinct noise sources (Tam Reference Tam1995): mixing noise (Jordan & Colonius Reference Jordan and Colonius2013), broad-band shock associated noise (André, Castelain & Bailly Reference André, Castelain and Bailly2013), and jet screech (Raman Reference Raman1999). Turbulent wavepackets in the jet play a key role in all three mechanisms, while the shock structures resulting from the off-design operation of the jet are an integral part of the latter two. Screech was first described by Powell (Reference Powell1953a ,Reference Powell b ), who recognized that screech tones are the result of an aeroacoustic feedback process comprised of four stages: an upstream-travelling acoustic wave arrives at the nozzle lip, perturbing the near-nozzle shear layer. This perturbation grows through the Kelvin–Helmholtz instability, developing into a wavepacket as it convects downstream. The interaction of this wavepacket with shock structures resulting from off-design operation produces acoustic waves. These propagate back to the nozzle, closing the loop. As is typical of aeroacoustic resonance, the screech-tone frequency is selected both by the need to match the phase of the upstream and downstream disturbances, and to satisfy an amplitude criterion (the gain across the process must be equal to one). Screech is characterized by its discrete tonal nature, its strong directivity, and what is known as its ‘staging’ behaviour. As the pressure ratio (and thus the degree of underexpansion) is varied continuously, the screech tone initially changes in a similarly continuous manner. This change in tone is typically assumed to be due to gradual changes in the shock-cell spacing and convection velocity. However, at certain pressures, driven by the need to satisfy both the amplitude and gain criteria, the frequency of the screech tone changes discontinuously. In an axisymmetric jet, this jump in frequency is often accompanied by a change in the azimuthal structure of the screech mode; with increasing pressure ratio the flow undergoes: A1 and A2 (toroidal), B (precessing flapping), C (helical) and D (flapping) oscillations. While there have been attempts to produce frequency prediction models that can account for staging (Gao & Li Reference Gao and Li2010), or to explain the process in terms of changes in characteristic length scales of the flow (Edgington-Mitchell, Honnery & Soria Reference Edgington-Mitchell, Honnery and Soria2015b ), a clear phenomenological explanation has not been forthcoming.
This lack of a phenomenological explanation for jet screech is symptomatic of a broader lack of understanding regarding its underlying processes. The sound generation mechanisms are still a topic of some debate, though a consensus appears to be arising with respect to the shock-leakage model of Manning & Lele (Reference Manning and Lele2000), with both experimental (Edgington-Mitchell et al. Reference Edgington-Mitchell, Oberleithner, Honnery and Soria2014b ) and numerical (Berland, Bogey & Bailly Reference Berland, Bogey and Bailly2007) evidence steadily accruing. Even if it is accepted that sound is produced via shock leakage, it is not yet clear whether it is a single shock (Mercier, Castelain & Bailly Reference Mercier, Castelain and Bailly2017) or multiple shocks (Tam, Parrish & Viswanathan Reference Tam, Parrish and Viswanathan2014) that are responsible for the tone production. Receptivity processes at the nozzle lip (Barone & Lele Reference Barone and Lele2005) are highly sensitive to nozzle geometry (Raman Reference Raman1997), and the short time scales involved render measurement difficult (Mitchell, Honnery & Soria Reference Mitchell, Honnery and Soria2012). Historically, the upstream propagation of the sound wave has received little attention; the propagation of a sound wave seems a relatively straightforward process compared to the other components of the feedback cycle. It is nonetheless this process that is the focus of this paper.
The typical description of jet screech suggests a closure mechanism wherein an acoustic wave, generated at downstream shock cells, propagates upstream through the hydrodynamic near field to the nozzle lip. Perhaps the only alternative theory to date was proposed by Shen & Tam (Reference Shen and Tam2002). It is well recognized that two screech modes can exist simultaneously, suggesting the potential for multiple possible closure mechanisms for the feedback loop. Shen & Tam (Reference Shen and Tam2002) hypothesized that in addition to the standard mechanism, the feedback loop could also be closed by an upstream-travelling acoustic jet mode. This mode (
 $k_{TH}^{-}$
) was one of several that Tam & Hu (Reference Tam and Hu1989) identified in compressible jets, beyond the classical downstream-travelling Kelvin–Helmholtz mode. These
 $k_{TH}^{-}$
waves have recently seen a resurgence of interest in the community, having provided phenomenological explanations for tones in subsonic jets (Schmidt et al.
Reference Schmidt, Towne, Colonius, Cavalieri, Jordan and Brès2017; Towne et al.
Reference Towne, Cavalieri, Jordan, Colonius, Schmidt, Jaunet and Brès2017), jet–plate (Bogey & Gojon Reference Bogey and Gojon2017) and jet–edge interactions (Jordan et al.
Reference Jordan, Jaunet, Towne, Cavalieri, Colonius, Schmidt and Agarwal2018). One of the earliest attempts to link
 $k_{TH}^{-}$
waves to the feedback-loop closure was by provided by Tam & Ahuja (Reference Tam and Ahuja1990) for subsonic impinging jets:
‘We would like to suggest an alternative proposal that the feedback is achieved by waves belonging to the intrinsic upstream-propagating neutral acoustic modes of the jet flow. These upstream-propagating acoustic wave modes, just as the instability wave modes, have well-defined radial and azimuthal structures. Also they are, as in the case of Kelvin–Helmholtz instability waves, supported and determined by the mean flow of the jet.’
In this paper, non-time-resolved high-resolution particle image velocimetry is used to provide experimental evidence that this same upstream-travelling neutral acoustic mode is also responsible for closure of the feedback loop in jet screech. A triple decomposition based on proper orthogonal decomposition (POD) is used to reconstruct the oscillations of the flow associated with the screech tone. A Fourier transform is then used to separate the screech fluctuations into components with negative and positive phase velocities. A mode with negative phase velocity and support in the core of the jet is clearly visible in the data. The radial structure of this mode is extracted from the data, and compared to the upstream-travelling mode predicted by stability theory.
2 Experimental set-up
The planar PIV dataset was produced in the Laboratory for Turbulence Research in Aerospace and Combustion (LTRAC) gas jet facility (Weightman et al.
Reference Weightman, Amili, Honnery, Soria and Edgington-Mitchell2017). The facility is optimized for PIV measurements and is not anechoic. Both cases considered here are of flow issuing from a purely converging nozzle of diameter
 $D=15$
mm, with a radius of curvature of 67.15 mm, ending with a parallel section at the nozzle exit, and an external lip thickness of 5 mm. Particle images were obtained using a 12-bit Imperx B4820 camera, with a CCD array of
 $4872\times 3248$
px, at an acquisition frequency of 2 Hz. The 600 nm diameter smoke particles (Mitchell, Honnery & Soria Reference Mitchell, Honnery and Soria2013) were illuminated in a 1 mm thick Nd : YAG laser light sheet by a pair of 6 ns pulses of approximately 160 mJ, separated by
 $\unicode[STIX]{x0394}t=1~\unicode[STIX]{x03BC}\text{s}$
. The multigrid algorithm of Soria (Reference Soria1996) was used to analyse the image pairs, with a final interrogation window size of
 $0.03D\times 0.03D$
, a depth of field of
 $0.04D$
, and a field of view of
 $5.7D\times 3.8D$
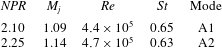
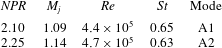
. Two flow conditions are considered, falling in the A1 and A2 modes of jet screech, described in table 1. Only a single screech tone was evident in each case, with no simultaneous peaks or mode-switching observed. Here nozzle pressure ratio is defined as the ratio between the plenum and the ambient pressures
 $NPR=p_{0}/p_{\infty }$
, while the ideally expanded Mach number
 $M_{j}$
, Reynolds number
 $Re=U_{j}D_{j}/\unicode[STIX]{x1D708}$
and Strouhal number
 $St=fD_{j}/U_{j}$
are calculated based on isentropic expansion to ambient pressure, where
 $U_{j}$
is the ideally-expanded velocity,
 $D_{j}$
is the ideally-expanded equivalent jet diameter,
 $v$
is the kinematic viscosity and
 $f$
is the screech frequency. The Strouhal number listed in table 1 is that of the fundamental screech tone measured by a G.R.A.S. type 46BE
 $1/4^{\prime \prime }$
pre-amplified microphone in the far field.
Jet conditions.
3 Mean flows and decomposition
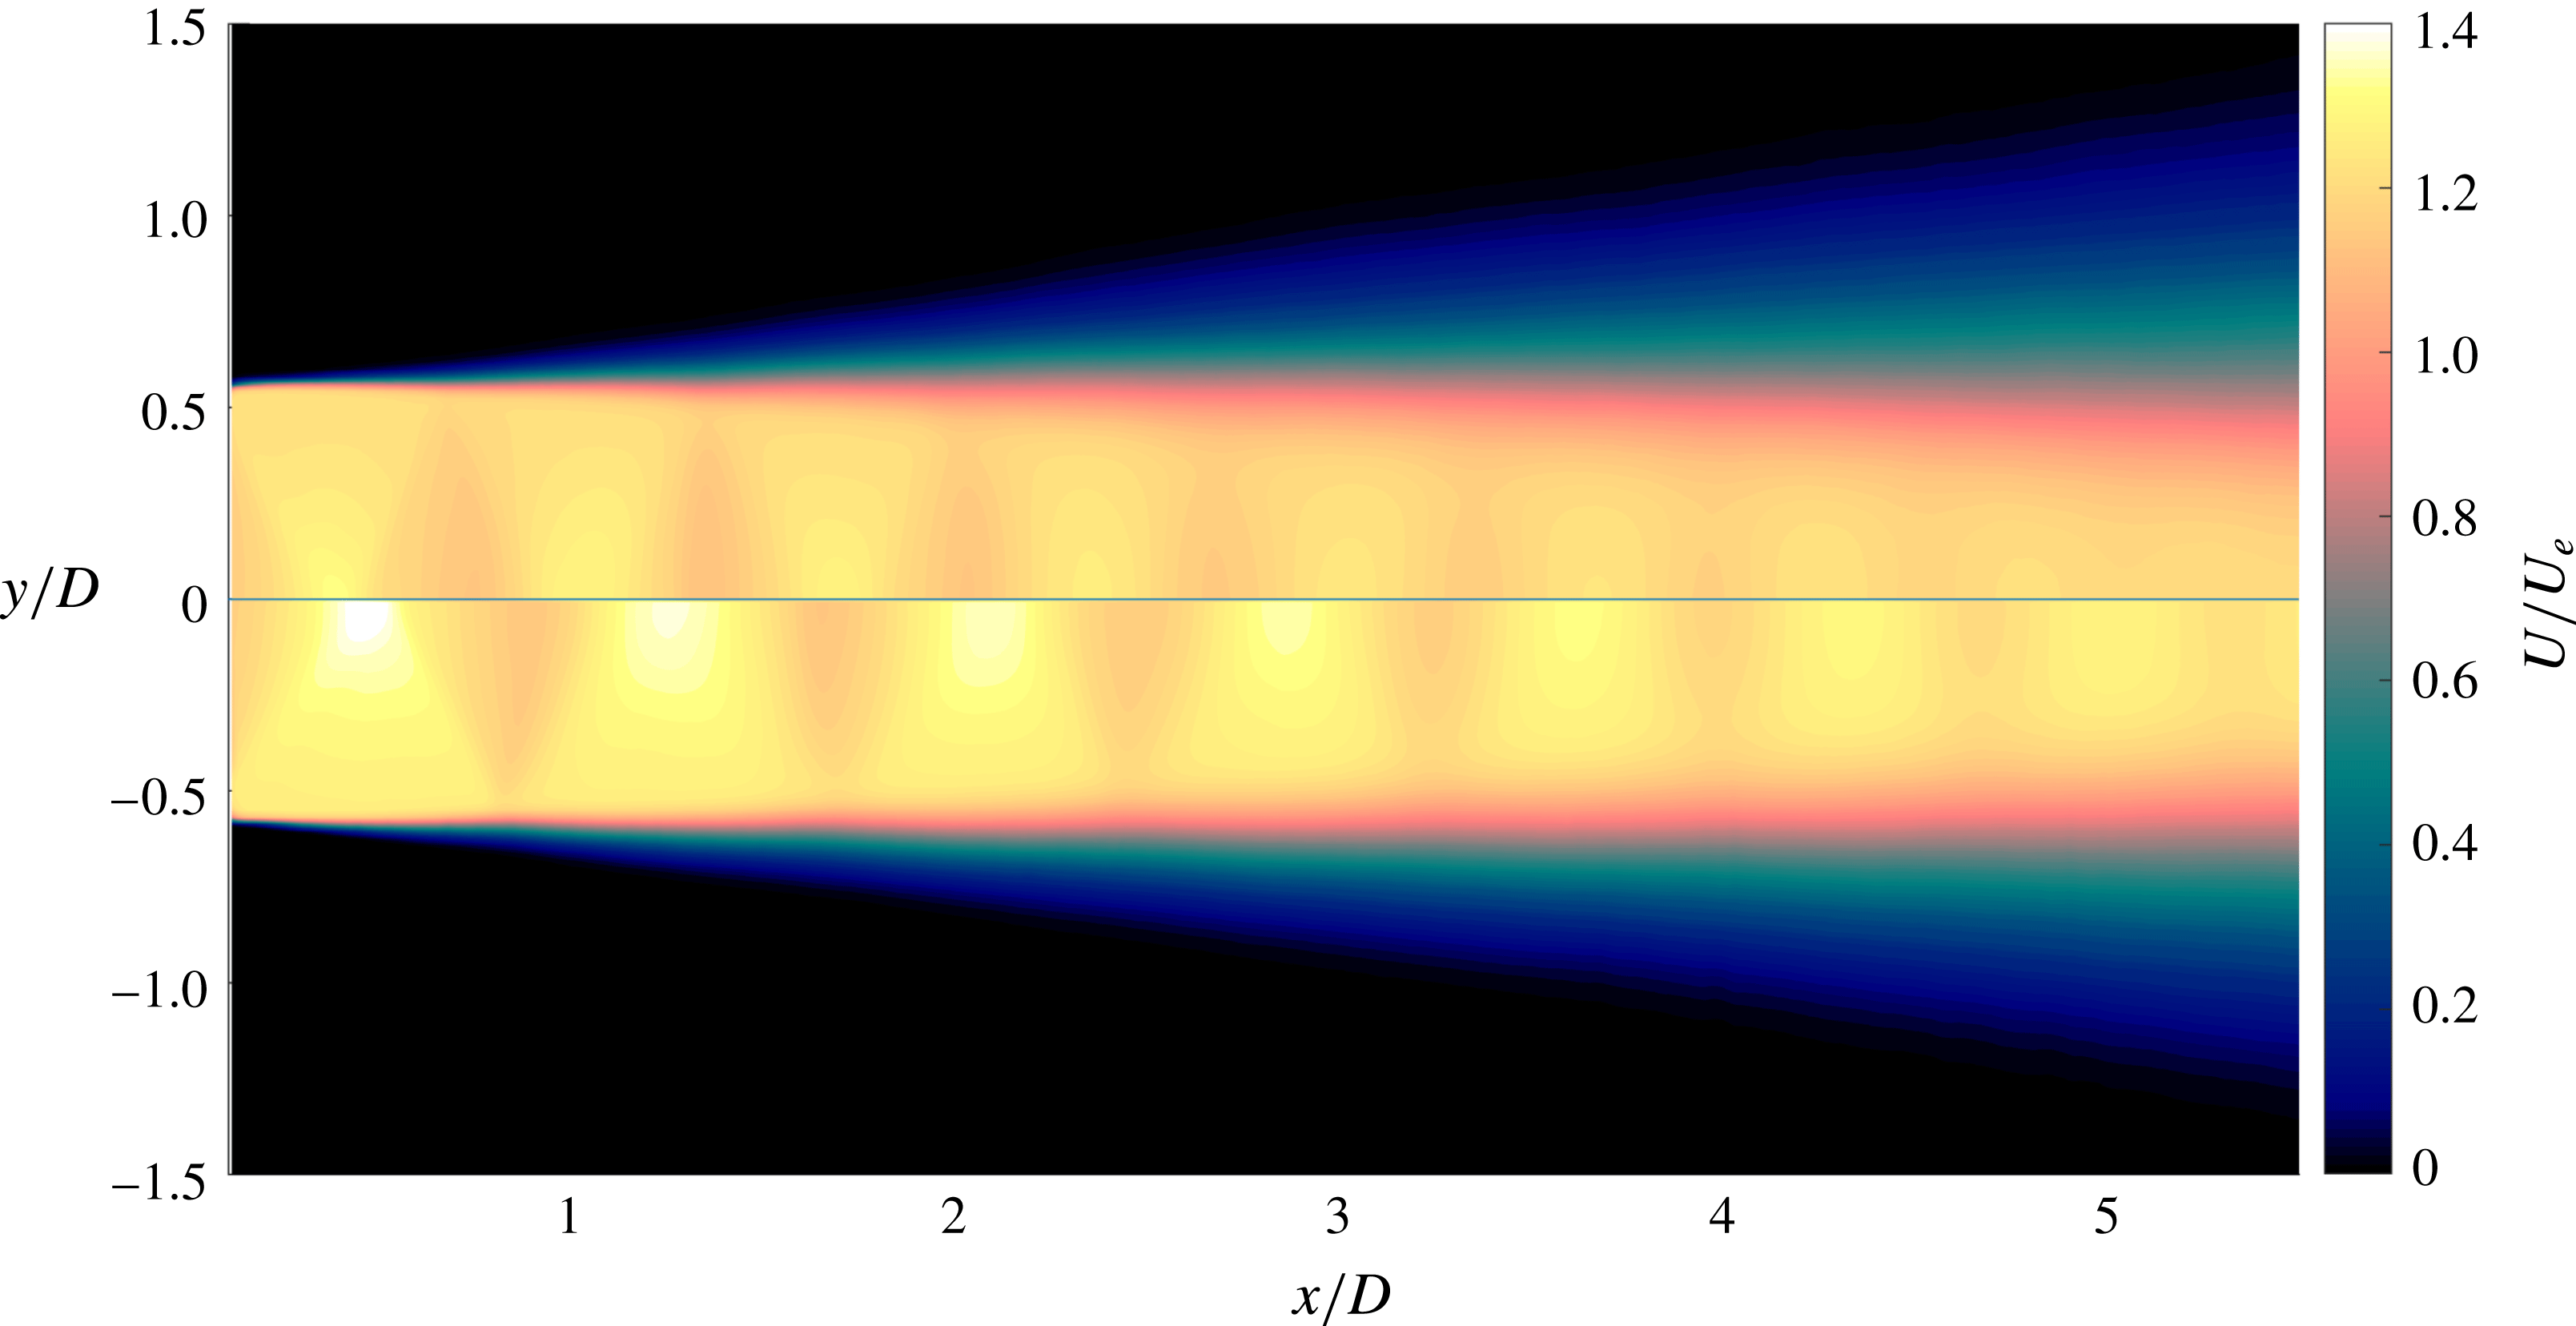
Contours of the mean axial velocity for the jets, averaged over 10 000 individual fields, are presented in figure 1. Both flow fields exhibit the typical shock-expansion pattern of underexpanded jets. The small difference in pressure ratio is sufficient to cause a moderate change in the spacing and strength of the shock cells.
Mean axial velocity: (top)
 $NPR=2.10$
and (bottom)
 $NPR=2.25$
.

To extract the fluctuations associated with the screech tone, the snapshot POD of Sirovich (Reference Sirovich1987) is applied. The spatial quasi-periodicity of screeching and impinging jets make them amenable to POD. The decomposition is performed only on the transverse velocity fluctuation, as this provides a clearer separation for the leading mode pair. Only key details of the approach are reproduced here. The autocovariance matrix is constructed from the velocity snapshots
 $\unicode[STIX]{x1D64D}=\boldsymbol{V}^{\text{T}}\boldsymbol{V}$
, and the solution of the eigenvalue problem
 $\unicode[STIX]{x1D64D}\boldsymbol{v}=\unicode[STIX]{x1D706}\boldsymbol{v}$
yields the eigenvalues
 $\unicode[STIX]{x1D706}$
and eigenvectors
 $\boldsymbol{v}$
from which the spatial POD modes are constructed as:
 $$\begin{eqnarray}\unicode[STIX]{x1D753}_{n}(x,y)=\frac{\boldsymbol{V}\boldsymbol{v}_{n}(t)}{\Vert \boldsymbol{V}\boldsymbol{v}_{n}(t)\Vert },\end{eqnarray}$$
and the coefficients at each time
 $t$
for each mode
 $n$
can be expressed as:
 $$\begin{eqnarray}\boldsymbol{a}_{n}(t)=\boldsymbol{v}_{n}(t)\Vert \boldsymbol{V}\boldsymbol{v}_{n}(t)\Vert .\end{eqnarray}$$
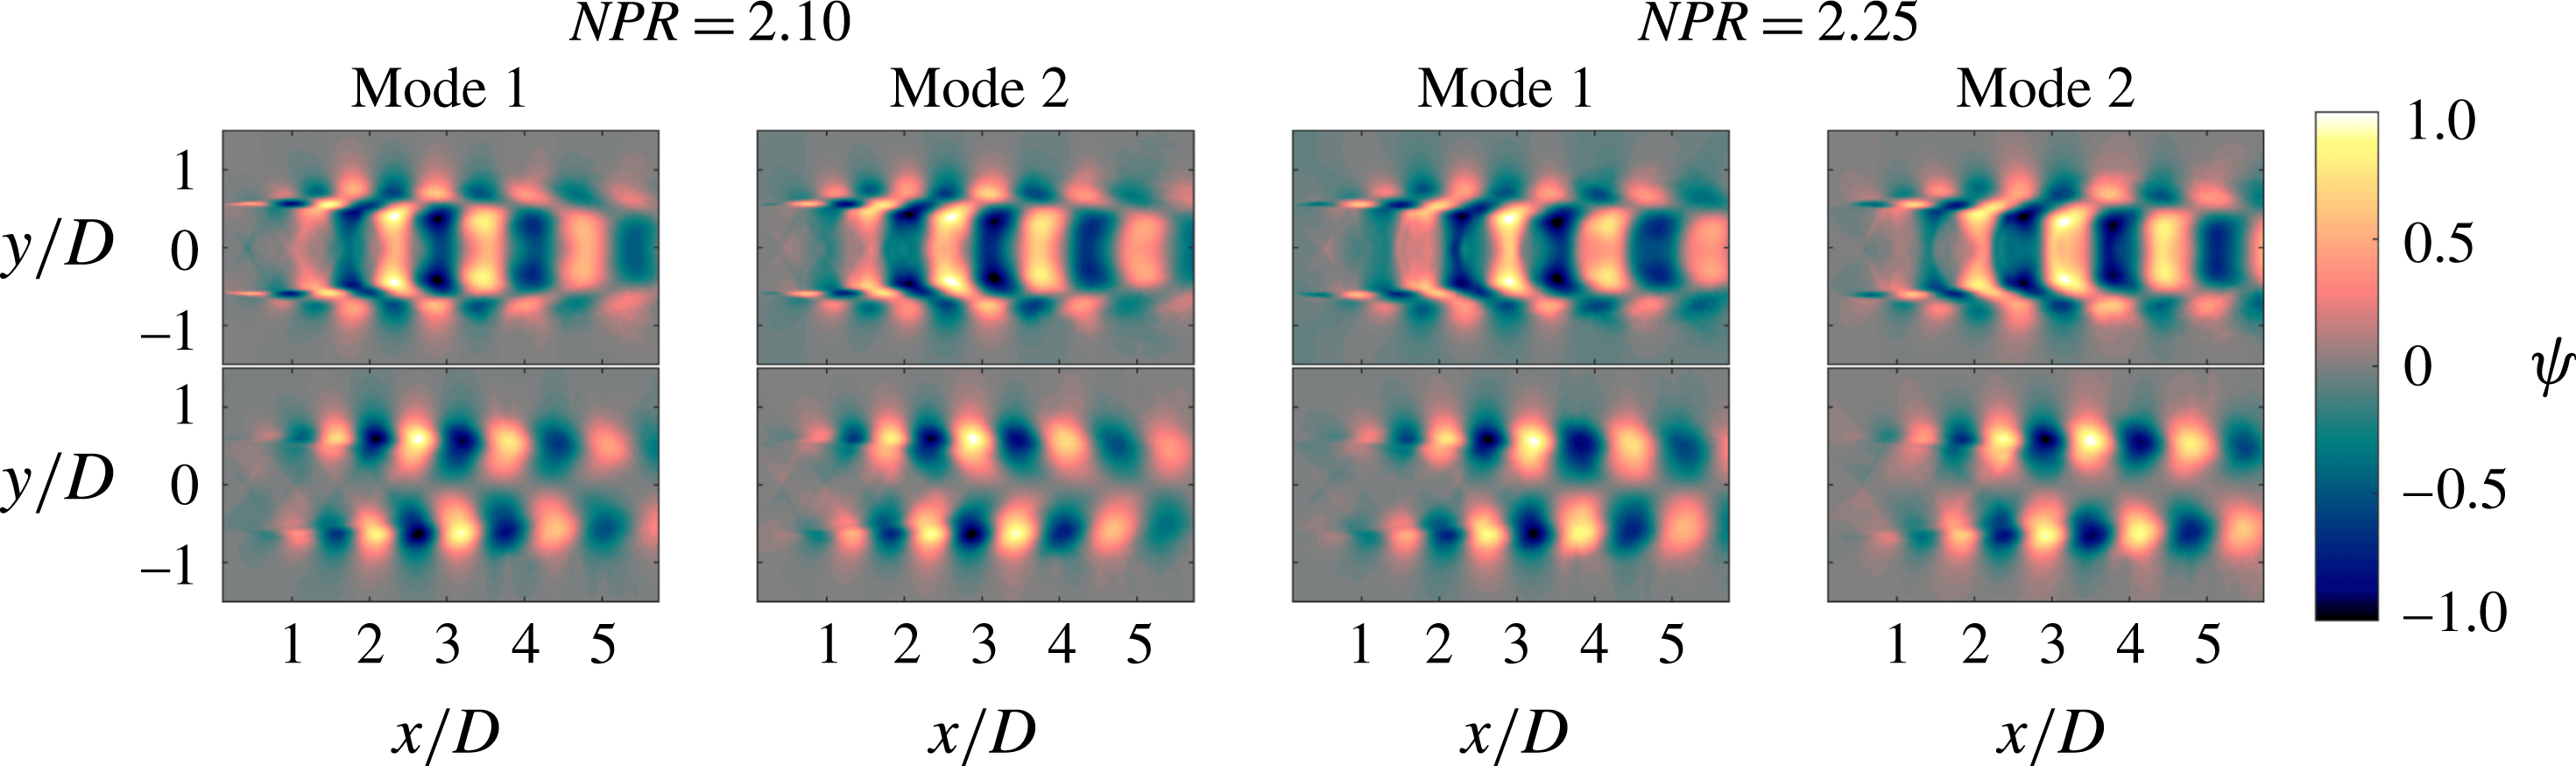
Axial
 $u_{c}$
(above) and transverse
 $v_{c}$
(below) components of proper orthogonal modes 1 and 2 for both cases. Each mode is individually normalized.

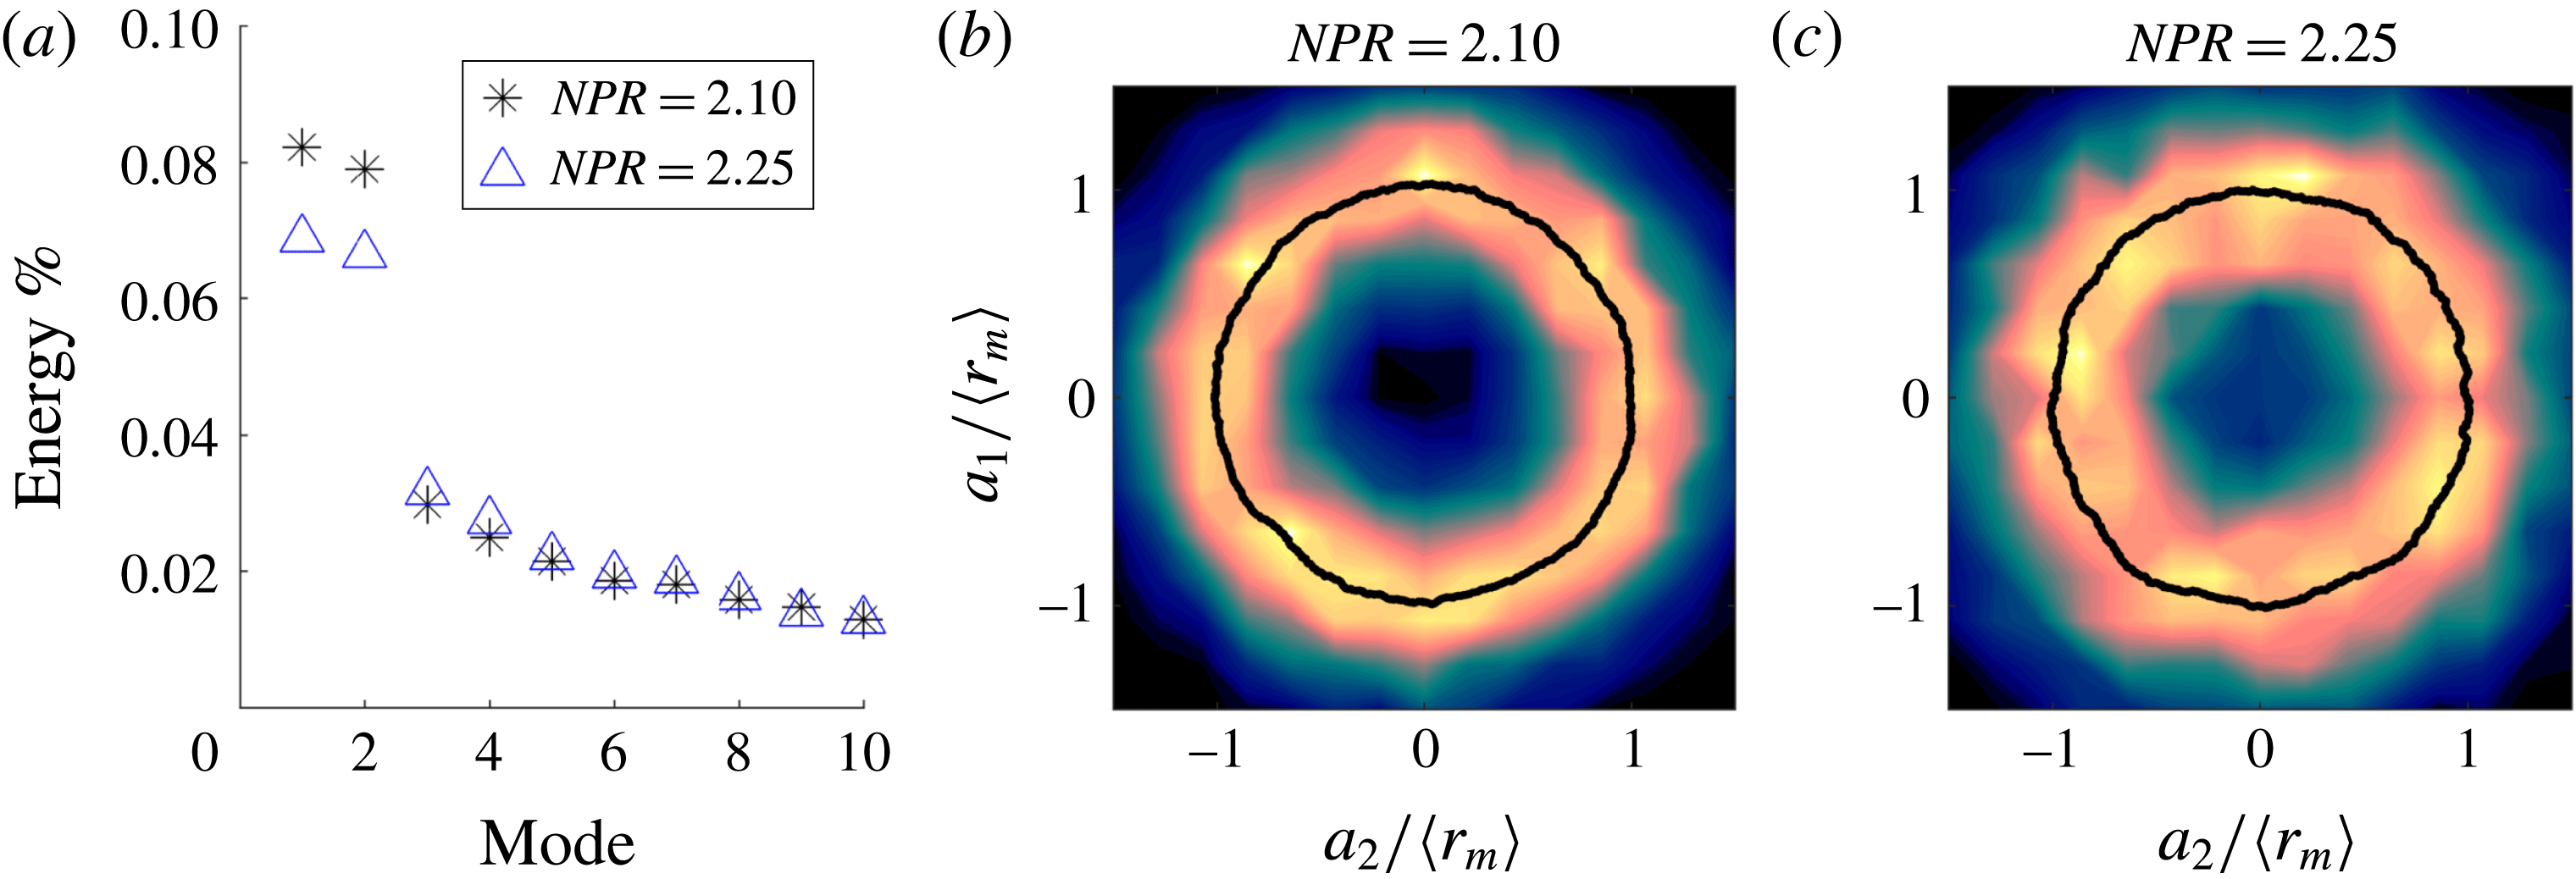
(a) Energy distribution amongst leading POD modes; (b,c) phase portrait of the leading two POD modes for each case, constructed from the eigenvectors associated with those modes, represented as a PDF.

Both jets are characterized by a leading pair of POD modes that are symmetric about the centreline, which at these pressure ratios is indicative of an
 $m=0$
azimuthal mode; these modes are shown in figure 2. At first glance there appears to be almost no difference in modal structure between the two cases. Figure 3 indicates that the leading mode pair represents only a relatively small fraction of the total energy, but this is typical of high-Reynolds-number screeching jets (Edgington-Mitchell, Honnery & Soria Reference Edgington-Mitchell, Honnery and Soria2015a
). The Lissajous curves in figure 3, formed by plotting the mean radial distance to the snapshot coefficients, form a circle, indicating that modes 1 and 2 represent a periodic phenomenon. Extensive prior experience with self-forcing flows of this kind demonstrates that it is reasonable to assume that the leading mode pair will represent the coherent structures associated with the aeroacoustic feedback process (Edgington-Mitchell, Honnery & Soria Reference Edgington-Mitchell, Honnery and Soria2014a
). The coherent fluctuations associated with these structures (
 $\boldsymbol{q}^{c}(x,y,t)$
) can thus be extracted from the PIV data using the leading pair of POD modes:
 $$\begin{eqnarray}\boldsymbol{q}^{c}(x,y,t)=\mathop{\sum }_{n=1}^{2}a_{n}(t)\unicode[STIX]{x1D753}_{n}(x,y)=\text{Re}(\boldsymbol{a}(t)\unicode[STIX]{x1D74D}(x,y)).\end{eqnarray}$$
Since the mode pair represents a periodic phenomenon at the screech frequency
 $\unicode[STIX]{x1D714}_{s}$
, after Oberleithner et al. (Reference Oberleithner, Sieber, Nayeri, Paschereit, Petz, Hege, Noack and Wygnanski2011) and Jaunet, Collin & Delville (Reference Jaunet, Collin and Delville2016) we define:
 $\boldsymbol{a}=a_{1}-ia_{2}=\hat{a}\text{e}^{-\text{i}\unicode[STIX]{x1D714}_{s}t}$
and
 $\unicode[STIX]{x1D74D}=\unicode[STIX]{x1D753}_{1}+\text{i}\unicode[STIX]{x1D753}_{2}$
. On this basis, with the application of a streamwise Fourier transform, the coherent fluctuations can be represented:
 $$\begin{eqnarray}\boldsymbol{q}^{c}(x,y,t)=\hat{a}\text{e}^{-\text{i}\unicode[STIX]{x1D714}_{s}t}\mathop{\sum }_{k}\hat{\boldsymbol{q}}_{k}^{c}(y)\text{e}^{\text{i}kx}.\end{eqnarray}$$
Here the temporal Fourier coefficients have been constructed directly from the complex POD mode pair
 $\unicode[STIX]{x1D74D}$
, such that:
 $$\begin{eqnarray}\hat{\boldsymbol{q}}_{k}^{c}(y)=\mathop{\sum }_{x}\unicode[STIX]{x1D74D}(x,y)\text{e}^{-\text{i}kx}.\end{eqnarray}$$
4 The upstream-travelling
 $k_{TH}^{-}$
mode

4.1 Experimental evidence
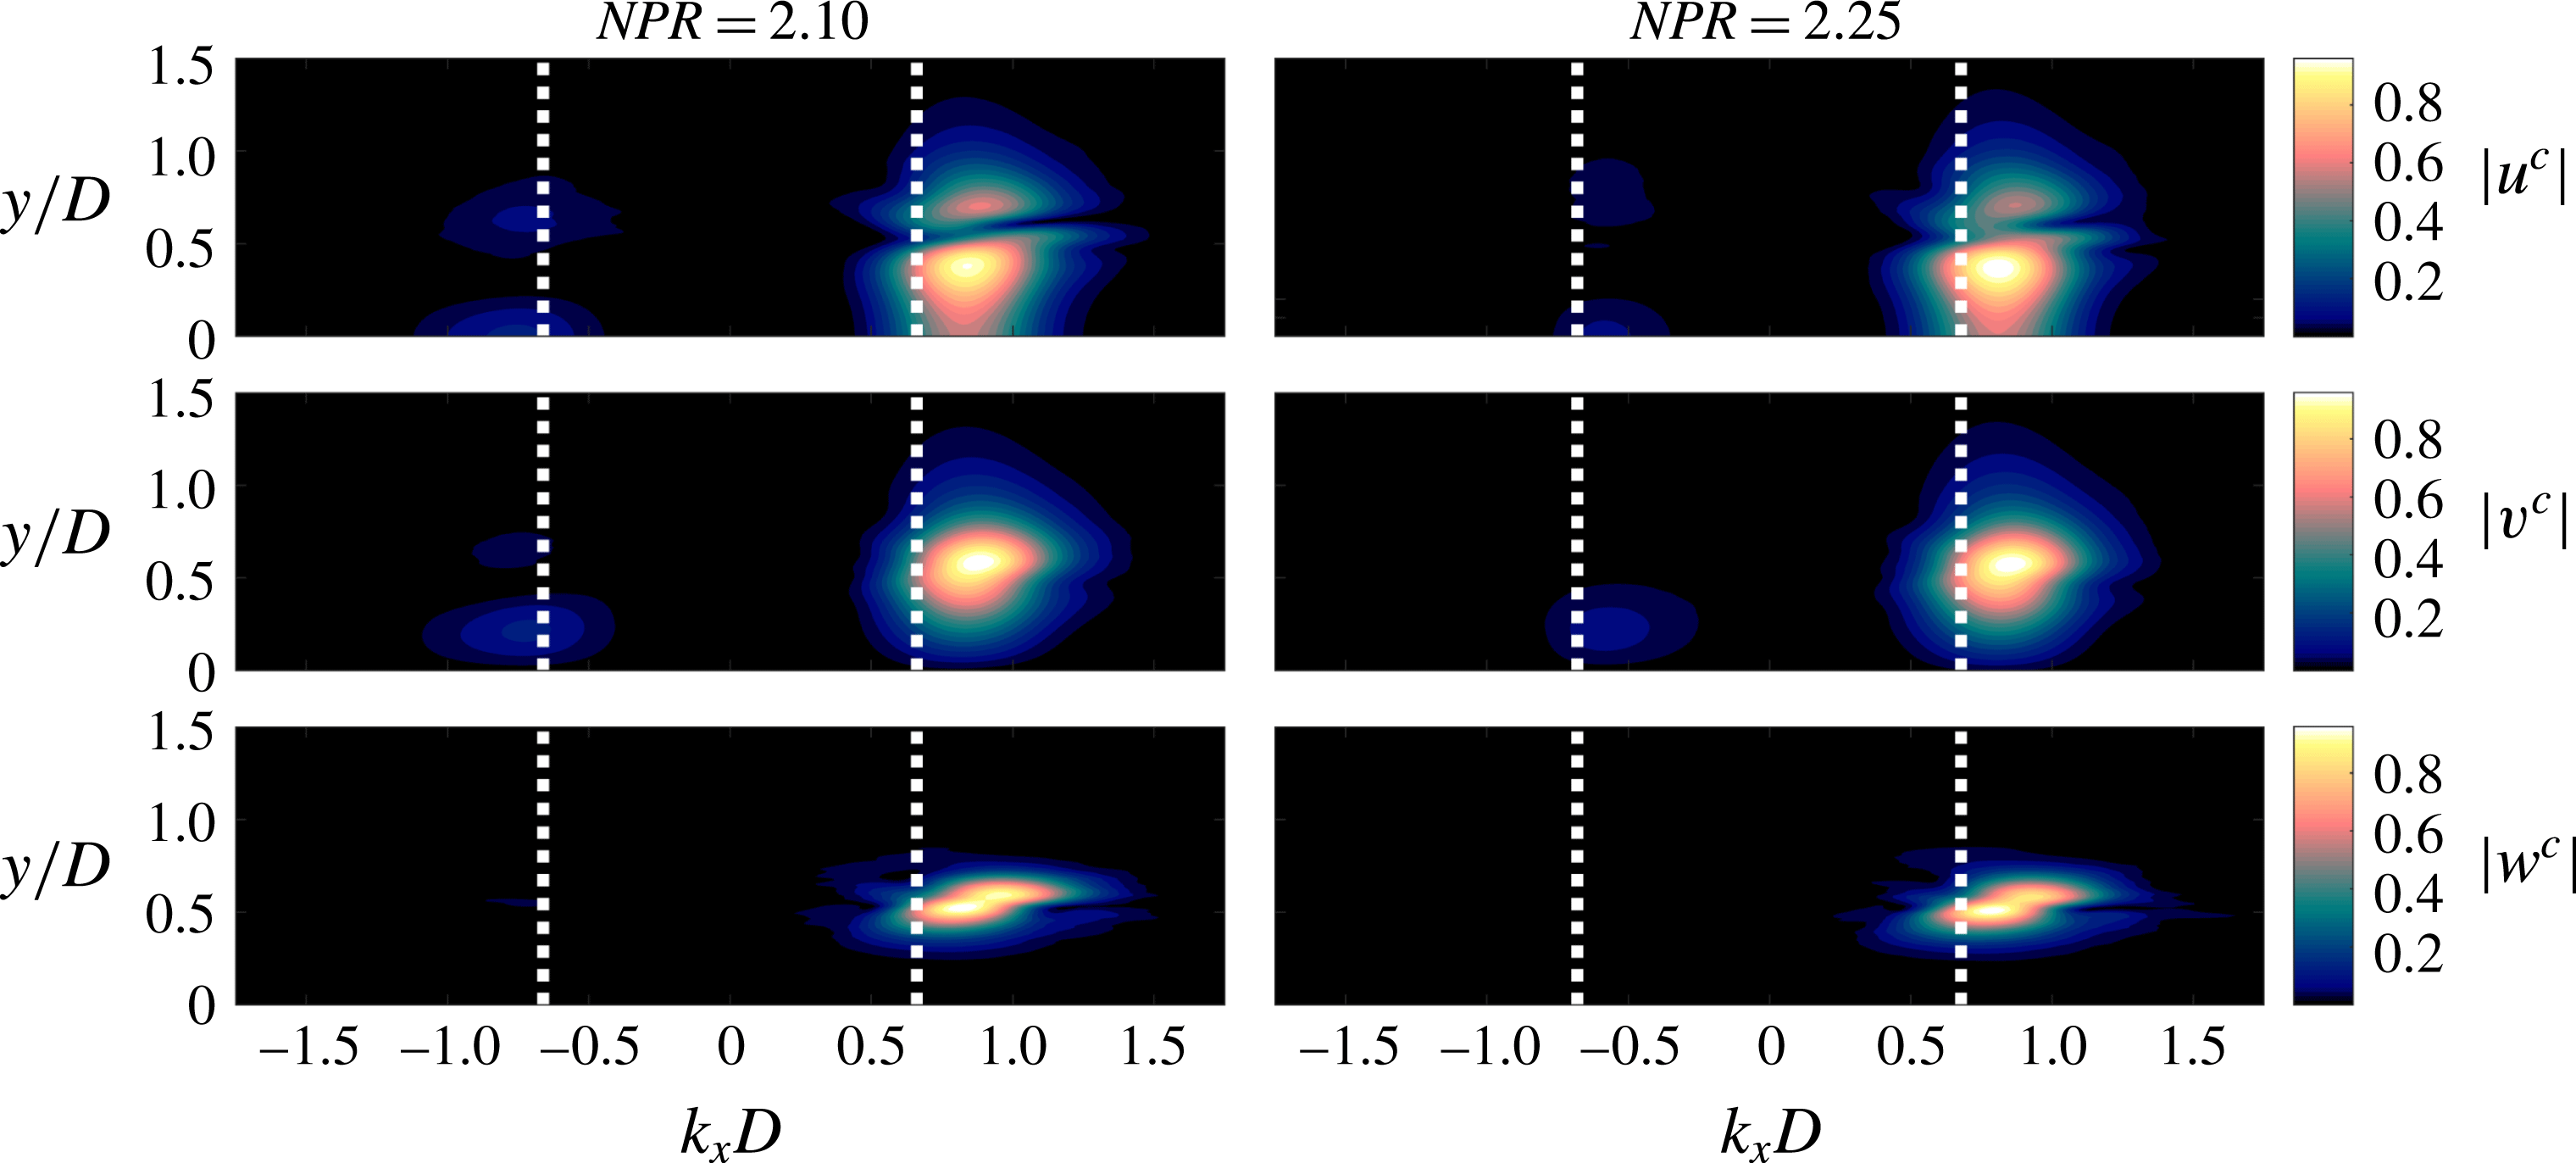
Axial, transverse and vortical wavenumber spectra at the screech frequency. Dotted vertical lines denote the speed of sound in the upstream and downstream directions. Negative wavenumbers correspond to phase velocities in the upstream direction, positive wavenumbers correspond to waves travelling downstream.

The amplitude of (3.5), for
 $\boldsymbol{q}^{c}=[\boldsymbol{u}^{c},\boldsymbol{v}^{c},\unicode[STIX]{x1D74E}_{z}^{c}]$
is plotted as a function of spatial wavenumber
 $k_{x}$
in figure 4. The sign of
 $k_{x}$
determines the sign of the phase velocity. We use the sign of the phase velocity as a proxy for the sign of the group velocity, which determines the direction of energy propagation, i.e. the direction the wave travels. This is justified by the fact that all of the waves in question, i.e. the Kelvin–Helmholtz waves, free-stream acoustic waves and upstream-travelling
 $k_{TH}^{-}$
waves, have phase and group velocities of the same sign in supersonic jets (Towne et al.
Reference Towne, Cavalieri, Jordan, Colonius, Schmidt, Jaunet and Brès2017).
The vertical white lines indicate wavenumbers associated with the upstream and downstream speed of sound
 $(a_{\infty })$
respectively, calculated as
 $k_{x}=\pm \unicode[STIX]{x1D714}_{s}/2\unicode[STIX]{x03C0}\times a_{\infty }$
. As expected, the majority of the fluctuating energy is associated with a downstream- travelling wave moving at approximately
 $U_{c}\approx 0.7U_{j}$
, with peak amplitudes in the shear layer of the jet. However, there is evidence of a component with negative phase speed for both the A1 and A2 cases, with a radial structure quite different from that of the downstream-travelling waves, and a propagation velocity close to the speed of sound. The minimal vorticity fluctuation and acoustic wavespeed indicate that this is an acoustic rather than hydrodynamic perturbation.
The upstream-travelling wave is isolated by bandpass filtering the space-time decomposed data (as per (3.5)) about the negative speed of sound, with a bandwidth of
 $\unicode[STIX]{x0394}k_{x}=0.45D$
. The downstream component is also isolated, by high-pass filtering for
 $k_{x}\geqslant 0$
. A reconstruction of the screech-tone phase cycle for both the upstream-travelling and downstream-travelling components can be viewed in Supplementary Movies 1 and 2 available at https://doi.org/10.1017/jfm.2018.642.
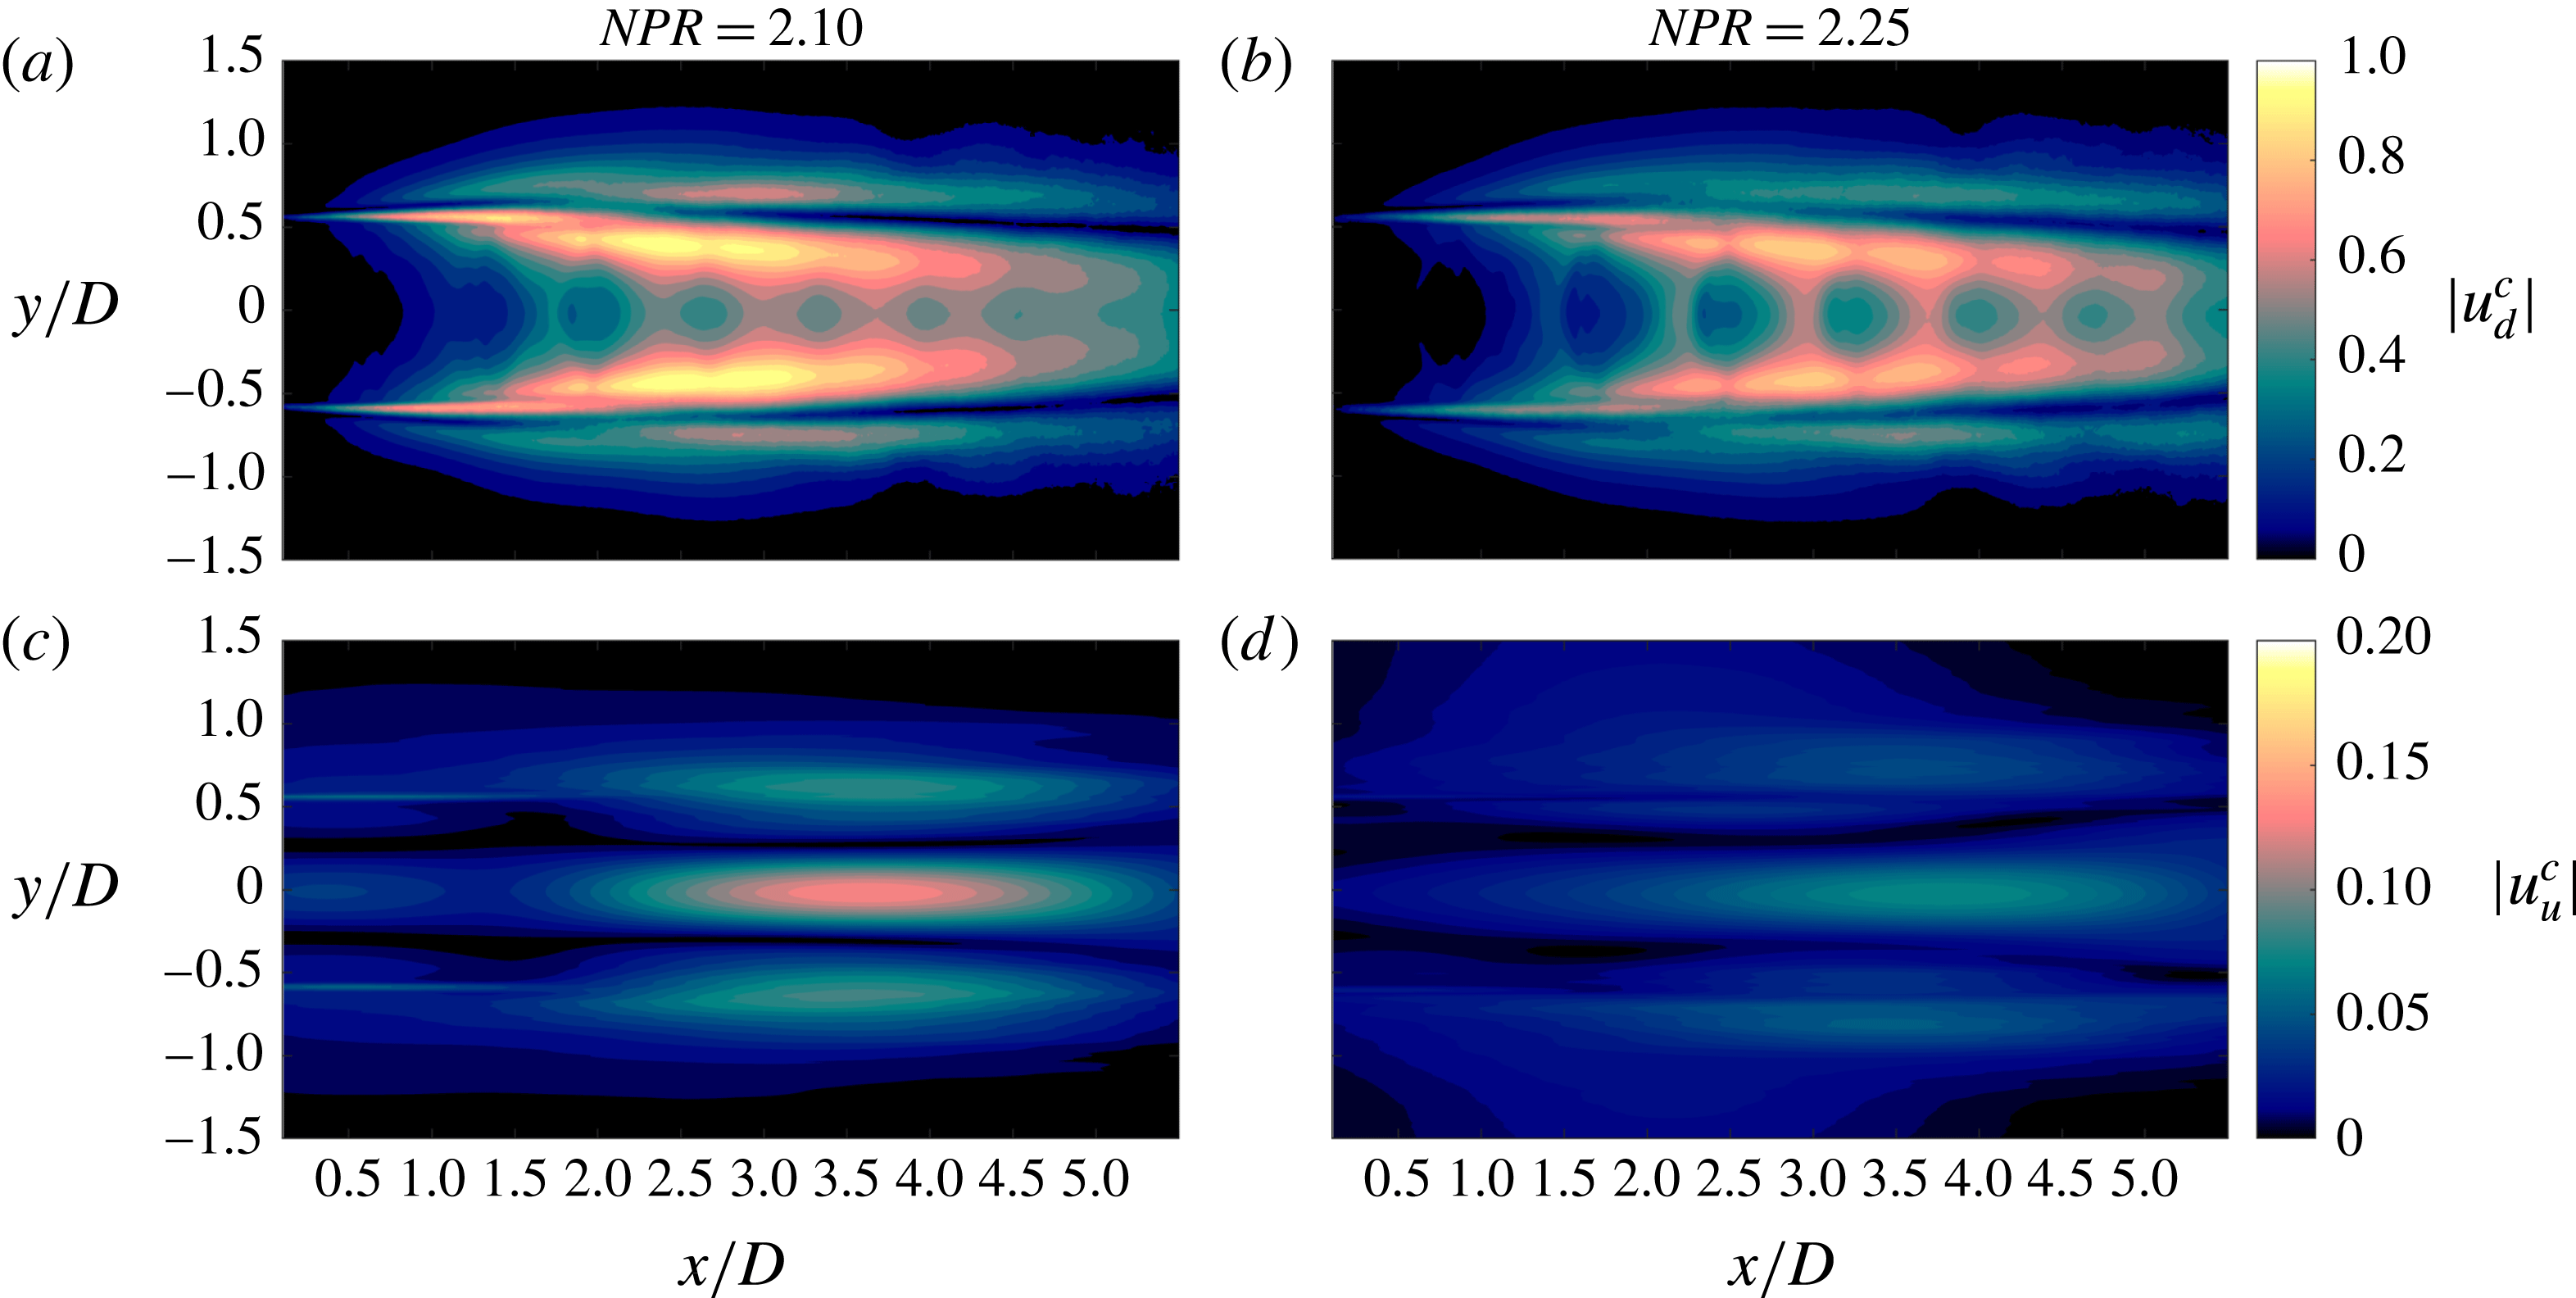
Amplitude distributions for downstream (
 $u_{d}^{c}$
) and upstream (
 $u_{u}^{c}$
) travelling components of the coherent axial velocity fluctuations determined from the leading POD mode pair. All values normalized by the maximum of
 $u_{d}^{c}$
.

The amplitudes of the components with positive and negative phase speed are presented in figure 5. The downstream fluctuations are dominated by the large-scale structures that develop from the Kelvin–Helmholtz instability, and the amplitude distribution here is consistent with the growth, saturation and decay of these wavepackets. For both cases, the spatial distribution of the downstream-travelling fluctuations is very similar: the majority of the fluctuation takes place in the shear layer, reaching a maximum around the fourth or fifth shock cell. Modulation of the large-scale structures by the shocks is evident even at this relatively low pressure ratio (Tan et al.
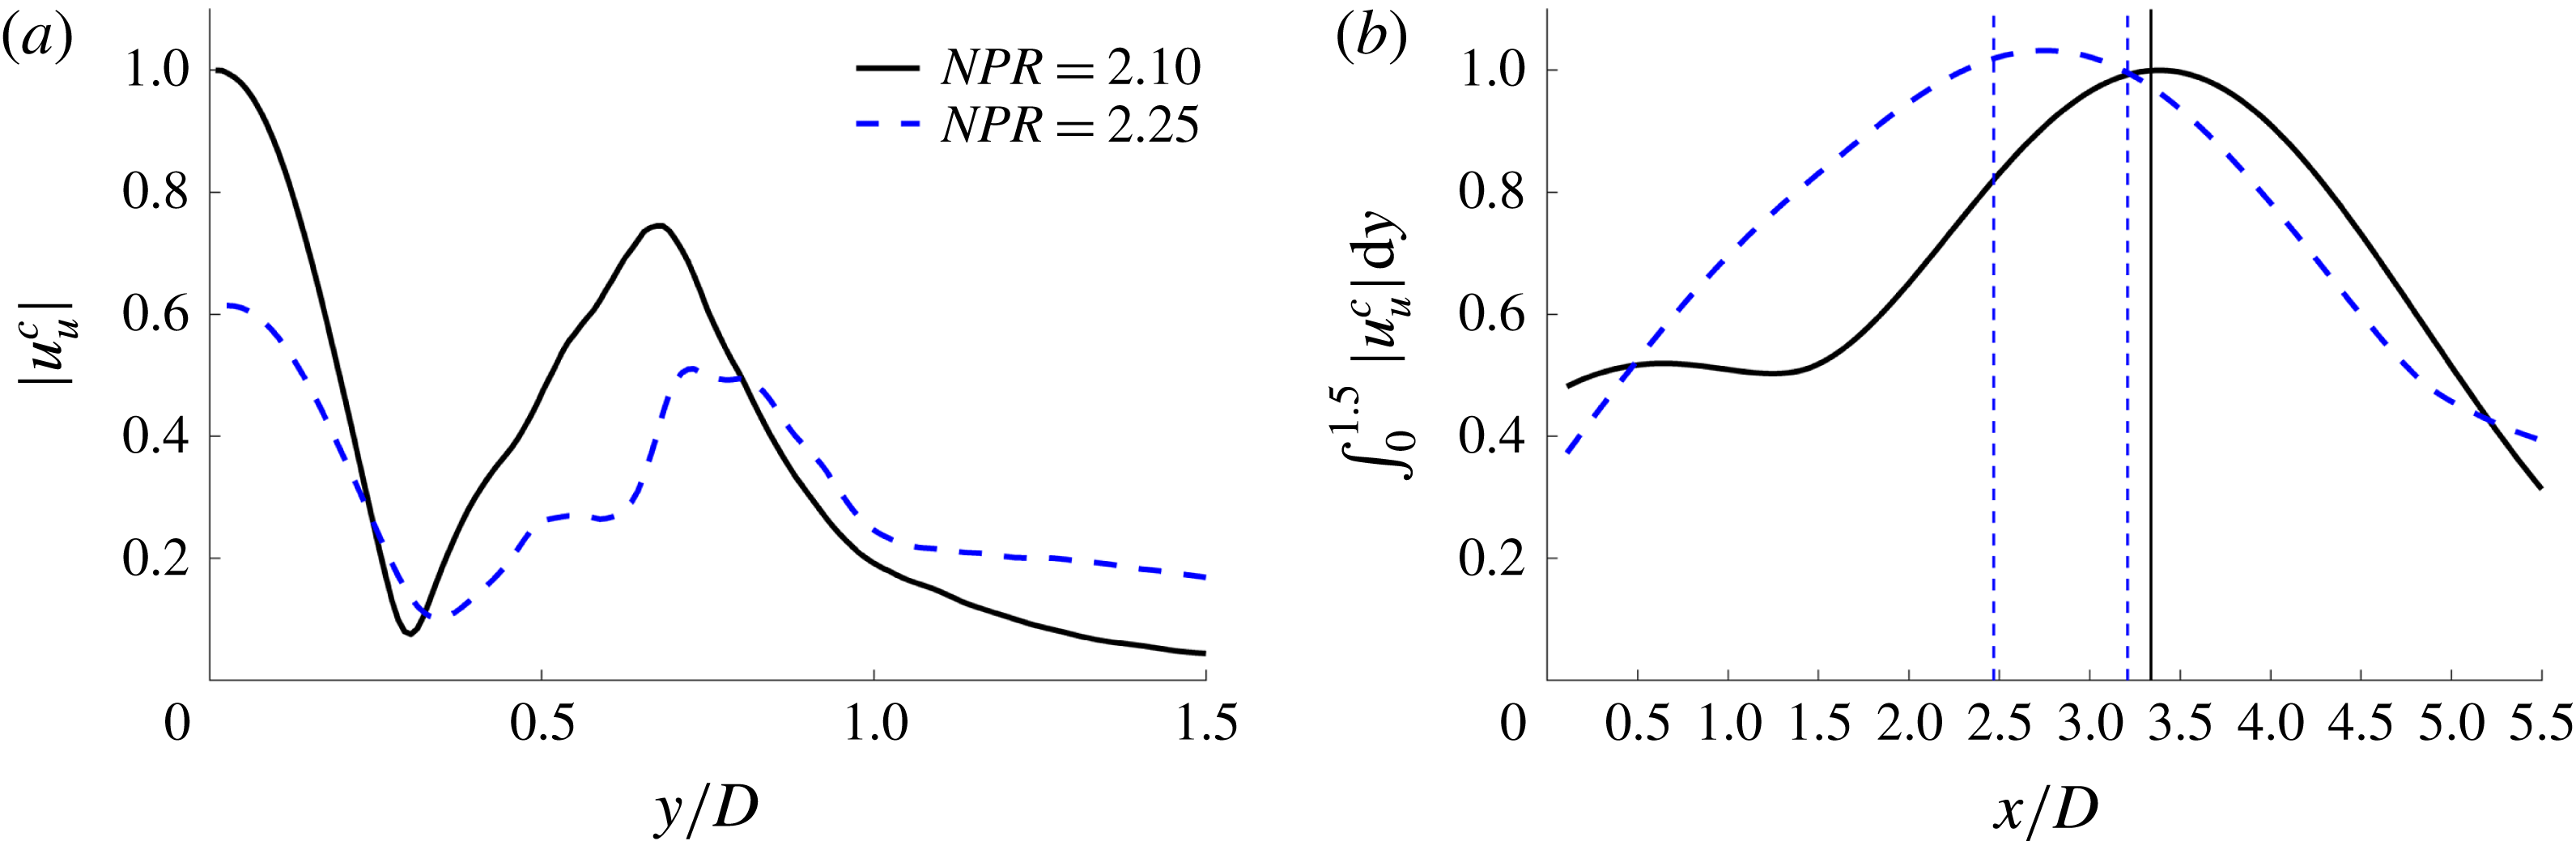
Reference Tan, Soria, Honnery and Edgington-Mitchell2017). The amplitude of the fluctuations associated with the negative phase-speed component presents a very different spatial distribution with much lower peak amplitude. For both cases, the amplitude peaks in the jet core, with a maximum occurring farther downstream than for the Kelvin–Helmholtz structures. The only notable difference between the two cases is evident in the radial profile at
 $x/D=2.5$
, plotted in figure 6; while the peak amplitudes are higher for
 $NPR=2.10$
, the radial amplitude decay begins slightly farther from the centreline for
 $NPR=2.25$
. Figure 6 also presents axial plots of transversely integrated amplitude (to account for axisymmetry). It is clear that the overall specific energy associated with the upstream mode is quite similar for both cases. For both jets there is an axial amplitude envelope, peaking between the third and fourth shock reflection points for
 $NPR=2.25$
and at the fifth shock cell for
 $NPR=2.10$
.
(a) Radial profile of the upstream-travelling mode amplitude, taken at
 $x/D=2.5$
, normalized by the maximum value of the
 $NPR=2.10$
mode. (b) Axial profile of the transverse integral of the upstream-travelling mode amplitude. Vertical lines in (b) indicate the location of shock reflection points: solid black line = fifth shock reflection point for
 $NPR=2.10$
, dashed blue lines = third and fourth shock reflection points for
 $NPR=2.25$
.

Thus for both the A1 and A2 stages, the following statement may be made: there is a mode with negative phase speed and radial support in both the core and the shear layer. This mode has a phase velocity nearly equal to the speed of sound, and does not appear to be hydrodynamic in nature. The signature of this mode appears for both the A1 and A2 stages of jet screech.
4.2 Predictions from theory
To verify whether the upstream-travelling mode is that originally identified by Tam & Hu (Reference Tam and Hu1989), we use a cylindrical vortex sheet to model the upstream-travelling waves. The dispersion relation was first derived by Lessen, Fox & Zien (Reference Lessen, Fox and Zien1965) and has been used to study stability behaviour of a variety of subsonic and supersonic jets, for instance by Michalke (Reference Michalke1970), Towne et al. (Reference Towne, Cavalieri, Jordan, Colonius, Schmidt, Jaunet and Brès2017), Jordan et al. (Reference Jordan, Jaunet, Towne, Cavalieri, Colonius, Schmidt and Agarwal2018), and of course in the original work of Tam & Hu (Reference Tam and Hu1989). It can be written:
 $$\begin{eqnarray}\frac{1}{(\unicode[STIX]{x1D714}-kM)^{2}}+\frac{1}{T}\frac{\text{I}_{m}\left({\displaystyle \frac{\unicode[STIX]{x1D6FE}_{i}}{2}}\right)\left[{\displaystyle \frac{\unicode[STIX]{x1D6FE}_{o}}{2}}\text{K}_{m-1}\left({\displaystyle \frac{\unicode[STIX]{x1D6FE}_{o}}{2}}\right)+m\text{K}_{m}\left({\displaystyle \frac{\unicode[STIX]{x1D6FE}_{o}}{2}}\right)\right]}{\text{K}_{m}\left({\displaystyle \frac{\unicode[STIX]{x1D6FE}_{o}}{2}}\right)\left[{\displaystyle \frac{\unicode[STIX]{x1D6FE}_{i}}{2}}\text{I}_{m-1}\left({\displaystyle \frac{\unicode[STIX]{x1D6FE}_{i}}{2}}\right)+m\text{I}_{m}\left({\displaystyle \frac{\unicode[STIX]{x1D6FE}_{i}}{2}}\right)\right]}=0.\end{eqnarray}$$
The spatial eigenvalues of the vortex sheet are given by the roots
 $k(\unicode[STIX]{x1D714})$
for real values of
 $\unicode[STIX]{x1D714}$
. These are found using Fletcher’s version of the Levenberg–Marquardt algorithm for minimizing a sum of squares of the equation residuals. For a given eigenvalue
 $k(\unicode[STIX]{x1D714})$
, the streamwise velocity of the corresponding eigenfunction is
 $$\begin{eqnarray}u_{x}(r)=\left\{\begin{array}{@{}ll@{}}-{\displaystyle \frac{k\text{I}_{m}(\unicode[STIX]{x1D6FE}_{i}r)}{Mk-\unicode[STIX]{x1D714}}}\quad & \text{for}~0\leqslant r\leqslant 0.5\\ -{\displaystyle \frac{k\text{K}_{m}(\unicode[STIX]{x1D6FE}_{o}r)}{Mk-\unicode[STIX]{x1D714}}}\quad & \text{for}~r\geqslant 0.5.\end{array}\right.\end{eqnarray}$$
I
 $_{m}$
and K
 $_{m}$
are
 $m$
th-order, modified Bessel functions of the first and second kind, respectively,
 $$\begin{eqnarray}\unicode[STIX]{x1D6FE}_{i}=\sqrt{k^{2}-(\unicode[STIX]{x1D714}-Mk)^{2}},\quad \text{and}\quad \unicode[STIX]{x1D6FE}_{o}=\sqrt{k^{2}-\unicode[STIX]{x1D714}^{2}}.\end{eqnarray}$$
The branch cut of the square root is chosen such that the real parts of
 $\unicode[STIX]{x1D6FE}_{i,o}$
are positive.
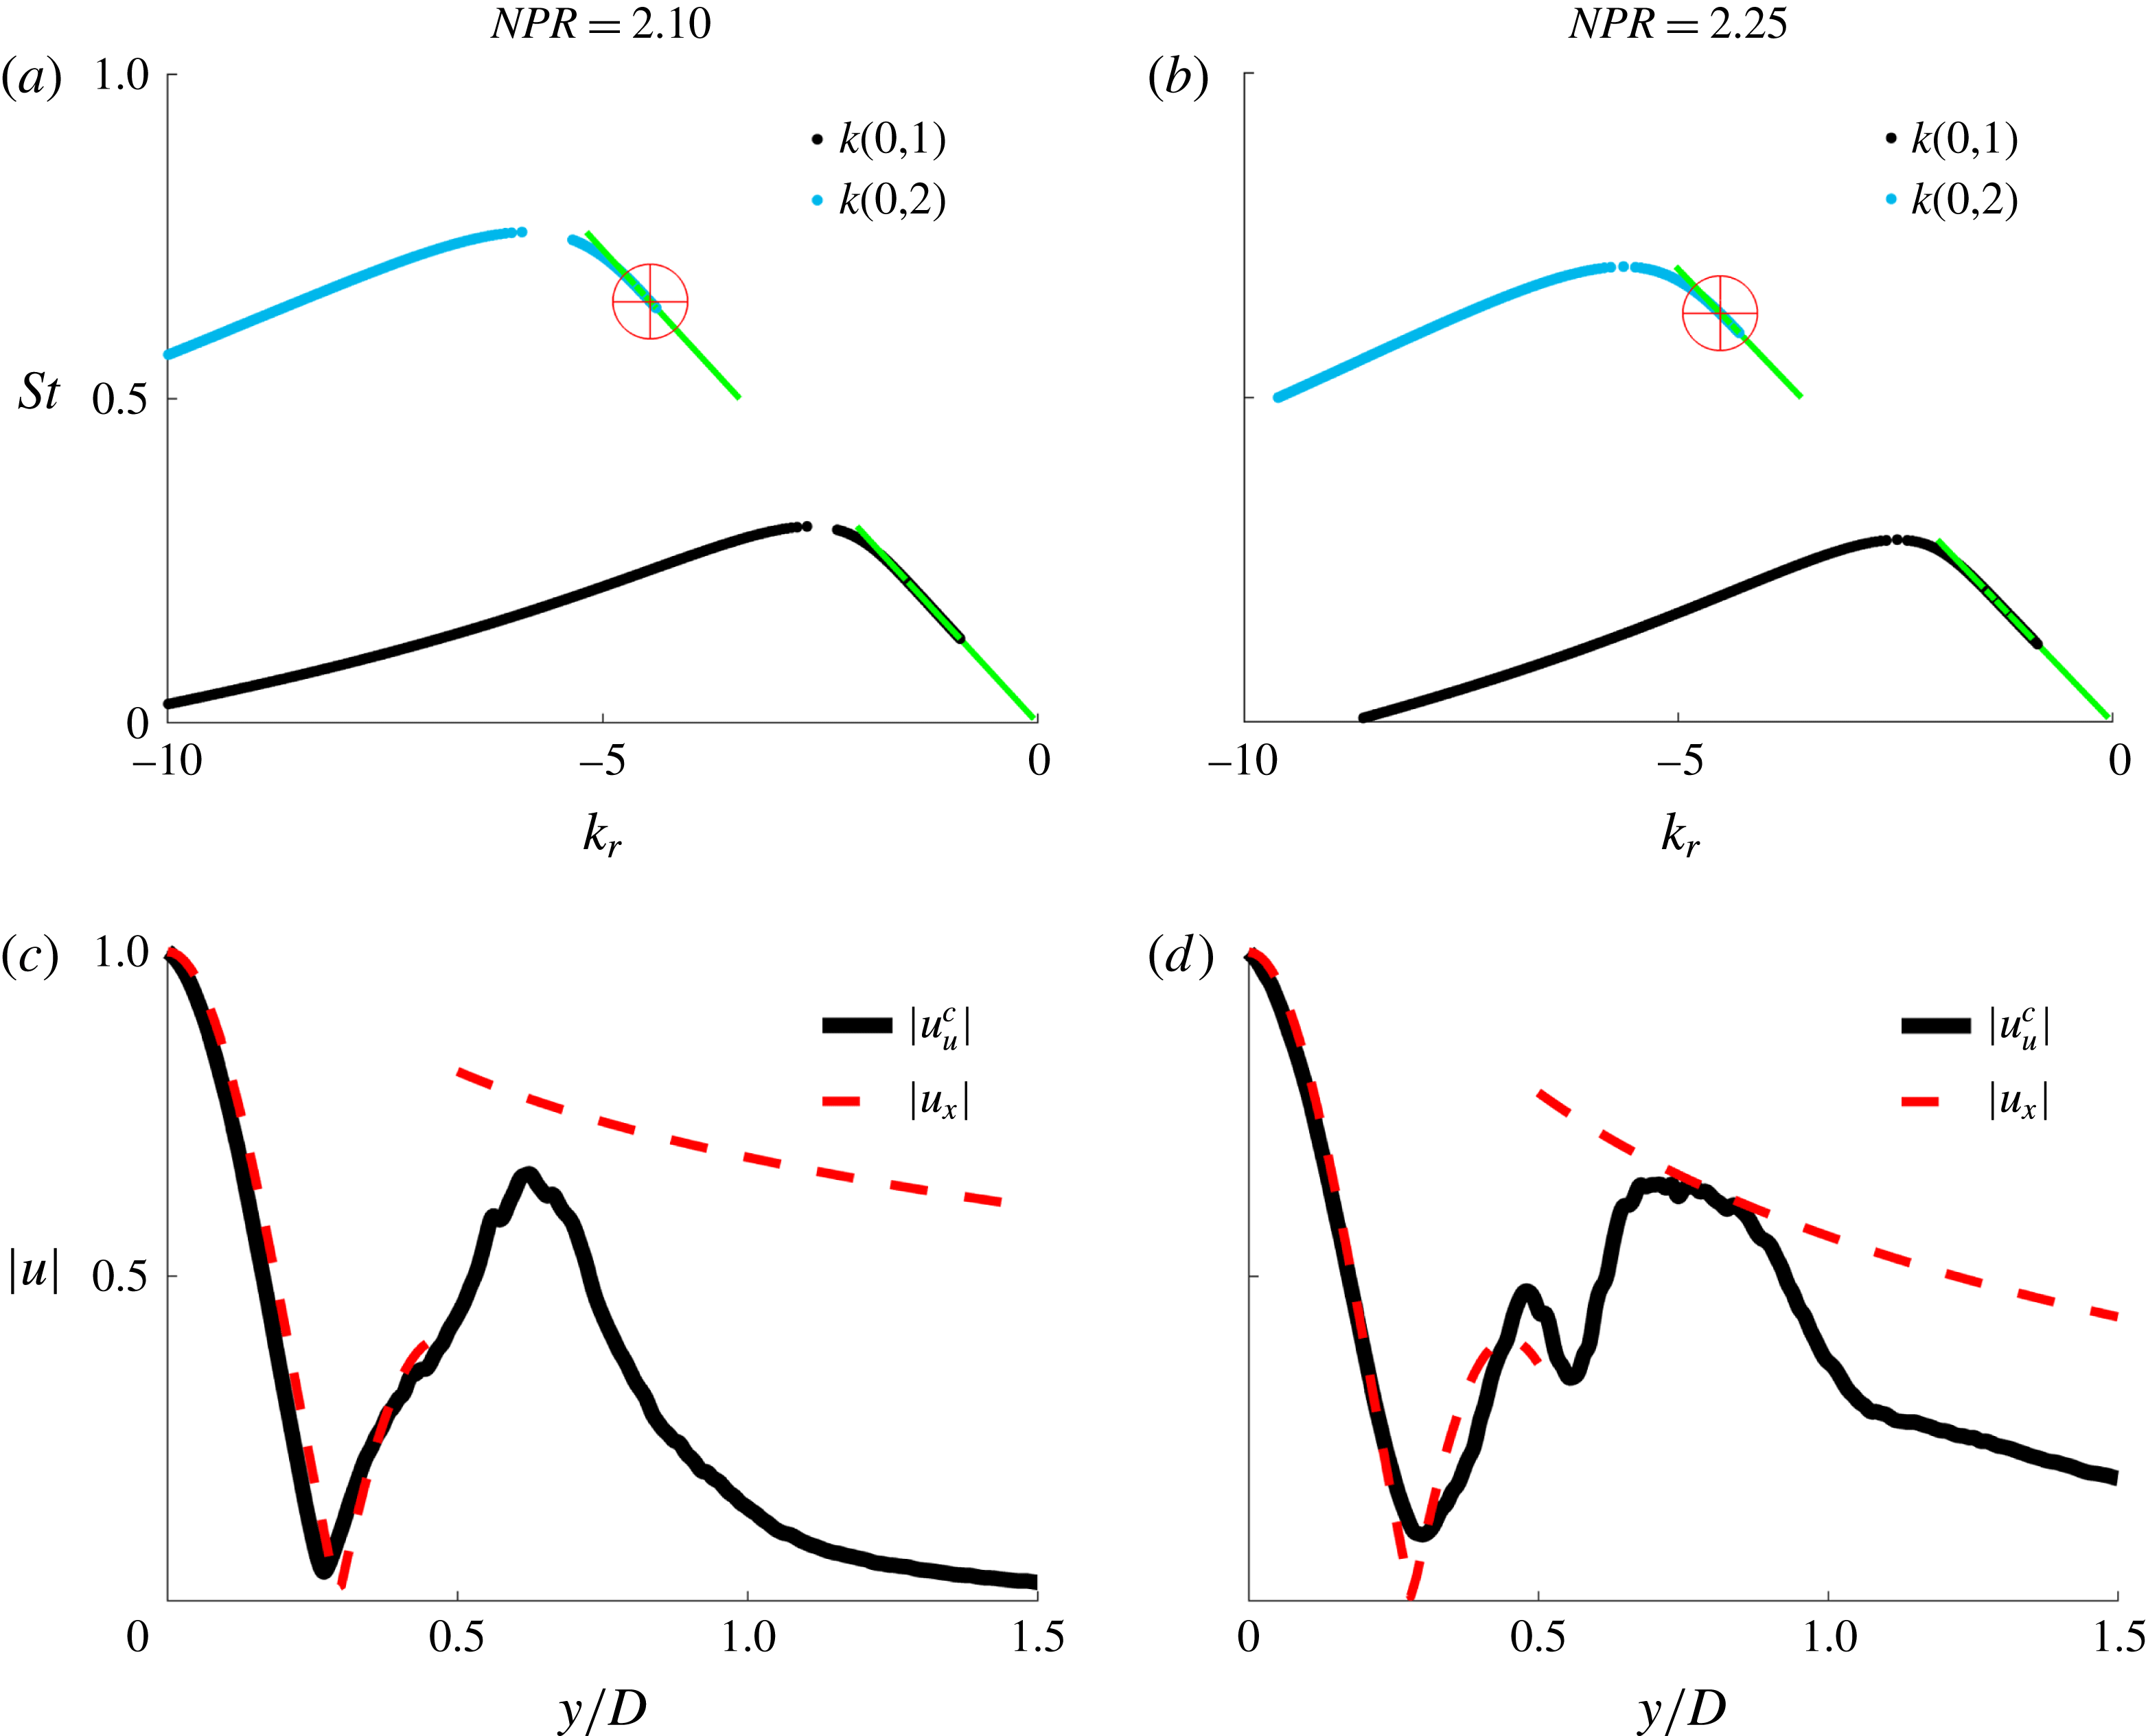
(a,c) Cylindrical vortex-sheet dispersion relations for waves
 $k(m,n)$
. The green line shows dispersion relations for upstream-travelling free-stream sound waves. The red cross-hairs identify the eigenvalue considered for comparison with the experimental data. (b,d) Comparison of an experimentally educed
 $|u_{u}^{c}|$
as per figure 5, extracted at an axial position of
 $x/D=3.0$
, with the vortex-sheet eigenfunction
 $|u_{x}|$
associated with the selected eigenvalue. Cartesian coordinates are used for the axis, with the radial coordinate in the vortex-sheet model transformed such that
 $y=r$
.

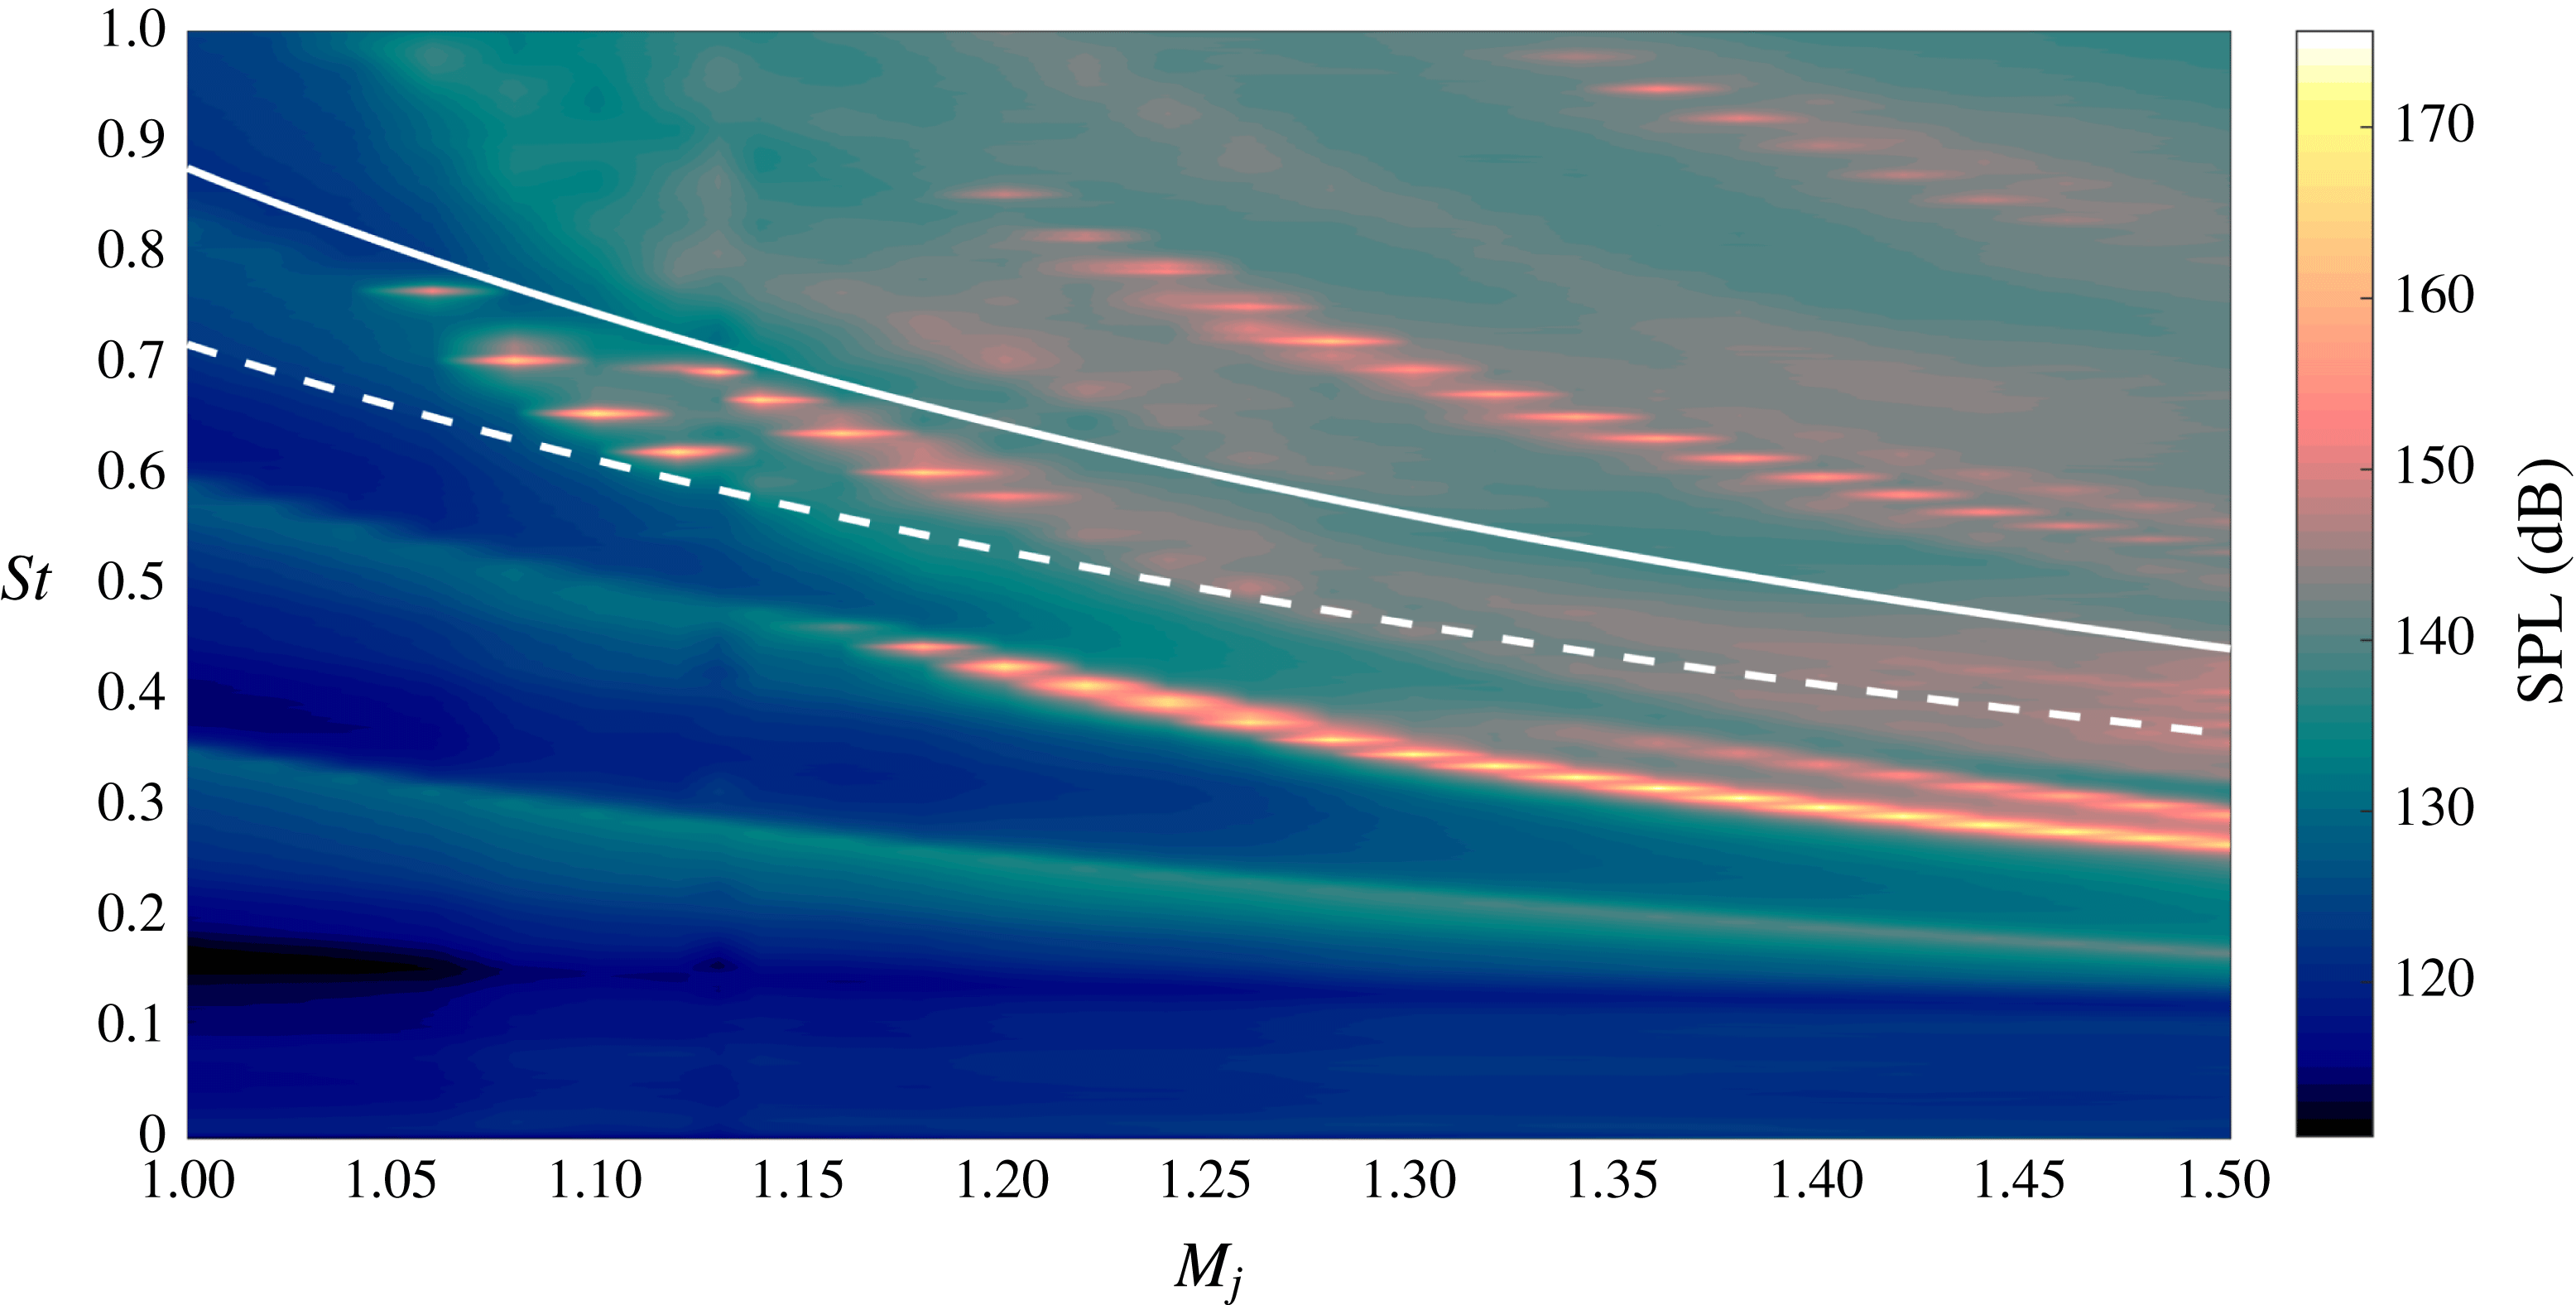
Contours of sound pressure level (SPL) as a function of jet operating conditions. The dashed white line indicates the cut-on frequency for the
 $(m,n)=(0,2)$
 $k_{TH}^{-}$
mode at a given Mach number; below this frequency the mode is evanescent. The solid white line indicates the cutoff frequency; above this frequency the mode is evanescent. The region bounded by the curves thus represents the range of
 $M$
–
 $St$
space where the
 $k_{TH}^{-}$
mode is propagative.

For each azimuthal wavenumber
 $m$
, there exists a countably infinite set of solutions
 $n=1,2,3,\ldots$
that are ordered according to their effective radial wavenumber
 $n$
(Towne et al.
Reference Towne, Cavalieri, Jordan, Colonius, Schmidt, Jaunet and Brès2017). Figure 7 shows the dispersion relations associated with upstream- and downstream-travelling waves of azimuthal-radial orders
 $(0,1)$
and
 $(0,2)$
. The red cross-hairs identify the eigenvalue selected for comparison with the measured amplitude of the upstream-travelling component
 $u_{u}^{c}$
, also shown in figure 7(b). The agreement between model and experiment is remarkable, given that a vortex-sheet model is being used to compare with a non-parallel, nonlinear, shock-containing jet. The inner structure of the wave is captured with excellent accuracy by the vortex sheet, and the amplitude jump across the shear layer is captured at least qualitatively.
The agreement in the inner region suggests that the upstream-travelling wave may indeed be a
 $k_{TH}^{-}$
wave; however, the continuous branch of the vortex-sheet eigenvalue spectrum (representing free-stream acoustic waves) is characterized by modes with similar eigenfunctions. Demonstrating that the
 $k_{TH}^{-}$
mode is the upstream component of resonance requires a consideration of the frequencies over which this mode is propagative. Figure 8 presents acoustic data acquired in the SUCRE (SUpersoniC REsonance) semi-anechoic jet facility at Institut PPRIME. Overlaid on the acoustic spectra are lines indicating the cut-on and cutoff frequencies for the
 $(m,n)=(0,2)$
 $k_{TH}^{-}$
mode as a function of Mach number, determined from the vortex-sheet analysis. In the region bounded by these curves, the
 $k_{TH}^{-}$
mode is propagative; outside this range, the mode is evanescent. All of the observed tones for both the A1 and A2 modes fall within the frequency range where the mode is propagative; no resonance involving axisymmetric tones is observed outside of this range. This strongly supports the hypothesis that it is the
 $k_{TH}^{-}$
mode observed in the experimental data, and that this mode is responsible for closing the resonance loop. Shen & Tam (Reference Shen and Tam2002) suggested that the A1 and A2 modes were closed by different mechanisms: free-stream acoustic waves for the A1 mode, and the
 $k_{TH}^{-}$
mode identified by Tam & Hu (Reference Tam and Hu1989) for the A2 mode. However the radial structures in figure 7 and the cut-on/cutoff behaviour observed in figure 8 suggest the same mechanism is at work for both the A1 and A2 screech stages.
5 Conclusion
Experimental evidence has been provided to suggest that the upstream-travelling wave that closes the A1 and A2 modes of jet screech is not a free-stream acoustic wave. Rather it is a discrete acoustic jet mode with support in both the jet core and shear layer. The experimental data has been supported by comparison with a vortex-sheet model, demonstrating close agreement between the measured and modelled radial structures of the modes. It has further been demonstrated that resonance only occurs for the frequency–Mach number range where the
 $k_{TH}^{-}$
is propagative. In contrast to the original suggestion of Shen & Tam (Reference Shen and Tam2002), we see evidence that the upstream propagation is the same neutrally-stable acoustic mode for both the A1 and A2 jet screech modes. That the upstream-travelling mode is an intrinsic mode of the jet represents a significant change in the understanding of the screech phenomena, and will hopefully pave the way to a full phenomenological explanation.
Acknowledgements
This research was supported by the Australian Research Council through the Discovery Project scheme. The authors would also like to acknowledge the valuable contributions of Professor K. Oberleithner and Professor A. Cavalieri.
Supplementary movies
Supplementary movies are available at https://doi.org/10.1017/jfm.2018.642.