

In January 2018, the Italian parliament approved an increase in military presence in Libya and the deployment of hundreds of troops in Niger (Scherer Reference Scherer2018). The main centre-left and centre-right parties supported all the planned military operations abroad, which have constantly been a key aspect of post-Cold War Italian foreign policy (Brighi Reference Brighi2013; Carati and Locatelli Reference Carati and Locatelli2017; Ignazi et al. Reference Ignazi, Giacomello and Coticchia2012). However, despite the significant military contributions provided by Italy to regional and international security in the last decades, the overall attention devoted to the debates and votes regarding these deployments within the legislative assembly (as well as the role of parliamentary oversight) has been extremely limited.
This article seeks to contribute to the growing literature on ‘parliamentary war powers’, presenting a brand-new data set of parliamentary votes on the deployment of the Italian armed forces in the post-Cold War era. After the end of the bipolar era, the military activism of several Western powers has raised questions about parliamentary control, fostering increasing research and analyses on features, drivers and consequences of different kinds of formal and informal oversight (or lack thereof) exerted by legislative assemblies over security and defence policy. In line with this mounting scholarly debate (Auerswald and Saideman Reference Auerswald and Saideman2014; Dieterich et al. Reference Dieterich, Hummel and Marschall2010; Mello Reference Mello2014; Peters and Wagner Reference Peters and Wagner2011; Wagner et al. Reference Wagner, Herranz-Surrallés, Kaarbo and Ostermann2017), we focus on the under-studied case of Italy. More specifically, the article answers the following research question: how did Italian parties vote on military operations abroad in the post-Cold War era?
The findings allow an assessment of whether the Italian case matches the expectations of the literature. Indeed, we find that parties are in general more supportive than supposed. Features of the law-making process, government–opposition dynamics and ideological leaning all contribute to explain whether a party votes in favour of a military operation or not. In particular, in line with previous literature (Wagner et al. Reference Wagner, Herranz-Surrallés, Kaarbo and Ostermann2017), we observe that party support follows a curvilinear model on the left–right axis: centrist parties are more in favour of troop deployments abroad than those at the extremes. We conclude that future research might seek to determine if other cleavages such as green-alternative-libertarian vs. traditional-authoritarian-nationalist (GAL–TAN) (Hooghe et al. Reference Hooghe, Marks and Wilson2002) may better explain such parliamentary votes.
The goals of the article are threefold. First, we present the first detailed and comprehensive analysis of parliamentary votes regarding Italian military deployment, from the war in Iraq in 1990 to the most recent operations in the Mediterranean and in Iraq against ISIL. Second, the article assesses selected arguments developed by the literature on political parties and foreign policy in the Italian case. Then, we derive additional hypotheses from the data that can be tested in further studies, advancing new perspectives on political parties and security issues. Third, we contribute to the limited debate on Italian defence, illustrating the evolution of deployment votes in a cross-time analysis.
The aim of the article is not to trace in formal ways causal relations between variables but to provide a detailed picture of the ways through which Italian parties voted on missions, emphasizing recurring patterns. The article is structured as follows. After reviewing the literature on political parties and foreign policy, we present the Italian case, the main arguments and the methods adopted in the data collection. The results of the empirical analysis are reported through various tables. Finally, we discuss to what extent the findings allow a confirmation (or confutation) of the selected arguments on parties and military operations, paving the way for further research.
Political parties and foreign policy: a controversial debate
According to Juliet Kaarbo (Reference Kaarbo2015: 195), foreign policy analysis (FPA) research ‘has consistently shown the significance of domestic politics and decision making to issues central to international politics’, including international military interventions. However, comparative politics and international relations (IR) have generally devoted limited attention to parliaments and parties in foreign and security policy. While in international relations structural realism has strongly denied the role of domestic factors as explaining variables of international behaviour, conflicts among parties over foreign and security policies have seldom been taken up by scholars of comparative politics (Wagner et al. Reference Wagner, Herranz-Surrallés, Kaarbo and Ostermann2017). Nevertheless, a ‘domestic turn’ in international relations (Kaarbo Reference Kaarbo2015) has fostered a growing interest in how domestic political and decision-making factors affect actors’ choices and policies. The established ‘democratic peace theory’ (Maoz and Russet Reference Maoz and Russett1993), the post-Cold War blurring of boundaries between domestic and foreign policy (Raunio and Wagner Reference Raunio and Wagner2017), as well as the increasingly involvement of parliaments in matters of defence and security policy – such as peacekeeping or peace-building operations – have surely encouraged such development.
Schematically, we can highlight three main axes of contention within the debate on the consequences of domestic political processes on foreign policy behaviour. To wit, the recent literature has explored how parties, parliaments and coalitions affect foreign and defence policymaking.
First, scholars have attempted to ‘bring political parties in’ to the debate (Schuster and Maier Reference Schuster and Maier2006). Brian Rathbun (Reference Rathbun2004) focused on partisanship in foreign policy, emphasizing how national interest is not ‘given’ (but rather defined by parties) and illustrating how different ideological roots can explain the different propensity to intervene militarily. Along these lines, others (Bjereld and Demker Reference Bjereld and Demker2000; Schuster and Maier Reference Schuster and Maier2006) have stressed how ideology represents the main source of party disagreement over foreign policy. Specifically, the ways the party’s left/right positioning influences foreign and security policy have been investigated, often presenting divergent findings. The classic approach – positing ‘doves’ on the left and ‘hawks’ on the right (Heffington Reference Heffington2018; Palmer et al. Reference Palmer, London and Regan2004) – has been contested, highlighting, for instance, how support for military operations abroad is ‘curvilinear’, increasing from the left to the centre right and then declining again towards the radical right (Wagner et al. Reference Wagner, Herranz-Surrallés, Kaarbo and Ostermann2017). A more nuanced picture on partisanship and foreign policy emerged from other studies (Haesebrouck Reference Haesebrouck2016), while membership of a party family represents a crucial variable for several authors who examine parties at the EU level (Hix Reference Hix1999). Rather than focusing on the left–right cleavage, other scholars (Hooghe et al. Reference Hooghe, Marks and Wilson2002) have pointed out the relevance – also in foreign policy – of the so-called GAL–TAN cleavage.
Second, and relatedly, several authors (Kaarbo and Beasley Reference Kaarbo and Beasley2008; Oppermann and Brummer Reference Oppermann and Brummer2014) have examined how coalition politics affects foreign policy, assessing parties’ ideological positions (Clare Reference Clare2010) and size in the parliament and in the government (Oktay and Beasley Reference Oktay and Beasley2016). For instance, Juliet Kaarbo and Ryan Beasley (2008) have illustrated how junior parties may hijack vulnerable coalitions in government, leading to an ‘extreme’ foreign policy. Kai Opperman and Klaus Brummer (2014) have revealed how the saliency of the issue and the portfolio (e.g. the control of a ministry relevant to foreign policy, etc.) play a role for parties in coalition. In contrast, Fabrizio Coticchia and Jason Davidson (Reference Coticchia and Davidson2018), focusing on the case of Italy, have shown how junior radical parties may be reluctant to threaten or force government collapse (because, for example, they fear that voters will blame them for bringing the opposition into power). Along with the more general findings of Wolfgang Wagner et al. (Reference Wagner, Herranz-Surrallés, Kaarbo and Ostermann2017), we would expect a relatively high level of cohesiveness among governing parties.
Third, a literature on ‘parliamentary war powers’ has recently emerged (Dieterich et al. Reference Dieterich, Hummel and Marschall2010; Lagassè and Mello Reference Lagassè and Mello2018; Peters and Wagner Reference Peters and Wagner2011; Wagner et al. Reference Wagner, Herranz-Surrallés, Kaarbo and Ostermann2017), highlighting the variations in parliamentary control of post-Cold War military dynamism, identifying the causes behind the differences (e.g. features of the political system, the state’s international context, etc.), the benchmarks of parliamentary oversight (from complete exclusion to veto power) and the consequences in terms of defence and security policy. Recent analyses (Mello and Peters Reference Mello and Peters2018; Raunio and Wagner Reference Raunio and Wagner2017) have stressed the gaps that still need to be addressed in the ‘parliamentary war powers’ literature, such as the excessive attention devoted to formal powers (rather than to informal ones) or the limited interest in how parliaments oversee deployments. In this sense, analysing national parliaments’ scrutiny over EU-led operations, Giovanna Bono (Reference Bono2005) has emphasized the impact of law-making procedures and their timing in determining the balance between legislative and executive. Above all, some cases appear particularly ambiguous and the findings of existing research are still controversial. The complex evolution of the legislative procedures across time, the persistence of informal and vague mechanisms and the problematic access to the sources may all have contributed to the scant considerations given to some countries within the growing debate on parliamentary war powers. Italy surely represents one of these countries.
The case of Italy
The overall post-Cold War debate on Italian foreign and defence policy is still limited. Recent literature has tried to understand the reasons for this shortcoming, focusing on non-excluding factors such as the post-World War II history, political culture and ‘pacifist’ public opinion (Carati and Locatelli Reference Carati and Locatelli2017; Ignazi et al. Reference Ignazi, Giacomello and Coticchia2012). Despite this academic and public ‘indifference’, the transformation of Italian defence after the fall of the Berlin Wall has been remarkable: Italian troops became involved in many operations abroad (from Iraq and Somalia to the Balkans, from Lebanon to Afghanistan and Libya), providing a noticeable contribution to multilateral institutions and to international security. Moreover, considerable defence sector reforms have been undertaken, while the Italian military is now one of the country’s most trusted institutions, largely because of its ‘peace missions’ (Battistelli et al. Reference Battistelli, Galantino, Fay Lucianetti and Striuli2012).
Nevertheless, the attention paid to Italian parties and defence policy has generally remained inadequate. There are few studies on the nexus between parliament and defence issues (Bono Reference Bono2005; D’Amore Reference D’Amore2001), on parties and coalition foreign policy (Coticchia and Davidson Reference Coticchia and Davidson2018; Verbeek and Zaslove Reference Verbeek and Zaslove2015) and almost none on voting patterns across the entire post-Cold War period.Footnote 1 Indeed, the above-mentioned consequences of parliamentary oversight on defence policy have never been examined in the case of Italy. Moreover, especially because of the significant military contribution provided in recent decades and the widespread ‘pacifist strategic culture’, Italy represents an excellent case in which to investigate partisanship and foreign policy, assessing the supposed ‘curvilinear’ support for military operations (Wagner et al. Reference Wagner, Herranz-Surrallés, Kaarbo and Ostermann2017). Finally, the ways through which parties’ affiliations influence foreign policies have also been almost entirely ignored by the literature and, thus, merit attention.
At the same time, the few emerging perspectives on Italian parties and foreign policy have never been examined through a large-N analysis of voting patterns on the missions abroad. For instance, Maurizio Carbone (Reference Carbone2007) illustrated the domestic foundation of the Italian debate on foreign policy issues. Accordingly, the support of political parties for a specific military mission depends more on the contingencies of domestic political debate than on the nature or the goals of the operations on the ground. Other authors have also scrutinized party culture and ideology (Carati and Locatelli Reference Carati and Locatelli2017; Ignazi et al. Reference Ignazi, Giacomello and Coticchia2012), stressing the existence of a bipartisan consensus over Italian military dynamism, based on a pacific, multilateral and humanitarian narrative. But, as said, these views have never been assessed through a comprehensive and cross-time analysis of voting patterns on Italian military operations since the bipolar era.Footnote 2
This article aims to fill this gap, providing a new data set of parliamentary votes on Italian missions abroad, from the beginning of the 1990s to the current fight against ISIL (2014 and beyond). Before presenting the results, it is worth briefly summarizing the complex post-Cold War evolution of Italian legislation and parliamentary oversight on missions abroad.
The Italian parliament and military operations
Scholars debated the competences of the Italian parliament regarding war powers, the scope of which Dirk Peters and Wolfgang Wagner (2011) observe is ‘far from being clear-cut’. While some have labelled Italy’s system one of ‘rigid parliamentary control’ (Dieterich et al. Reference Dieterich, Hummel and Marschall2010), others stress the parliament’s veto rights over the executive (Mello Reference Mello2014). In short, the Italian case remains ‘inconclusive’ (Peters and Wagner Reference Peters and Wagner2011, 189), warranting further analysis.
The ‘lack of consensus’ (Mello Reference Mello2014: 78) on Italian parliamentary war powers, along with the topic’s intricacy, has obstructed a detailed analysis of Italian parliaments and military operations. A real turning point for the ways through which the Italian parliament ‘controls’ the executive on military missions occurred only in December 2016, when the first ‘legge quadro’ (comprehensive law) on military missions was finally adopted, after more than 25 years of military deployment.Footnote 3 The law openly explains the type of parliamentary oversight and the kinds of missions allowed (Ronzitti Reference Ronzitti2017).
Before this law, the procedures adopted were manifold and ambiguous. In the 1990s the debate was focused on the interpretation of the articles of the constitution pertaining to Italian involvement in ‘war’ and legislative–executive relations. The constitutional constraints were bypassed thanks to a specific interpretation adopted in 1990–1 (during the crisis in Iraq) that refused to give the designation ‘war’ to national military interventions of this type. Instead, they were cast as ‘police operations’ that ‘aimed at providing a contribution to multilateral institutions’, as stated in (the second part of) the widely quoted Article 11 of the constitution. Then, Law 25/1997 required parliamentary approval of the deliberations on security and defence issues assumed by the cabinet, but the types of such deliberations, as well as the nature of legislative approval, were not clearly defined, leaving the executive with the ability to again bypass parliamentary (ex ante) control.
Thus, to improve the clarity of the whole procedure, the ‘Ruffino Resolution’ (7-01007) was approved (with a broad and bipartisan consensus) in 2001, introducing the prassi (custom) of voting on the (re)financing of missions. Through law decrees the government informed (annually or every six months) parliament about operations abroad.Footnote 4 In practice, oversight remained limited because the decree did not allow for proper and detailed debates, with information on the financing, rules of engagement (RoE), tasks and caveats lacking. Thus, it was extremely complicated to vote against one mission, as it would stop funding for all the others. Consequently, parliamentary approval via legislation (to convert an initial executive decree) on a new mission often occurred after the launch of a mission.
In sum, until 2016 Italy could be coded as ‘without a prior veto’ for troop deployment. After the new law, the parliament has always debated and voted the Italian operations abroad.Footnote 5 As stated, the law defines in detail the types of missions allowed, introducing what seems an ex ante veto, affirming that ‘the Chambers authorize every year the international missions’.Footnote 6
Current research (Coticchia and Moro Reference Coticchia and Moro2017) is examining the consequences of the vague pre-2016 procedures (e.g. granting autonomy to the executive, avoiding audience costs and clear attribution of responsibility, thus fostering military activism). Yet, because of such complexity, almost none has collected data on voting patterns related to all Italian post-Cold War military operations.
Selected arguments and data collectionFootnote 7
In line with the above-mentioned literature on political parties and foreign and security policy, as well as the post-Cold War debate on Italian defence, we can emphasize five shared arguments that can be assessed in the case of Italy. As noted, the scholarly debate has focused on the consequences of different parliamentary oversight on defence and security policy, the relationship between partisanship and foreign policy, and the ways through which parties’ affiliation (government/opposition) affects foreign and defence policy. Moreover, the supposed Italian bipartisan consensus on military operations abroad and the domestic foundation of the Italian debate on foreign policy issues represent crucial perspectives in the current national literature. By examining voting patterns on Italian military operations with the first comprehensive data set collected, we evaluate for Italy the validity of the arguments deriving from such debate.
First, following scholars who have highlighted the vital role of ‘parliaments for the formulation and implementation of security policy’ (Mello and Peters Reference Mello and Peters2018: 3), one can suppose that the peculiar features of the law-making process influence the extent of parliamentary support for military operations abroad (MOAs). For instance, we can expect a different degree of backing according to the procedure adopted for the votes (e.g. refinancing, legislative decrees, etc.). Second, partisanship has been largely reported as a crucial variable affecting voting patterns in foreign and defence policy. Thus, in line with the findings of recent analyses concerning several European countries (Wagner et al. Reference Wagner, Herranz-Surrallés, Kaarbo and Ostermann2017), we can expect that the curvilinear model – rather than the traditional left–right (doves/hawks) dimension (Palmer et al. Reference Palmer, London and Regan2004) – would also predict well the Italian parties’ behaviour. Indeed, the pacifism of the far-left Italian parties (Coticchia and De Simone Reference Coticchia and De Simone2016), the widespread support by centre-left and centre-right coalitions for the post-Cold War Italian armed forces (Battistelli et al. Reference Battistelli, Galantino, Fay Lucianetti and Striuli2012) and the generally low saliency attributed to defence issues by Italian right-wing parties (Calossi and Coticchia Reference Calossi and Coticchia2009) seem to be ideal premises for supporting the curvilinear model.
Third, as widely reported by recent literature (Carati and Locatelli Reference Carati and Locatelli2017; Ignazi et al. Reference Ignazi, Giacomello and Coticchia2012), we would assume the existence of a large and cross-time bipartisan consensus on the deployment of Italian troops. The expectations regarding such consensus also resonate well with the recent literature that has illustrated how parties can collude to lessen debates on missions, avoiding accountability (Lagassè and Mello Reference Lagassè and Mello2018).
Fourth, in accordance with authors who have demonstrated how MPs’ voting on foreign and defence policy is deeply influenced by their affiliation with either the ruling majority or the opposition (Wagner et al. Reference Wagner, Herranz-Surrallés, Kaarbo and Ostermann2017), we would expect membership of government to have a significant impact on the voting patterns of Italian parties.
Finally, coming back to the Italian literature, and specifically those studies that have revealed how foreign and defence policy issues are closely related to the contingencies of domestic political debate (Carbone Reference Carbone2007), we can assume that ‘instrumental’ parliamentary dynamics (Calossi and Coticchia Reference Carbone2009) play a fundamental role. For instance, we can highlight cases of U-turn behaviour by opposition parties aiming to exploit the contradictions of majority coalitions by voting against a mission that has been previously supported.
As stated, to assess the above-mentioned arguments empirically, we built a completely original data set, consisting of 96 votes that took place in the Italian parliament on MOAs. Within this group of votes, 65 took place in the Camera dei Deputati (Chamber of Deputies) and 31 in the Senato (Senate).Footnote 8 In terms of those acts with legal force, law decrees constitute the vast majority of the observations (77), while there were 19 resolutions on the whole government’s foreign policy approach. In terms of distribution across time, votes varied between a minimum of one to a maximum of eight per year. Unsurprisingly, the peaks were in years in which major MOAs occurred, such as 1997 with the mission in Albania, 1999 with Kosovo, 2003 with Iraq and, finally, 2011 with Libya. Forty-one votes took place under a centre-left coalition and 47 under a centre-right majority. The remaining eight votes were during ‘technocratic governments’ or grand coalitions.
The number of votes taken into consideration depends on both our methodological approach and the inherent limitations of the data availability. We selected a time span extending from 1994 to 2016. On the one hand, we have examined the post ‘Second Republic’ context after the collapse of the previous party system based on the competition between the Christian Democrats and the Communists, the end of the bipolar era, and the emerging role of media tycoon Silvio Berlusconi and his Forza Italia (FI) movement (Bartolini et al. Reference Bartolini, Chiaramonte and D’Alimonte2004).Footnote 9 As political parties represent our unit of analysis, taking 1994 as a starting point allows us to limit as much as possible the variation in terms of label, number and ideology. Furthermore, the previously mentioned comprehensive law regarding parliamentary oversight on MOAs was ratified only in 2016. Thus, considering missions approved after this date could be problematic because the new law will probably transform the ways in which Italian parliament votes on troop deployment.
Within our observations, we focused on 27 ‘key votes’ on the most relevant military operations in which the country has taken part since the end of the Cold War.Footnote 10 The missions were selected, in line with existing literature on Italian defence (Coticchia and Moro Reference Coticchia and Moro2016; Ignazi et al. Reference Ignazi, Giacomello and Coticchia2012), according to the following criteria: number of troops deployed, resources committed, military contribution, duration and relevance (in terms of public debate, military transformation and multinational interoperability).Footnote 11 Specifically, we considered nine missions: Operation Alba (Albania, 1997), Allied Harbour (Kosovo, 1999), Enduring Freedom and ISAF (Afghanistan 2001–14), Antica Babilonia (Iraq, 2003–6), Leonte/UNIFIL (Lebanon, 2006–), Unified Protector (Libya, 2011), Prima Parthica (Iraq, 2014–) and EUNAVFOR Med (Mediterranean, 2015–).Footnote 12
Through our data set, we explored the behaviour of Italy’s ‘main political parties’, selected according to their electoral success, representation in parliament and presence in the governing coalitions. For the far left, we considered Rifondazione Comunista (RC, Communist Refoundation) and the Partito dei Comunisti Italiani (PdCI, Party of Italian Communists). For the socialist family, we analysed the pivotal Partito Democratico della Sinistra (PDS, Democratic Party of the Left) that changed its name in 1998 to Democratici di Sinistra and, in 2007, merged into the Partito Democratico (PD, Democratic Party). The Christian democrats are represented by the Partito Popolare Italiano (PPI, Italian People’s Party), which contributed in 2002 to create La Margherita (Daisy), and by the Centro Cristiano Democratico (CCD, Christian Democratic Centre) and Cristiani Democratici Uniti (CDU, United Christian Democrats), which merged in 2002 in the Unione di Centro (UDC, Union of the Centre). For the centre right, we have considered Forza Italia, which between 2009 and 2013 took the name Popolo delle Libertà (People of Freedom). The far right is represented by the Alleanza Nazionale (AN, National Alliance) and the Lega Nord (LN, Northern League).
Empirical analysis
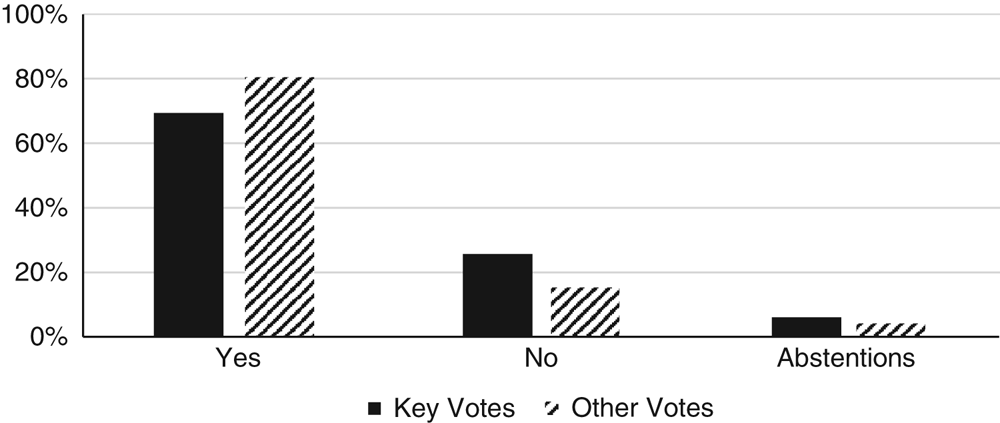
Overall, as illustrated by Figure 1, military operations received a remarkably high level of parliamentary support in Italy.Footnote 13 In fact, on average 80.1% of MPs backed the deployment of the Italian armed forces abroad, while only 15.24% opposed it and 4.56% abstained.
Parliamentary Support for Military Operations Abroad (1994–2016)

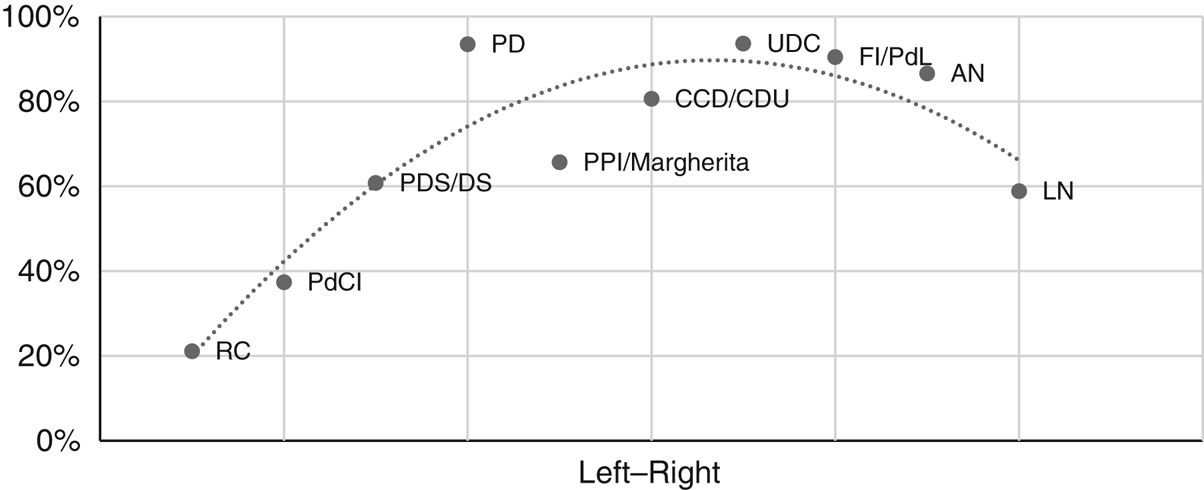
Among Italian political parties, parliamentary support for MOAs is lowest at the left, increasing towards the centre and slightly declining again to the right (Figure 2).Footnote 14
Average of Parties’ Parliamentary Support for MOAs (1994–2016) Note: Party positioning along the left–right dimension is based on established literature on the issue (Benoit and Laver Reference Benoit and Laver2006; Döring and Manow Reference Döring and Manow2018).

The two parties of the far left under consideration, RC and PdCI, display very low levels of backing, 21.13% and 37.41%, respectively. The difference between them originates in the fact that PdCI was formed – almost specifically – to support the centre-left coalition government in 1998. It is worth noting how the main Italian social democratic party has dramatically increased its support for participation in military intervention over time. In fact, while the PDS/DS scores 60.80%, its successor, the PD, reaches an astonishing 93.53%. All the Christian democratic parties evince strong support for military deployment: PPI/Margherita (65.5%), the CCD/CDU (80.60%) and UDC (93.65%). The lower level of average support from La Margherita is due to its partnership with DS in the centre-left coalition, both in the government and the opposition. FI/PdL was a loyal supporter of MOAs and registered 90.51% parliamentary backing. The far-right and post-fascist AN, which has always formed a government with FI, also shows high levels of support (86.58%). Despite also being part of the centre-right coalition, the regionalist and populist Lega Nord was less supportive of the use of force outside Italian borders (58.88%).
Analysing the category of ‘key votes’, we show that the average percentage of approval is slightly lower. In other words, ‘key votes’ were more contested. Indeed, in our restricted sample of 27 observations, we register 68.6% parliamentary support in comparison with the 80.21% of the remaining 69 votes. In contrast, the level of opposition is around 10% higher while abstentions instead present similar values (Figure 3).
Average of Parliamentary Support in Key Votes (1994–2016)

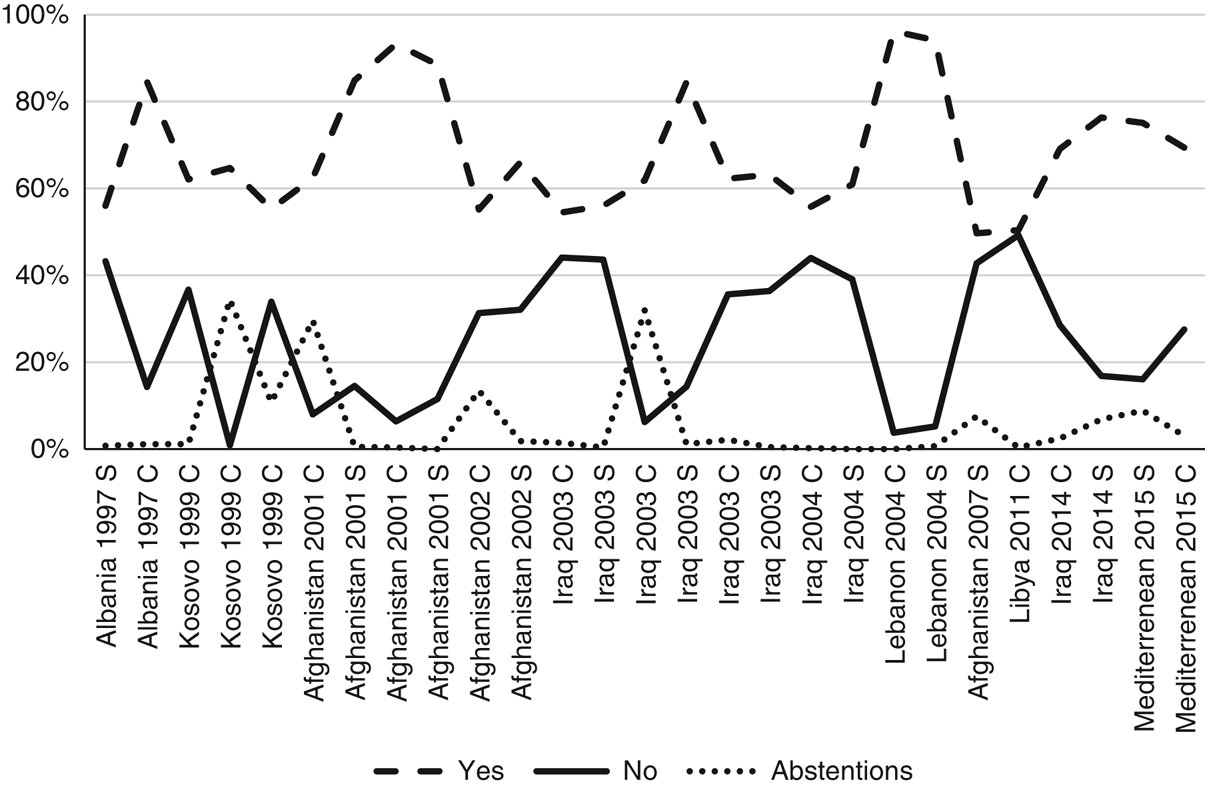
Therefore, the level of parliamentary support decreased in the votes on single and relevant MOAs, which have usually been approved through resolutions on government communications. Conversely, the degree of approval increased in the votes on the refinancing of multiple MOAs through decrees. By examining these votes in detail, we can report how in eight out of 27 cases the level of support falls below the threshold of 60% (Figure 4).
Parliamentary Support in Key Votes (1994–2016) Note: Country of mission, year, chamber, with C and S standing for Chamber of Deputies and Senate, respectively.

Most of the votes on Antica Babilonia (Iraq) and Unified Protector (Libya) were particularly contested. In the eight votes regarding involvement in the Iraq War, parliamentary support oscillated around 60%, while in the vote (in the Chamber of Deputies) on Italy’s contribution to the multilateral intervention in the Libyan civil war, the centre-right executive’s resolution passed with only a narrow margin of seven votes. However, centre-left governments also experienced high levels of parliamentary opposition on MOAs on the two missions in the Balkans: Alba and Allied Harbour. Support for the government’s initiative in Albania was only 56% in the Chamber of Deputies, while during three votes in the same chamber on the operation in Kosovo support never exceeded 65%. Furthermore, on 21 February 2007, Romano Prodi’s centre-left government failed to reach a majority for the renewal of the NATO-led ISAF mission in Afghanistan because of the cohesive opposition from the centre-right coalition and crucial defections among its own ranks. This constitutes the only circumstance in our data set in which a post-Cold War Italian government was defeated on a military operation abroad.
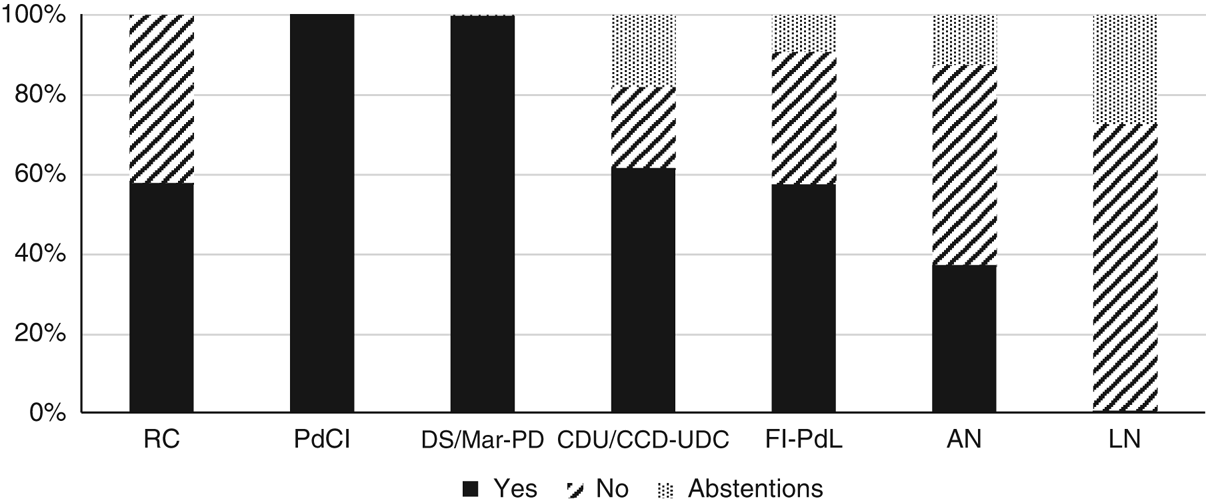
To highlight the dynamics of political competition within the parliament, we also investigated the level of support in key votes according to the ‘colour’ of the coalition in government. As reported in Figure 5, centre-left governments, composed of the DS and La Margherita (and later the PDFootnote 15), could sometimes rely on centrist (CCD/CDU and their successor UDC score a level of support beyond 50%) and even right-wing parties (FI/PdL and AN score an average of 57% and 37% of ‘yes’, respectively). Only LN starkly opposed the centre-left’s operations. It is also worth noting the different behaviour of the two extreme-left parties. While the ‘loyal’ PdCI voted yes in all the observations, the ‘rebel’ RC registered 57% support.
Average of Partisan Support in Key Votes (centre left in government) Note: The number of observations varies slightly across parties: RC (7), PdCI (6), DS-La Margherita/PD (12), CCD-CDU/UDC (8), FI-PdL (12), AN (8), LN (13).

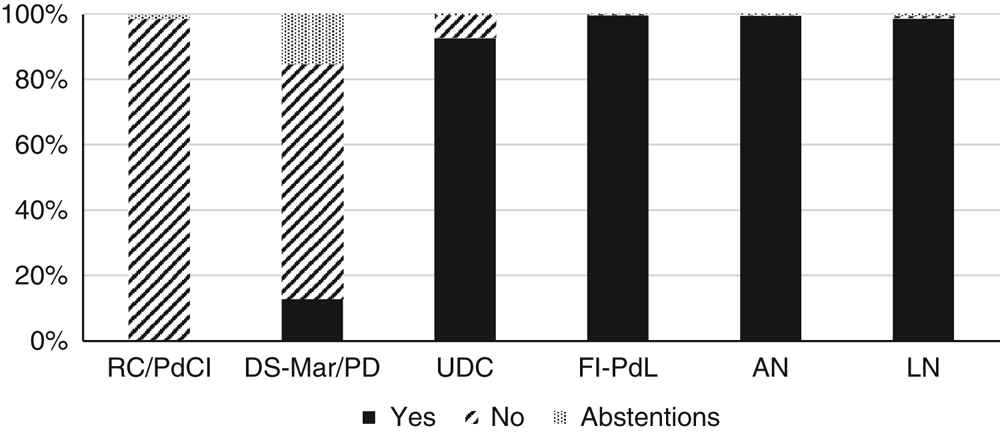
With the centre-right in government, the parliament is more clearly divided along partisan lines (Figure 6). On the one hand, the four parties usually composing the governing coalition provided strong and cohesive parliamentary support to the executive on military missions. In fact, FI, AN and LN presented almost total support for centre-right-sponsored MOAs, while UDC surpassed 90% support. On the other hand, the centre-left opposition vigorously opposed them. Specifically, the platform made up of the DS and La Margherita scored a limited 12.84% support and RC and PdCI together went further, with a null level of support.Footnote 16
Average of Partisan Support in Key Votes (centre right in government) Note: The number of observations varies slightly across parties: RC/PdCI (14), DS-La Margherita/PD (15), UDC (15), FI-PdL (15), AN (14), LN (15).

Findings and debate
Our collected data allow an assessment of the selected arguments developed in the literature on parties and foreign policy. Almost all the above-mentioned expectations on voting patterns have been corroborated by the empirical analysis in the case of Italy, albeit with partial but notable distinctions.
First, the procedural features seem to be relevant in affecting the behaviour of political parties towards the MOAs. In fact, we observed that the support for military operations declines by around 12 points between all the votes and our selected category of ‘key votes’. This gap, although small, may indicate that opposition parties, when confronted with a ‘package’ of several missions to refund, tend to vote in favour even though they are against one of them. This attitude has already been found in the literature on specific cases (Bono Reference Bono2005), but it has never been assessed with a larger sample. However, this figure might also suggest that parties are more prone to express their dissent in front of government representatives, a circumstance that generates more visibility and media coverage for the vote, fostering audience costs for the government (Coticchia and Moro Reference Coticchia and Moro2017).
Second, according to our findings, the curvilinear model of partisan support for military operations (Wagner et al. Reference Wagner, Herranz-Surrallés, Kaarbo and Ostermann2017) seems to better illustrate the case of Italy than the ‘traditional left–right’ model proposed by Glenn Palmer et al. (Reference Palmer, London and Regan2004). Indeed, the level of support for troop deployment is very low among far-left parties (PCI and RC); it increases for centre-left parties (DS-PDS) and reaches a peak among centrist and centre-right parties (PD, CCD/CDU–UDC and FI). However, differing slightly from the curvilinear model (Wagner et al. Reference Wagner, Herranz-Surrallés, Kaarbo and Ostermann2017), in the Italian case the level of support by far-right parties is controversial. In fact, AN supported all the military operations apart from the one in Kosovo.Footnote 17 This difference may be related to the nature of AN (Ignazi Reference Ignazi1994) and to the recent evolution of far-right parties in Europe (Mudde Reference Mudde2007). Indeed, AN was a ‘nationalist party’ that conceived the deployment of armed forces abroad as a symbol of national pride. To the contrary, nowadays far-right populist parties often take an isolationist stance on security and defence policy (Verbeek and Zaslove Reference Verbeek and Zaslove2015).
Third, the much-hypothesized bipartisan consensus on military operation abroad (Ignazi et al. Reference Ignazi, Giacomello and Coticchia2012) is confirmed by our data. In general, the extent of parliamentary support has been extremely high, suggesting an almost permanent agreement between the main parties of centre-left and centre-right. However, this figure was quite high in key votes too, entailing that bipartisanship characterized several military operations abroad. In particular, FI backed the centre-left coalition in the case of operations Alba, Leonte, Prima Parthica and EUNAVFOR Med.Footnote 18 On its part, the centre-left party supported Italian involvement in the international operation in Afghanistan after 2001.Footnote 19 As far as parliamentary votes are concerned, bipartisanship was instead (even if partially) broken on Kosovo, Iraq and Libya. In the case of operation Allied Harbour, FI supported Italian participation in the multilateral intervention during the debate but, by abstaining, signalled its opposition to the centre-left executive.Footnote 20 On Antica Babilonia, in a fundamental vote in the Chamber of Deputies, the centre-left abstained, sharing the humanitarian goal of the mission, but it voted against Berlusconi’s government in all the other debates.Footnote 21 Finally, notwithstanding its relevant support in the Defence Committee, PD abstained on the centre-right cabinet’s decision to become involved in Operation Unified Protector in Libya.Footnote 22
A possible way to better understand the reasons behind these cases of contestation could be to look at the nature of the missions and at the salience the parties attribute to the features of them. The aim of the operation, the types of troops and military assets deployed, the kind of activities undertaken on the ground (e.g. combat tasks, humanitarian rescue, peacekeeping, etc.), the number of casualties and ‘collateral damage’, and the presence of a multilateral framework (such as a United Nation Security Council (UNSC) resolution) could constitute crucial variables affecting parties’ behaviour. At first glance, the UN multilateral frameworks and non-combat operations especially seem to be correlated with a high level of parliamentary support. For instance, on the one hand, the ‘bipartisan operations’ in Albania and Lebanon both had the specific aim of providing stability in areas of conflict without combat activities on the ground and were authorized by UNSC resolutions. On the other hand, ‘politically contested’ military missions (e.g. Iraq) had a strong combat component while the multilateral framework was controversial.
Fourth, in line with existing literature (Wagner et al. Reference Wagner, Herranz-Surrallés, Kaarbo and Ostermann2017), the dynamics of government–opposition are very relevant. Indeed (as illustrated by Figures 5 and 6), the voting patterns change greatly according to the current position of the parties. Specific attention should be devoted to the parliamentary behaviour of far-right and far-left parties. In ‘key votes’, LN and RC radically decreased their level of support for MOAs as they moved from the government to the opposition. As long as RC guaranteed ‘external support’ to the first Prodi centre-left government, it agreed on several refinancing votes. However, after moving to the opposition because of the disagreement with the main coalition partners on economic issues, RC always voted against MOAs. Conversely, PdCI continued to back the government on military deployments. However, significant differences emerge in a broader comparison between LN and RC. In fact, while the former never really hijacked FI on MOAs, the latter was actually capable of defying the majority whip, as occurred in the vote on Operation Alba. On the whole, while RC moved from 57% support to nil, LN astonishingly shifted from large support to almost nil. While the party’s position in parliament (government/opposition) seems absolutely crucial in the voting patterns of LN, ideological attitudes clearly play a role for RC even when it has been a member of the ruling coalition. Indeed, contrary to LN, the overall level of support of RC towards the MOAs has never been particularly high.
Finally, in line with the argument of a supposed ‘instrumentality’ of voting on Italian foreign and defence policy (Calossi and Coticchia Reference Carbone2009; Carbone Reference Carbone2007), the findings illustrate how main opposition parties, despite an overall consensus on the missions expressed several times in the parliament, aimed to defeat the government before the assembly, exploiting divisions in the majority coalitions during ‘crucial votes’, when the government had a slim margin of support. In other words, on MOAs Italian parties have sometimes behaved as ‘office seekers’ rather than ‘policy seekers’ (Lagassè and Mello Reference Lagassè and Mello2018; Strøm Reference Strøm1990). For instance, in parliamentary debates FI consistently backed the Italian contribution to Allied Harbour in Kosovo in 1999. Nevertheless, when it came to debate the resolution by the majority coalition, they twice voted against it.Footnote 23 Moreover, this resonates with recent research (Oktay Reference Oktay2018) that has highlighted how weak executives can overcome parliamentary resistance against security policy, engaging in logrolling and offering side payments.
Conclusions
The article has sought to make a significant contribution to the current debate on parliamentary war powers by examining how Italian parties voted on military operations abroad in the post-Cold War era.
First, we have presented a detailed data set on Italian parliamentary votes on military operations abroad since the end of the Cold War. Despite the literature having started to investigate relations between Italian parties, parliaments and military missions, with these issues empirically addressed by several studies (Calossi and Coticchia Reference Carbone2009; Ignazi et al. 2009), a comprehensive data set on parties’ voting patterns was still missing.
Second, our empirical analysis has contributed to the growing theoretical debate on the relationship between partisanship, coalition politics, parliamentary oversight and foreign policy. Within such scholarly debate, we have devoted specific attention to the consequences of parliamentary oversight, the curvilinear model of the relationship between partisanship and foreign policy, the different votes expressed by government parties and opposition parties, the supposed Italian bipartisan consensus on military operations, and the domestic foundation of the Italian votes on defence issues. In detail, the expectations derived from the literature on the curvilinear model of parliamentary support for military operations on the left–right axis and ‘the bipartisanship defence policy hypotheses’ seem to be confirmed, albeit with a peculiar distinction regarding far-right parties. We have also found that the ‘instrumentality of the votes’ on foreign policy and the relationship between voting patterns and membership in majority coalition (despite the difference among extreme parties) are crucial to properly understand the case of Italy.
Recent changes in the law-making procedure, as well as the transforming structure of the Italian party system, may limit the validity of our findings to the time span selected. With the new law (n-145 2016), opposition parties are finally able to discriminate between the various (groups of) operations. Thus, we can expect that the number of total votes will significantly increase. On the other hand, the 2018 elections saw the rise to government of two populist parties – the Five Star Movement and Lega Nord – at the expense of the two main centre-left and centre-right parties (PD and FI) (see Chiaramonte and Emanuele Reference Chiaramonte and Emanuele2018). Thus, considering how convincingly centrist parties have supported military operations, further research should determine whether ideological preferences might prevail over the government–opposition dynamic.
Third, we have advanced some preliminary hypotheses that can be empirically investigated, paving the way for further research. Three main aspects deserve further study. First, the GAL–TAN cleavage (Hooghe et al. Reference Hooghe, Marks and Wilson2002) – rather than the traditional left–right axis – could be tested in the case of Italy, assessing the relevance of such dimension in defence policy. Second, the role of the financial crisis on parliamentary support for military operations abroad should be further explored. At first glance, we can already notice a decrease in the number of key votes since 2008, the year usually employed as a benchmark for the beginning of the crisis. This may suggest that Italian governments have become more reluctant to commit the country to costly and unpopular military operations abroad (Battistelli et al. Reference Battistelli, Galantino, Fay Lucianetti and Striuli2012). Finally, in line with the mounting scholarly attention on populist parties, further studies may systematically examine the voting patterns on MOAs of the Five Star Movement (Zulianello Reference Zulianello2018), comparing its parliamentary behaviour on this issue with other parties in Italy (e.g. with Lega Nord or Italia dei Valori) and in Europe (e.g. with Podemos in Spain).
Acknowledgements
The authors would like to thank G. Cama, W. Wagner, F. Ostermann, L. De Sio, E. Pizzimenti and all the participants of the Workshop ‘Political Parties and Foreign Policy’ (Genova, 2017), for their useful comments and suggestions.