1 Introduction
This paper re-visits the literature on the pension decision – that is, the decision by firms to offer a pension plan to its employees. In many countries, occupational pensions are being slated to play a more prominent role in the pattern of retirement provision, as demographics shift and governments seek to reduce public pension commitments. They are seen as a natural vehicle for income replacement, particularly for those above average earnings. The institutional framework for such pensions is legislated by the authorities, but in most countries the decision of whether to offer a pension is a private sector decision, often at firm level.
The expectation of a more pervasive role for occupational pensions in providing adequate financial support for retirees suggests that this question requires renewed attention. If heavy reliance is to be placed on occupational pensions as a source of retirement finance, then it is important that the determinants of this decision are well understood. In many countries, less than half the workforce is covered by an occupational pension, and, typically, only a minority of firms offer pension benefits.
This study exploits unique data on firms and workers in Norway in combination with actuarial calculations on pension costs and tax rules to explore this question. The study is confined to the private sector, since public employees are all covered by a public sector occupational pension. In the private sector, the firm decides whether to have an occupational pension. Administrative records with demographic information and employment history of all workers in Norway stretching back to 1992 are matched to a large and representative survey of firms undertaken in 2003. The reported pension status of the firm in 2003 is used in the econometric analysis. Because firm data are linked with the socioeconomic characteristics of employees, we are able to calculate for each employee the direct cost to the employer of a pension plan, by applying the actuarial procedures which are actually used for assessing pension liabilities, to observed age and earnings. In a second step, we apply detailed tax rules to calculate the potential tax gain from an occupational pension contribution compared to the same amount from the firm in the form of a proportional wage increase. Because of the tax rules and the rules for accrual in the National Insurance System (NIS), there may be a net gain at the individual as well as the firm level. The average gain at firm level will vary with the age and wage distribution of the firm's employees. This is a novel feature of our analysis – no previous study has provided detailed calculations of joint tax savings at the firm level in trying to explain the decision to offer an occupational pension.
Most literature related to the firm's pension decision is US based. It focuses on two possibilities. First, tax deductibility of pension accumulation may make compensation in the form of pension contribution more cost-effective than direct wage payment. The attractiveness of pension contribution compensation is discussed by, for example, Gustman et al. (Reference Gustman, Mitchell and Steinmeier1994), who identify both worker-side and firm-side motivations.
Second, back loading labour compensation may generate a more stable and productive workforce. Evidence on the relationship between turnover or tenure and occupational pensions is found in several studies. Gustman and Steinmeier (Reference Gustman and Steinmeier1993) found that workers are three times more likely leave jobs that do not provide pension coverage than from jobs that do provide coverage. Gustman et al. (Reference Gustman, Mitchell and Steinmeier1994) note: ‘worker turnover is only about half as high for workers covered by pension plans as for workers without pensions’. The occurrence of a plan appears to be the important thing. Further evidence comes from Ippolito (Reference Ippolito1991) who found that pensions increase tenure in a firm, on average by 20%. Later, Ippolito (Reference Ippolito1997) advances the hypothesis that firms match employee contributions in 401(k) plans (in our case offer an occupational pension) to attract ‘stayers’. Even and Macpherson (Reference Even and Macpherson1996) found pension coverage reduced labour turnover, more so in large firms.
Direct evidence on productivity effects, however, is harder to find. However, a study by Decressin et al. (Reference Decressin, Lane, McCue and Stinson2005) finds a positive effect on productivity of offering benefits (often a pension plan).
Outside the US, there is limited research. Horiba and Yoshida (Reference Horiba and Yoshida2002) followed 488 Japanese firms listed on stock exchanges between 1980 and 1990. They found that firms' introduction of an occupational plan was voluntaryFootnote 1 and seemed to be motivated by economic incentives and influenced by union attitudes. Support for the role of economic incentives can also be found in the case of New Zealand, where tax concessions to occupational superannuation were largely abolished in the late 1980s, and occupational pension coverage fell from 22.6% in 1990 to 14.9% in 2000 (New Zealand Government, 2001). Dummann (Reference Dummann2008) finds longer tenure among employees covered by an occupational pension in Germany, and also a higher probability of being covered in large firms, as well as differences between industries.
Analysis of our data suggests that several stylized facts about occupational pensions in the US are replicated in Norway. Occupational pension plans are more frequently offered in firms that are large and whose workers require long training, and are facilitated by the degree of unionization and by local and individual wage negotiations. The tax gains from a pension plan appear to have a significant and strong positive effect on the probability that a firm will have an occupational pension. We also find, like Ippolito (Reference Ippolito1991), that tenure is significantly longer in firms with an occupational pension. Econometric analysis suggests that this is one of the motivating factors for a firm to have an occupational pension.
The next section gives a brief overview of the pension and retirement landscape in Norway, followed by a third section which describes the data. The framework for analyzing the decision by a firm of whether to have an occupational pension are set out in Sections 4 and 5. Section 4 derives the tax gain and Section 5 models the impact on average tenure. Section 6 describes the model for the firms' choice, Section 7 describes the estimation results, and the last section concludes.
2 Norway's pension landscape
Social security
The backbone of Norway's retirement provision system is a pay-as-you-go unfunded defined benefit (DB) plan, the National Insurance System (NIS), available from age 67. The system is organized around a value termed the ‘basic amount’ (G), which is adjusted annually by the government in line with the wage growth. In 2003, the main data year, it was 55,694 NOK.Footnote 2 Old age NIS pension consists of a basic pension (1 G) and an earnings related pension. The earnings related pension is based on the average of the 20 years with highest earnings, with benefits currently set at 42% of earnings between 1 and 6 G and 14% of earnings between 6 and 12 G. The minimum level was 1.8 G for single persons in 2003. The NIS is therefore very progressive and redistributive. In 2003, the minimum level was 30% and the maximum level 65% of average full-time earnings. The NIS is not tested against the occupational pensions described below.Footnote 3
The public sector has its own pension system, fully integrated with the NIS, so that the two combined give a pension which is 66% of the final salary, indexed to the G.
Occupational pensions in the private sector
In the private sector, firm-based occupational pensions are widespread as a supplement to the NIS. In 2001, 85% of recent retirees received an occupational pension, adding an average of about 30% to their NIS pension.
The firm decides whether to have an occupational pension, the replacement rate, and which benefits to include. In addition to the old-age pension, these programs usually include disability insurance and survivor benefits, which then constitute between 30% and 40% of total cost. Until 2001, only contributions to occupational pensions of the DB type, and that also complied with specifications in the legislation on these pensions described below, qualified as a tax deductible cost. As a consequence, almost all pensions were of this type. This is further substantiated by data from the insurance companies, which show that 97% of total contributions in 2003 were to DB plans (Finansnæringens hovedorganisasjon, 2004).
Occupational pensions are designed to supplement the NIS pension and target a (total) replacement rate defined as the sum of the pre-tax stipulated NISFootnote 4 and the occupational pension divided by the final salary. The replacement rate cannot exceed 70% or increase with earnings of employees within the firm. In practice, it is the same for all employees of a firm and the predominant replacement rate is 66% (Pedersen, Reference Pedersen2000). Since the NIS is fairly flat, the occupational pension regulations imply that an occupational pension reverses the redistribution inherent in the NIS pension, and that the direct cost to the firm of an occupational pension rises with the wage level, not only in absolute but also in relative terms. This within-firm redistribution from low to high wage earners follows from the regulations required for tax deduction. If the firm wants the tax deduction, the choices are limited to whether to have an occupational pension, the replacement rate, and whether to include disability and survivor benefits. During our observation period, regulations also required that all employees who were working at least half normal time and for at least one year should be covered.
DB pension rules imply that there is a loss of pension entitlement associated with a job change. This portability loss arises partly because of vesting (which was one year), but mainly because of the inadequate indexing of the deferred pension a departing worker with more than one year of tenure receives on separation from the firm.
Occupational pension assets must be separated from the legal entity of the company, either in a pension fund or by a contract with an insurance firm. In either case, the cost to the company is calculated annually as the difference between the present values of projected liabilities and accumulated assets. Aggregate annual contributions to the pension fund or insurance company aim at balancing the two, and the firm cannot deliberately give contributions that are too small. Underfunding may occur, for instance due to a change in parameters, such as the discount rate used for liabilities, but this has to be covered – although firms are allowed to smooth for up to 20 years. Hence, the issue of choosing funding level discussed by Love et al. (Reference Love, Smith and Wilcox2007) does not arise here.
Some firms deduct part of the cost from the wages of the employees, often mimicking the public sector by deducting 2%. In all cases, the firms are responsible for the total contribution and any deductions from the wages of the employees only cover a small fraction of the cost. For firms, contributions are taxed like wages, deductible as a cost of earning income. For employees, pensions are taxed under an EET paradigm (contributions and fund earnings are tax exempt and benefits are taxed under the income tax when they are received).Footnote 5Hernæs and Zhang (Reference Hernæs and Zhang2006) lay out the legal framework in detail, and also describe how we have calculated pension costs to the firm for all employees.
3 Data sources
Administrative register data
Register data received from Statistics Norway are administrative records collected for statistical and research purposes. A unique personal identification number for each resident in Norway allows linking over time and across registers. The data give information on gender, age, marital status, education, spells of work, employer, spells of unemployment, spells of sickness, spells of disability, retirement, and income from work and social benefits. The data also give links between spouses. The register data used in this study cover the period 1992–2002, and include all employed workers in Norway. They provide a uniquely rich data set of labour force characteristics and behaviour; see Hernæs and Zhang (Reference Hernæs and Zhang2006) .
Firm survey data
In 2003, Statistics Norway conducted a survey (hereafter denoted ABU) of 2,358 firms with about 383,000 employees in the public and private sectors in Norway. The sample was drawn from the population of firms with more than ten employees, a total of 38,878 firms with 1,658,038 employees, covering around two-thirds of the labour force. An array of questions was answered by the manager of each firm, of which we use answers on pension plan, training, and unionization and wage negotiations. Data on employees from the register data described above were linked to the survey, creating a very rich data set on workplaces and employees. Among the 1,350 private sector firms, we used 494 firms which reported to have a DB pension plan and 446 firms which reported not to have any pension plan, with a total of 119,000 employees. Four hundred and nine firms reporting a defined contribution (DC) pension plan were omitted from the analysis, since DC was legislated only from 2001 and we believe these firms either misunderstood the question or operated a DC plan for a minority of employees. Data from the insurance companies show that 97% of total contributions in 2003 were to DB plans.Footnote 6 We were also informed by actuaries who were working with firms to assess pension obligations, that managers were generally not well informed about types of pensions and terminology. In particular, some would misinterpret defined contribution as a newly introduced contribution schedule for DB plans. However, we feel fairly confident that they know whether the firm has an occupational pension and, if so, that it is a DB plan, so that firms included in our analysis are classified correctly. It should be noted that all the data on costs and wages are from administrative registers, which are quite accurate on these variables.
Actuarial procedures
For all employees of the firms in the survey, we know their age, their annual earnings, and their NIS entitlements. Assuming that all employees have tenure from an early age, we have the basis for calculating entitlements and liabilities. This is done by using the standard assumption on growth of wages and the value G in the NIS, the discount rate, and pension indexation. The calculations have been done by actuaries, using the standard formulas for all employees of the firms in the survey. As cost to the firm, we use the increase in the present value of the entitlements. Further details can be found in Hernæs and Zhang (Reference Hernæs and Zhang2006) .
4 Tax gains from an occupational pension versus higher wages
The data set just described provides the basis for a detailed comparison of two alternative types of employee compensation. One alternative is an occupational pension, of DB type such as described in Section 2. We assume that the pension plan has a replacement rate of 66% and includes disability and survivor benefits. The other alternative is a wage increase, where the cost to the firm of the pension instead is given as a proportional wage increase to all employees of the firm. The cost to the firm is the same in the two alternatives. We then apply current tax rules and calculate net present values of the alternatives for each individual, using observed age and wage in 2003. We call the difference a tax gain and calculate the average tax gain over employees for each firm. For most firms, the average tax gain is positive, but it varies and can even be negative for some firms. The method and empirical results are described in the following. A more detailed description is given by Hernæs and Zhang (Reference Hernæs and Zhang2006) .
The idea is the same as in Poterba (Reference Poterba2004), to compare wealth that accumulates without tax on interest but is taxed on withdrawal with wealth saved from post-tax earnings where the interest is taxed but withdrawal is not. We apply this idea to pension accumulation and improve it in two important ways. First, using the linked data on employees and firms, we use the same actuarial formulas as the firms, and obtain the exact contribution required by a 66% occupational pension for each employee. Secondly, we apply actual tax rates for the income bracket of each employee, both on pension (tax-free accumulation, tax on withdrawal) and on an alternative wage increase saved until retirement (tax on receipt of wages and on interest which accrues on savings, no tax on ‘withdrawal’). Our results are therefore close to the actual gains.
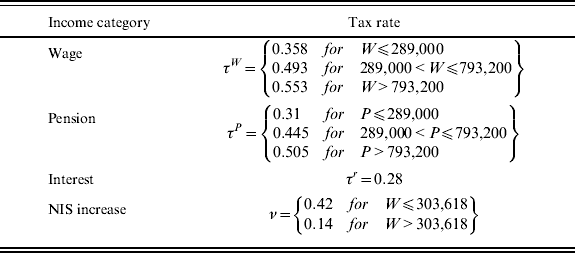
For all present value calculations, the real rate of return and the discount rate are both equal to 4%. The tax rates are shown in Table 1. Marginal tax rates are used because the alternative compensations are both in marginal terms.
Marginal tax rates on income between tax brackets in 2001

The gain, G ia, for employee i aged a is the following difference, in which the components are explained in detail below:


where C i is the pension contribution for the individual; W i is the individual (alternative) cash wage increase; τiP is the tax on pension and τiW the tax on earnings, both individual specific because of the progressive tax; τr is the flat tax on interest on savings; r is the interest and discount rate, R–a is the remaining expected period of future work; D is the expected time of death; N is total number of workers in the firm; νi is the individual specific NIS pension accrual.
The present value of the pension alternative is the first of the three terms on the right-hand side of equation (1) and has been calculated from the contributions by the firm to the pension fund, as the annual increase in the present value of entitlements (SCC), which by definition are the present value of the future pension.Footnote 7 These contributions have been calculated for all individuals by actuaries with the procedures used to assess obligations for firms for the annual balance sheet. Hence, we do not use expected pensions stream after retirement, but the equivalent contribution stream up to retirement. We do then use the tax rate in the bracket that will apply to the pension when it is received.
The second term on the right-hand side of equation (1) is the alternative wage increase. As can be seen from the formulae, aggregate cost for all employees in the firm have been converted into proportional wage increases up to retirement, taxed in the relevant tax bracket, and converted into a present value.
The third term on the right-hand side of equation (1) is the increased NIS pension that will follow from a wage increase.Footnote 8 The formulae is somewhat simplified since it is assumed that the increase applies to the 20 best years (see Section 2). This extra pension is calculated after retirement up to expected time of death and converted into a present value. Longevity is set at 76 for men and 81 women, based on life tables for the expected remaining life time. In case of death, there will be a bequest from the wage increase and survivor benefit from an occupational pension, respectively.
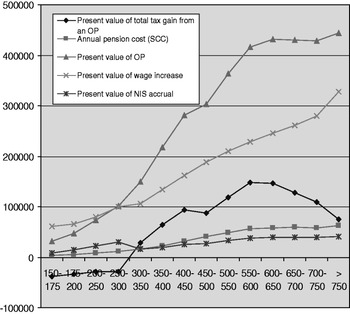
Figure 1 shows the components of the tax gain in equation (1), calculated for the whole sample and averaged over individuals by wage groups. Except for the ‘Annual pension cost (SCC)’, these are all in present values. The calculations are based on the actual wage and age composition in the sample.
Direct annual cost of an occupational pension and present values of total tax gain and its components in equation (1). Average over individuals by wage bracket

The firm's contribution required to cover their pension entitlements (SCC) increases with earnings because entitlements are calculated to cancel out the flatness of the NIS. This is particularly important above a wage level of 6 G (about 325,000 NOK in 2001), where NIS accrual falls from 42% to 14%. The gap filled by a 66% occupational pension therefore increases from 24% (66% minus 42%) to 52% (66% minus 14%) of the wage. The graph shows the total contribution and not the marginal, so there is no spike. There is a kink, which is somewhat smoothed out because of the actual age distributions in the wage brackets. After 12 G (around 650,000 NOK), earnings give no pension accrual and the curve generally flattens (age distributions still give some variation).
The ‘Present value of the occupational pension’, which is the first term on the right-hand side of equation (1), increases mores sharply after the 6 G wage level and flattens after the 12 G level. The kink around the 450,000–500,000 NOK bracket is caused by the increase in marginal tax on pensions accruing at this wage level, from 31% to 44.5%.
The second component on the right-hand side of equation (1) ‘Present value of wage increase’ increases with earnings, but somewhat irregularly because of the age distributions in various wage brackets. This wage increase also drives the ‘Present value of NIS accrual’, which is the third term on the right-hand side of equation (1).
The resulting ‘Present value of total gain from an occupational pension’ (the left-hand side of equation (1)), therefore increases rather irregularly with wage, which is useful in the econometric analysis. The break-even for an individual between a wage increase and a pension is approximately at the wage level of an average full-time earner. Those with lower wage will benefit from a wage increase rather than the contribution to a pension.
The results in Figure 1 are driven both by pension rules and by the progressive tax structure shown in Table 1. This usually implies substantial tax savings from introducing an occupational pension, since the wage will generally be taxed in a higher tax bracket than the corresponding pension. For example, with 66% replacement and wage of 300,000 NOK, the pension will be 198,000 NOK. In 2001, the marginal tax on an occupational pension at this level was 31%, whereas the marginal tax on wage at the corresponding level was 49.3%. In addition, interest on savings (we compare a future pension and a wage increase saved until retirement) will be taxed at 28%.
At the firm level, this usually gives a positive gain. However, a sufficiently skewed wage distribution may give a net loss. High earners need a lot of benefit (and thereby contribution) to reach 66% in total pension replacement from a fairly flat NIS. Their marginal tax is high, both on earnings and on the pension. If this pension is financed largely by low wage earners (if they are the majority), the tax saved on their earnings are much less. Hence, there may be a tax loss from introducing an occupational pension, even if there is positive gain in the majority of firms.
5 The impact on tenure in the firm of an occupational pension
The portability loss inherent in the DB pensions in operation during the observation period creates a lock-in effect that can be used by the firm to retain workers with non-firm specific capital and reduce turnover (Even and Macpherson, Reference Even and Macpherson1996; Ippolito, Reference Ippolito1991). It may also attract more ‘stable’ workers. Stability may be unobserved or it may be reflected in observable characteristics of the workforce, such as the level of education. This may reduce training costs and increase human capital and productivity in the firm. Dorsey (Reference Dorsey1995) and Mitchell (Reference Mitchell and Dionne2000) provide reviews of the literature.
Although some employees may not prefer an occupational pension, because of variation in preferences and because the pension contribution and wage moderation may have different profiles, we expect that average tenure among employees in a firm increases with an occupational pension in the firm. Furthermore, tenure is obviously influenced by many other factors, and there may also be interaction between the occurrence of an occupational pension and other variables. Therefore, we estimate separate hazard equations for tenure with a set of controls for firms with and without occupational pension. We then use the two estimated equations to predict expected tenure with and without an occupational pension for all firms. The interpretation is that an occupational pension in a non-occupational pension firm will influence tenure of all groups of employees by changing their hazard rate coefficients to those of occupational pension firms. Similarly, non-occurrence of an occupational pension in an occupational pension firm is assumed to change the hazard rate coefficients to those of non-occupational pension firms. The difference, measured as an average over all employees and denoted tenure gain, is interpreted as the impact of an occupational pension on tenure and is entered into the logit equation of the firm's choice of an occupational pension.
It should be noted that we do not correct for selection by workers into occupational pension and non-occupational pension firms, since this is precisely what we want to capture. If an occupational pension attracts personnel who stay longer but affects all in the same way, the constant terms will be different in the two regressions. If an occupational pension affects the behaviour of employees, e.g. by education differently, the estimated coefficients will be different. Our hypothesis is that both effects are possible and may reflect the impact of an occupational pension. What we do not take into account, is an impact on the work force composition, e.g. by education. We assume work force composition in the firm to be influenced by other characteristics of the firm, such as industry, and assume it to be independent of occupational pension.
The following proportional hazard rate model for tenure is therefore estimated separately for firms with and without an occupational pension. For each firm, we have used data on all employees who started in the firm after January 1978, including those who had left the firm before our observation date, December 2001. The choice of a Weibull baseline allows the probability of a worker of leaving the firm to be monotonically increasing or decreasing in the duration at the job (tenure).

in which:
AGE ijk is the age group (see Table 2)
MALE ij is a dummy for male
EDUC ij is the education group (see Table 2)
IMMIGRANTS ij are the dummies for immigrant status.
INDUSTRIES ij are the industry dummies
k=1, 0 denotes firms with and without an occupational pension, i denotes employee, and j denotes firm.
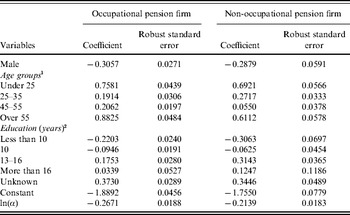
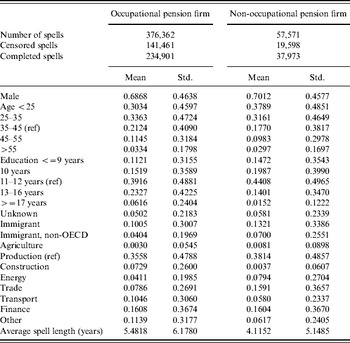
Estimates of coefficients of the hazard rate of employees of separating from the firm (equation (2))

Notes: 1 Reference group is age 35–45. 2 Reference group 11–12 years of education.
Controls for immigrant status and industry are included, but not shown.
Using the two sets of parameter estimates, we predict expected tenure for each individual both with and without occupational pension. For each firm, we then calculate the average of expected individual tenures with occupational pension (TE  URE j1) and without an occupational pension (TE URE j0), and interpret the difference as the gain (realized or potential of having an occupational pension):

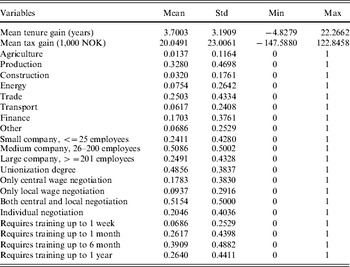
Summary statistics are given in the Appendix.
6 The firms choice of an occupational pension
Given the legislated requirements for tax deductibility, the question for the firm is whether to provide a pension for practically all its employees, with the same benefits and the same replacement rate as a percentage of final salary. For the present analysis, we assume the replacement rate is 66%, with disability and survivor benefits included. This decision will be made under a variety of considerations among which the most important in this analysis are the impact on tenure and the average tax gain. Both of these have been discussed and constructed in the preceding sections.
In the analysis, we view the tax gain as a benefit that can be shared between the employer and the employees. If the tax gain spills over in wage moderations, some or all of the pension cost to the firmFootnote 9 may be cancelled. This wage–pension offset is not easily identified. A cross-section regression based on 2001 data from the same data sources as are used here, of wage on pension and a large set of controls, gives a large positive coefficient for pension, as is also found in much of the literature. This indicates that if there is a trade off, it is masked by unobserved heterogeneity and/or an endogeneity bias, since a pension may attract employees who will have high total compensation. If productivity is imperfectly observed, it becomes very difficult to identify the trade off. By comparing groups of municipal employees, Ehrenberg (Reference Ehrenberg1980) finds a (partly) compensating wage effect from lower employer contributions to the pension, but with a fairly limited data set. A study by Gunderson et al. (Reference Gunderson, Hyatt and Pesando1992), based on firm data with linked collective agreements and pension plans, find indications of a trade off between pension and wage, but the results are generally not very strong and sensitive to specifications. Andrietti and Patacchino (Reference Andrietti and Patacchini2004) find a positive substitution by instrumenting the pension, but lack information on type and generosity of the pensions. For these reasons, we do not model sharing of the tax gain, but view the tax gain as a joint motivation for firm and employees and enter an average tax gain into the choice equation as an attribute of an occupational pension. The tax gain was calculated in Section 3.
For employees, an occupational pension may be attractive as an efficient way of saving for retirement, since the firm may have large-scale efficiency in setting up pension arrangements. However, there might also be less attractive features of a pension, such as tying down capital and reducing flexibility in other investments, such as housing. Therefore, not all firms may choose to operate a pension. In the choice model, we enter the predicted increase in average tenure the firm expects from the operation of an occupational pension. The tenure gain prediction was described Section 4.
Whether the firm chooses to operate an occupational pension will depend also on several other factors. The extent to which the direct cost of an occupational pension is offset by a lower wage level depends on how wages are determined. If a company views an occupational pension as a way of reducing wage claims, this is more easily implemented, the more firm based is the wage setting. In addition, the presence of a union might be an accommodating factor, serving as a communication channel between firm and employees (Freeman, Reference Freeman1981). Internal cost for the firm from an occupational pension may have a fixed component, so that it will be less costly for a large firm. Reduced turnover is more valuable, the more training is usually required by new entrants.
The estimation implicitly assumes that benefits and costs for a company in the year observed were the same when the decision on occupational pension was taken, and that it was then assumed by the company to continue into the future. The firm survey covers only 2003 and we estimate the model for that year. We do not have extensive firm information from earlier years. However, from the registers we can to a certain extent identify firms and employees prior to 2003, and obtain information on previous age and wage structure, which we take to be among the important factors for the firms in choosing an occupational pension. We went back to 1996, which is the first year after a major change in the construction of the firm registers. Due to mergers and other events, which alter the organizational numbers, we were able to identify about half of the firms with an occupational pension in 2003 and one-third of firms without. In 2003, the median wage in firms without an occupational pension was 79% of median wage in firms with an occupational pension. Also, median age in non-occupational pension firms was lower in 2003 – 88% of occupational pension firms. Among those firms we could also identify in 1996, the corresponding numbers in 1996 were 85% and 95%, respectively. This is an indication that the differences between firms with and firms without an occupational pension in 2003 were largely present also in 1996.
The model we estimate for the firm's pension status in 2003 is the following.
Let y jp be the profit increment (unobserved) in firm j related to offering an occupational pension plan p, corresponding to p={0, 1}; let v jp be the deterministic part and εjp the random part. The latter captures unobserved factors affecting increments in profit.
Firm j selects a pension plan p that maximizes:

With the error terms εij extreme value distributed of type I and v ij uncorrelated with εij, we obtain the probability of firm j choosing an occupational pension. Since we have only two alternatives, we can drop the subscript denoting alternative in the choice expression so that v j=v j1–v j0:

Here, the structural part v j is

in which:
TENUREGAIN j is the average expected firm-specific tenure over employees of firm j up to year 2001 given pension plan p above the average expected tenure without an occupational pension. It is estimated on employment register data for each employee reporting starting year in the firm, see Section 5.
TAXGAIN j is the sum of tax gains in present values, for all employees in firm j given pension plan p, compared to a wage increase equivalent to the firm, as described above, but no pension plan. This tax gain is calculated for each employee and averaged across employees for each firm. It will vary across firms for the same alternative, due to cross firm variation in the wage and age structure across firms, see Section 4.
FIRMSIZE j is the number of employees in firm j, grouped as follows: small (−25), medium (26–200, reference group), and large (201+). For a large firm, monitoring costs may be higher and the advantages of a deferred payment larger.
UNION j is the fraction of employees in firm j who are members of a union.
NEGOTIATIONS j – is for firm negotiations in the annual wage settlements: only individual (reference group), only central, only local, or both central and local negotiations in firm j.
TRAINING j is the reported required training period for a new employee of the main occupational group in firm j, with alternatives up to one week (reference), up to one month, up to six months, and more than six months. We expect the longer the training period, the higher is the training cost of recruitment and the more willing is the firm to offer an occupational pension, which is expected to increase the length of the relationship between the employee and the firm.
INDUSTRY j is a vector of dummy variables for industry at one-digit level.
7 Estimation results
Tenure
We first estimate the proportional hazard rate models of firm tenure for all employees in the surveyed firms (ABU) using equations (2), separately for firms with and without an occupational pension. The results are shown in Table 2, with age, gender, education, immigrant status, and industries as controls. The results show that male workers have a lower probability of leaving the firm than female workers. Younger people have a higher transition probability than older workers, except senior workers who have a higher probability of leaving the firm, presumably to exit to retirement or out of the labour force. Age is measured at the start in the firm. Workers with higher education attainment have higher probability of leaving. This holds for both occupational pension companies and non-occupational pension companies. The estimates of the Weibull shape parameter ln(α) are negative both for companies with and without occupational pension ceteris paribus, which implies decreasing baseline hazards. This can be an indication that both employers and employees invest in the work relationship, such that it imposes increasing costs over time of transitions to new jobs.
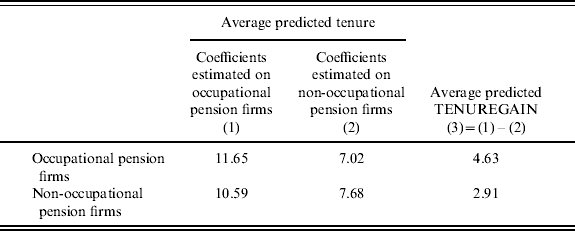
The potential impact on average tenure in the firms of having an occupational pension is illustrated by the predictions in Table 3. Column (1) shows the result of predicting with the hazard rate regressions estimated on occupational pension firms and column (2) the result of predicting with the hazard rate regression estimated on non-occupational pension firms. The number 7.02 can be interpreted as the predicted average tenure in occupational pension firms had they not had an occupational pension and 10.59 as the predicted average tenure in the non-occupational pension firms had they had an occupational pension. Both are counterfactual, and used to predict the increase in average tenure for the two groups of firms. These are shown in column (3).
Predicted expected tenure in years

We note that in line with the results of Ippolito (Reference Ippolito1991), the occurrence of occupational pension increases tenure substantially, although the magnitudes are not directly comparable. Whereas Ippolito uses observed tenure at the time of observation, we use both current and previous spells of employment in the firm to obtain hazard rates (‘quit intensities’). These hazard rates are used to calculate average expected tenure in each firm given their actual work force. We believe that this is a better measure of work force stability than observed tenure at a point in time, since it takes into account the composition of the labour force and models the underlying quit structure. We further assume that calculation of this measure of expected tenure with and without an occupational pension, and the ensuing hypothetical gain in expected tenure, is a relevant measure of what might motivate firms.
We also note from Table 3 that the expected tenure gain is substantially larger among firms with a pension plan. The number 4.63 can be interpreted as the gain in average labour force tenure realized by the firms that actually have an occupational pension. The number 2.91 is the potential gain in average labour force tenure that could have been realized by the firms that do not have an occupational pension, had they chosen to have one.
The predictions thus indicate that those firms with the most to gain were those that chose to have an occupational pension. These numbers are averages and without controls for other factors. The econometric analysis will follow up on this. As will be seen below, this causes the coefficient on TENUREGAIN to be significant in the firms' choice equation.
The firms' choice of an occupational pension
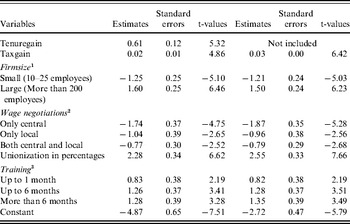
The estimates of the coefficients in the logit equation on the firm's choice of occupational pension are reported in Table 4.
Estimates of the firms' probability of offering an occupational pension observed in 2003 (equation (5))

Notes: 1 Reference group is mid-size: 25–200 employees. 2 Reference group is only individual wage negotiations. 3 Reference group is 1 week or less. Industry dummies are included, but not shown.
Since the estimates of the coefficients in the duration model in Section 5 and therefore the prediction of tenure gain are assumed to depend on the presence of an occupational pension in the firm, and the decision by the firm depends on the impact on tenure, an endogeneity problem may arise when the logit probability is estimated with tenure gain as one covariate. However, the effect on an occupational pension happens over a period, so that the worker's employment decisions and the average tenure of a firm's work force will change gradually after the introduction of an occupational pension. Secondly, the tenure equation has been estimated and predictions have been made at the individual level, whereas the occupational pension choice equation is at firm level. It is not obvious that the variation in individual observations (say residuals) is informative for variation in firm expectation. Thirdly, some of the firm variation, which predicted values lack, will cancel out since we use the difference in the expected tenure. A simple Monte Carlo simulation, adding an error term to the predicted values of the tenure gain for each firm and re-estimating the choice model, suggests that our use of predicted values may have given biased estimates and too large standard errors. It is, however, very difficult to assess the potential error.
As an additional exercise, we have also estimated the logit probability in (5) without TENUREGAIN j. The estimates from the two regressions are very similar, which indicates that there is no important endogeneity problem from firms' choice of occupational pension to influence work force stability and employees' choice of firms with an occupational pension. Hence, our results appear robust to tenure specification, although this has not been tested formally.
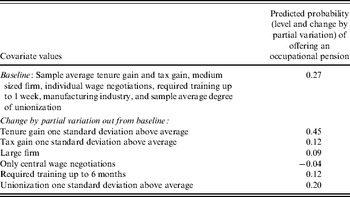
In Table 5, we illustrate the magnitude of the effects by calculating how much the probability of having an occupational pension varies when we vary (in turn) the values of covariates out from a baseline. We observe from Tables 4 and 5 a number of significant and strong determinants of firms offering an occupational pension.
Predicted probabilities of the firm offering an occupational pension

The potential gain in expected tenure, interpreted as an indicator of increased work force stability, comes out as significant and very strong. One standard deviation higher expected tenure increases the probability of an occupational pension by 45 percentage points, evaluated from the baseline case with an initial probability of 27% (Table 5). Hence, we conclude that firms use an occupational pension to increase work force stability. The average tax gain also has a strong effect on the firm's probability of offering an occupational pension. One standard deviation increase in the gain will increase the probability by 12 percentage points (Table 5). The impact of the tax gain can also be illustrated by the aggregate elasticity of the occupational pension choice probability of the firms with respect to the gain:  , where
 is the predicted probability for occupational pension, which follows from the estimates given in Table 4,
 is the estimated coefficient, and Z j is the gain covariate. The elasticity varies across firms. The mean in the population of these firm-specific elasticities is 0.16 and the standard deviation is 0.29. Thus, there is a large variation across firms.
The effect of the tax gain is consistent with an interpretation that the firm keeps at least part of the gain from an occupational pension versus higher wage. Because the gain is strongly increasing in the wage level relative to the NIS, the gain effect is compatible with the high occurrence of occupational pensions in high wage firms. To our knowledge, such results are not found in any previous study.
A further indication that wage moderation may play a role and motivate further research into this aspect is the clear effect of negotiations. Central negotiations (only) imply 4 percentage points lower probability of an occupational pension compared to only individual negotiations (reference group). In the same vein, one standard deviation increase in the proportion unionized increases the probability by 20 percentage points. This fits in well with the results and arguments of Freeman (Reference Freeman1981), who concludes that the unions are vehicles for accommodating an agreement on a pension. It also supports the hypothesis that individual negotiations facilitate wage moderation in return for an occupational pension. Along the same lines are the results of Leigh (Reference Leigh1981) that unions will increase knowledge about pensions. This will increase their efficiency as a tool for the firm, and therefore increase their probability of offering occupational pensions.
The results confirm that occupational pension plans are a large firm phenomenon, even after controlling for many other variables. There are a number of reasons for this, as referred to in several of the studies described earlier in the paper. In particular, there can be significant scale benefits for large firms in setting up occupational pensions.
Training requirements also increase substantially the probability of an occupational pension. Training requirements up to six months compared to less than one week increases the probability by 12 percentage points. This is consistent with the idea that firms that require long training of their workforce will benefit more from longer tenure among their employees. The industry effects are included as control variables, and are not shown.
The modelling framework and the results provide a basis for further analyses of pension choice. A range of research questions beckon. As was pointed out in the introduction, occupational pensions were almost all DB in our observation period. In the last few years, we have seen a trend towards DC occupational pensions in Norway, as in many other countries. The results in this paper establish the importance of work force stability and financial incentives in occupational pension choice. Financial incentives will probably vary between DB and DC pensions, and may also change over time, e.g. due to changes in interest rates and the corresponding discount rates. The modelling framework may serve as a starting point to analyse the impact of this financial incentive.
Similarly, if portability costs and work force stability are lower for DC pensions, we would expect that firms opting for DC conversion are those for which the value of work force stability is less, for instance due to shorter training being required. Correspondingly, if employees want to make more frequent job moves, DB pension becomes less attractive. In general, if labour mobility in the labour market tends to increase for reasons exogenous to the present analysis, DC pensions will appear more attractive.
In combination with the continued existence of DB pensions in the public sector, it may also be that those firms that compete with the public sector for qualified personnel may not be so eager to switch. Thus, we might see a slowing down of the trend towards DC pensions in the private sector. This would also be an interesting issue to study.
8 Conclusions
This paper reconsiders the question of why some firms offer an occupational pension plan, while others do not. This is an issue that has received surprisingly little attention in the literature, and is increasingly important with the onset of population ageing, and the tendency by governments to reform pensions to limit fiscal liability.
To investigate this question empirically on Norwegian data, we have constructed a linked employer–employee dataset, and supplemented this with tax gains from offering a pension instead of a wage increase cost, based on detailed actuarial calculations to ensure that the cost to the firms of offering an occupational pension is equivalent to the wage increase. We also construct expected average tenure of the employees in each firm, with an occupational pension and without an occupational pension. The derived difference, interpreted as the gain for the firm from offering an occupational pension is also included in the logit estimation of firms' choice of occupational pension. To our knowledge, this is the most detailed analysis of the productivity and financial implications of the decision to offer an occupational pension undertaken to date.
We find that the magnitude of the constructed tax gains is clearly associated with the occurrence of an occupational pension plan, indicating that there may be a joint gain for employers and employees. For the employers the gain may take the form of wage moderation and for employees the gain may stem from the fact that pensions are taxed at lower rates than wage income. We conclude that this is a motivating factor for the establishment of an occupational pension, and plan to study this further by looking at wage moderation and the way the tax gains are split between employer and employees.
We also find that the increase in expected average tenure at firm level is significantly associated with the occurrence of an occupational pension, also when other factors described are controlled for. We interpret this to mean that firms use occupational pension to get a stable work force.
Moreover, we find that occupational pensions typically are found in large firms, and that individual wage negotiations and requirement of long training are positively associated with an occupational pension. We also find that a high degree of unionization increases the probability of an occupational pension. We conclude that financial and productivity incentives for an occupational pension operate within a moderating institutional framework.
The results provide a fruitful starting point for studying other issues related to occupational pensions, among them the current transition from DB to DC pension plans. One should then model the decision of the firm in terms of financial incentives from the two pension types, and also include other aspects, such as the difference in portability costs, and the impact on and value for the firm of work force stability. Hence, the approach and the results may provide the basis for further analyses of the development of occupational pensions.