For progress to be made in the scientific study of alcohol use disorder (AUD), we need to collect comparable samples across research centers. Operationalized diagnostic criteria were created in an attempt to standardize such efforts (Spitzer, Williams, & Skodol, Reference Spitzer, Williams and Skodol1980). However, AUD is a heterogeneous clinical condition. Samples collected across research centers could all meet the same definition of illness and still differ meaningfully from each other because of differences in key clinical features such as proportion of males v. females, age of onset, levels of recurrence and the presence or absence of medical complications of long-term alcohol use. If this is the case, comparisons across samples might be problematic, producing non-replications despite the accurate application of diagnostic criteria. Furthermore, pooling results across such studies could substantially increase the heterogeneity and decrease the accuracy of the findings.
Recently, molecular genetic investigations have raised a related question. Some studies have included samples of AUD who were originally part of a genetic study of another disorder – most typically drug use disorder (DUD) (Walters et al., Reference Walters, Polimanti, Johnson, McClintick, Adams, Adkins and Agrawal2018) – who also met criteria for AUD. How different are AUD cases selected in such a manner from cases more typically ascertained?
We examine these questions, using a novel strategy – the examination of profiles of family genetic risk scores (FGRS) (Kendler, Ohlsson, Sundquist, & Sundquist, Reference Kendler, Ohlsson, Sundquist and Sundquist2021a, Reference Kendler, Ohlsson, Sundquist and Sundquist2021b). These scores are based upon standardized morbid risk estimates of disorders in 1st through 5th-degree relatives, controlling for the effects of cohabitation. They are distinct from polygenic risk scores (PRS) as the estimate of genetic risk derives from members of their family, not from variation in their DNA. In this paper, we explore the pattern of mean genetic risk for six diverse psychiatric disorders and criminal behavior (CB) in individuals in a Swedish national cohort of individuals with AUD ascertained from criminal, medical and pharmacy registers. We ask two broad questions:
First, when our AUD cohort is subdivided by sex, age at onset (AAO), recurrence, mode of ascertainment and medical complications, how similar are the FGRS profiles of the resulting subgroups? Are they sufficiently alike that we can assume they represent the same patient population or do these clinical distinctions reflect significant genetic heterogeneity within the broad phenotype of AUD?
Second, how different are the genetic profiles of cases of AUD comorbid v. not comorbid with DUD and major depression (MD)?
Methods
We collected information on individuals from Swedish population-based registers with national coverage linking each person's unique personal identification number which, to preserve confidentiality, was replaced with a serial number by Statistics Sweden. We secured ethical approval for this study from the Regional Ethical Review Board in Lund (No. 2008/409, 2012/795 and 2016/679). Our database consisted of all individuals born in Sweden between 1932 and 1995, to Swedish born parents. In the database, we included registrations for AUD utilizing ICD-8, 9 and 10 codes from primary care, national specialist and hospital registries as well as prescription and criminal registers (see ‘description of registers’ in the online Supplementary Appendix). We included first date of registration for AUD as well as the number of registrations of AUD. Registrations within 90 days of a previous registration were not counted. Among individuals with AUD we also included registrations for DUD and MD. For all individuals we calculated individual FGRS for AUD, MD, anxiety disorder (AD), bipolar disorder (BD), DUD, attention deficit-hyperactivity disorder (ADHD) and CB (see online Supplementary Appendix Table S1 for ICD codes used for these disorders). The FGRS were based on a mean of 32.2 1st, 2nd, 3rd, 4th and 5th-degree relatives of the probands. Briefly (see online Supplementary Appendix Table S2 for further details), we first calculated the morbid risk for the phenotype based on age at first registration. Thereafter, we transformed the binary trait into an underlying liability distribution and calculated the mean Z-score for relatives with and without the trait. For first-degree relatives we also multiplied the z-score with a factor that sought to eliminate the influence of cohabitation. Within each type of relative, we then had two components: the sum of the z-scores and the total weighted number of relatives. These two components were further weighted by their genetic resemblance to the proband. For each proband, we summed the two components across all groups of relatives and used the quotient which was then multiplied by a shrinkage factor to take into account the number of relatives of the proband. So that the GRSs would be more comparable across traits, we standardized the FGRS, based on year of birth and county of residence, into a z-score with mean = 0 and s.d. = 1.
In order to examine the FGRS profiles of various subgroups of individuals registered with AUD (see online Supplementary Appendix Table S3 for further details on the definition of these subgroups), we first present the mean FGRS subdivided by sex. Thereafter, for the AAO analysis, we used a linear regression model with the FGRSs as outcome and AAO as a continuous variable while controlling for year of birth. In the figures, we present the predicted FGRS at the 10th, 30th, 50th, 70th, 90th percentile of the AAO distribution for individuals at the mean year of birth as well as the beta-coefficient for the slope. For the analysis of recurrence, we used a linear regression model with number of recurrences of AUD registrations as a continuous variable and we present the predicted FGRSs at the same five percentiles of the distribution of recurrences (except that the 10th and 30th percentile both have only one episode) as well as the beta-coefficient for the slope. To investigate source of ascertainment for AUD by register, we present the mean FGRS as well as a comparison across all groups. For the analyses of ascertainment based on medical register, we also use a linear regression model treating type of registration as a hierarchical continuous variable (at least one Inpatient registration, at least one specialist care registration, only a primary care registration). To investigate the FGRS profiles for medical complications, we first selected all individuals with at least one registration for AUD coded as either 303 in ICD-8 or 303, 305A in ICD-9, or F-10 in ICD-10. We then examine the FGRS profiles of cases with and without a medical complication of alcohol. Finally, we examine the FGRS profiles of cases of AUD comorbid v. not comorbid with MD and DUD. All test of equality between groups are made using a t test. Statistical analyses were performed using SAS 9.4.3 (SAS Institute, 2012).
Results
Descriptive features
The cohort included 5 829 952 individuals with a mean (s.d.) age at end of follow-up of 54.4 (18.1). AUD was diagnosed in 361 124 subjects for a lifetime prevalence of 6.2, 72.6% of whom were male. The mean age (s.d.) at first AUD registration was 40.0 (16.3).
We present our results in figures. In all the figures, the first number below the columns is the effect size of the difference. When we compare only two categories (e.g. female and male), that number is simply the magnitude of the difference. When there are multiple ordered categories (e.g. AAO), the number represents the linear slope of the regression line. In the one situation where we present three non-ordered categories (registry of ascertainment), we present all three of the two-way comparisons. The second number under the appropriate column is the p value of the comparison. Since we report 63 correlated tests, we adopt a p value at ⩽0.001 as a rough guide to statistical significance.
Genetic risk profiles
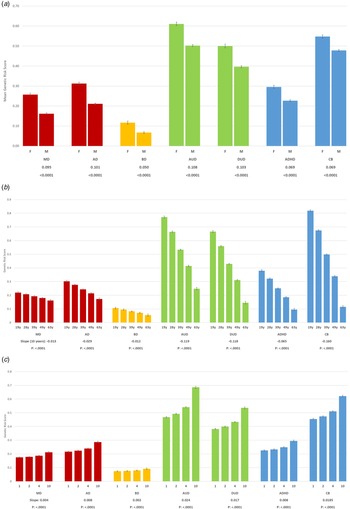
The FGRS profiles of females and males with AUD are seen in Fig. 1a. Affected females had significantly higher FRGS for all disorders compared to affected males with the effect size being largest for FRGSAUD, followed closely by the DUD, AD and MD FGRS.
(a) Mean standardized family genetic risk scores (FGRS) [± 95% confidence intervals (CI)] for major depression (MD), anxiety disorders (AD), bipolar disorder (BD), alcohol use disorder (AUD), drug use disorder (DUD), attention deficit-hyperactivity disorder (ADHD) and criminal behavior (CB) as a function of sex differences in individuals diagnosed with AUD. These FGRS scores are depicted on the Y-axis. F = female, M = Male. The shade (colors) of the columns reflect the class of the disorders: very light gray (red) –internalizing, light gray (yellow) – ‘psychotic’, dark gray (green) –substance use, black (blue) –externalizing. The differences are obtained from a linear regression analysis and reflect the FGRS score for females minus the FGRS score for males. Given the large number of tests performed, we set a p < 0.001 as a threshold for statistical significance. (b) The mean standardized family genetic risk scores (FGRS) (± 95% CIs) for major depression (MD), anxiety disorders (AD), bipolar disorder (BD), alcohol use disorder (AUD), drug use disorder (DUD), attention deficit-hyperactivity disorder (ADHD) and criminal behavior (CB) as a function of age at first registration as a proxy for AAO in individuals diagnosed with AUD. The figure depicts estimates from a linear regression model at the 10th, 30th, 50th, 70th and 90th percentile of the AAO distribution for individuals with AUD at the mean year of birth. As depicted in the figure, these percentiles are calculated as AAOs for AUD at ages 19, 28, 39, 49 and 63 years of age respectively. The slopes are obtained from a linear regression analysis and reflect the change in FGRS for each 10-year increase in AAO. The p value of the slope is obtained from this regression. Given the large number of tests performed, we set a p < 0.001 as a threshold for statistical significance. The shade (colors) of the columns reflect the class of the disorders: very light gray (red) –internalizing, light gray (yellow) – ‘psychotic’, dark gray (green) –substance use, black (blue) –externalizing. The differences are obtained from a linear regression analysis and reflect the FGRS score for females minus the FGRS score for males. Given the large number of tests performed, we set a p < 0.001 as a threshold for statistical significance. (c) The mean standardized family genetic risk scores (FGRS) (± 95% CIs) for major depression (MD), anxiety disorders (AD), bipolar disorder (BD), alcohol use disorder (AUD), drug use disorder (DUD), attention deficit-hyperactivity disorder (ADHD) and criminal behavior (CB) as a function of number of registrations of AUD. These FGRS scores are depicted on the Y-axis. The figure depicts estimates from a linear regression model at the 10th, 30th, 50th, 70th and 90th percentile of numbers of registrations for individuals with AUD. For AUD the 10th and the 30th percentile in the recurrence distribution was 1 and the 50th, 70th and 90th percentiles, were, respectively, 2, 4 and 10. The slopes are obtained from a linear regression analysis and reflect the change in FGRS for one unit increase in the number of episodes. Given the large number of tests performed, we set a p < 0.001 as a threshold for statistical significance. The shade (colors) of the columns reflect the class of the disorders: very light gray (red) –internalizing, light gray (yellow) – ‘psychotic’, dark gray (green) –substance use, black (blue) –externalizing. The p value of the difference is obtained from this regression.

FGRS profiles of AUD cases divided into quintiles by AAO are seen in Fig. 1b. All the seven FGRS declined significantly with older AAO. The slope was steepest for FGRSCB, followed by AUD, DUD and ADHD FGRS. The rate of FGRS decline with increasing AAO was much slower for the FGRS for AD, MD and BD.
The FGRS profiles of patients with AUD divided by recurrence rates are seen in Fig. 1c. All of the FGRS increased significantly with a greater number of episodes of illness. The slope was highest for FRGSAUD followed by CB and DUD FGRS while it was much weaker for the MD and BD FGRS.
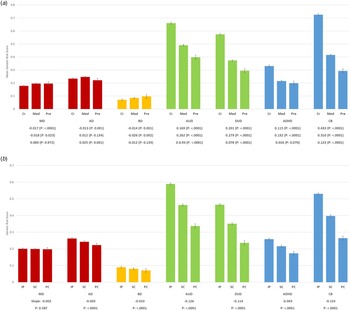
Figure 2a shows the seven FGRS for cases of AUD ascertained through the Swedish criminal, medical and pharmacy registers. The FGRS for AUD, DUD, ADHD and CB all had the following pattern: criminal > medical > pharmacy, with eight out of nine of the differences being statistically significant. The reverse pattern was seen for the MD and BD FRGS, with only a minority of the differences reaching significance. No clear trend was seen for the AD FGRS.
(a) Mean standardized family genetic risk scores (FGRS) (± 95% CIs) for major depression (MD), anxiety disorders (AD), bipolar disorder (BD), alcohol use disorder (AUD), drug use disorder (DUD), attention deficit-hyperactivity disorder (ADHD) and criminal behavior (CB) as a function of the ascertainment of AUD from the three main Swedish registries: criminal, medical and prescription (Cr, criminal; Med, medical and Pre, prescription). A hierarchy was used as follows: Criminal > Medical > Prescription. These FGRS scores are depicted on the Y-axis. We present results from a linear regression model treating ascertainment of AUD from the three registries as a categorical variable. We present the difference (and corresponding p-value) in FGRS for the three possible comparisons for each FGRS. The shade (colors) of the columns reflect the class of the disorders: very light gray (red) – internalizing, light gray (yellow) – ‘psychotic’, dark gray (green) – substance use, black (blue) – externalizing. Given the large number of tests performed, we set a p < 0.001 as a threshold for statistical significance. (b) The mean standardized family genetic risk scores (FGRS) (± 95% CIs) for major depression (MD), anxiety disorders (AD), bipolar disorder (BD), alcohol use disorder (AUD), drug use disorder (DUD), attention deficit-hyperactivity disorder (ADHD) and criminal behavior (CB) as a function of the ascertainment of AUD within the medical registries, that is, from in-patient (IP) facilities, specialist care (SC) out-patient facilities and primary-care (PC) out-patient facilities. We used a hierarchy such that registration in the IP superseded other registrations and registration in an SC clinic superseded that in a PC clinic. These FGRS scores are depicted on the Y-axis. We used a linear regression model treating type of registration as a hierarchical continuous variable from which we obtained the effect sizes (the slope representing one unit increase in the continuous variable, i.e. the difference in FGRS between PC and SC (or SC and IP) and p values. The shade (colors) of the columns reflect the class of the disorders: very light gray (red) – internalizing, light gray (yellow) – ‘psychotic’, dark gray (green) – substance use, black (blue) – externalizing. Given the large number of tests performed, we set a p < 0.001 as a threshold for statistical significance.

For cases of AUD ascertained in the medical registries, Fig. 2b shows the FGRS profile for those detected through in-patient, specialist and primary care facilities. Six of the seven FGRS showed significant declines with decreasing clinical intensity of the facility with the strongest effects seen for FGRSCB followed by FGRSAUD and FGRSDUD. By contrast, levels of the FGRSMD in AUD cases did not differ for those ascertained across these sites.
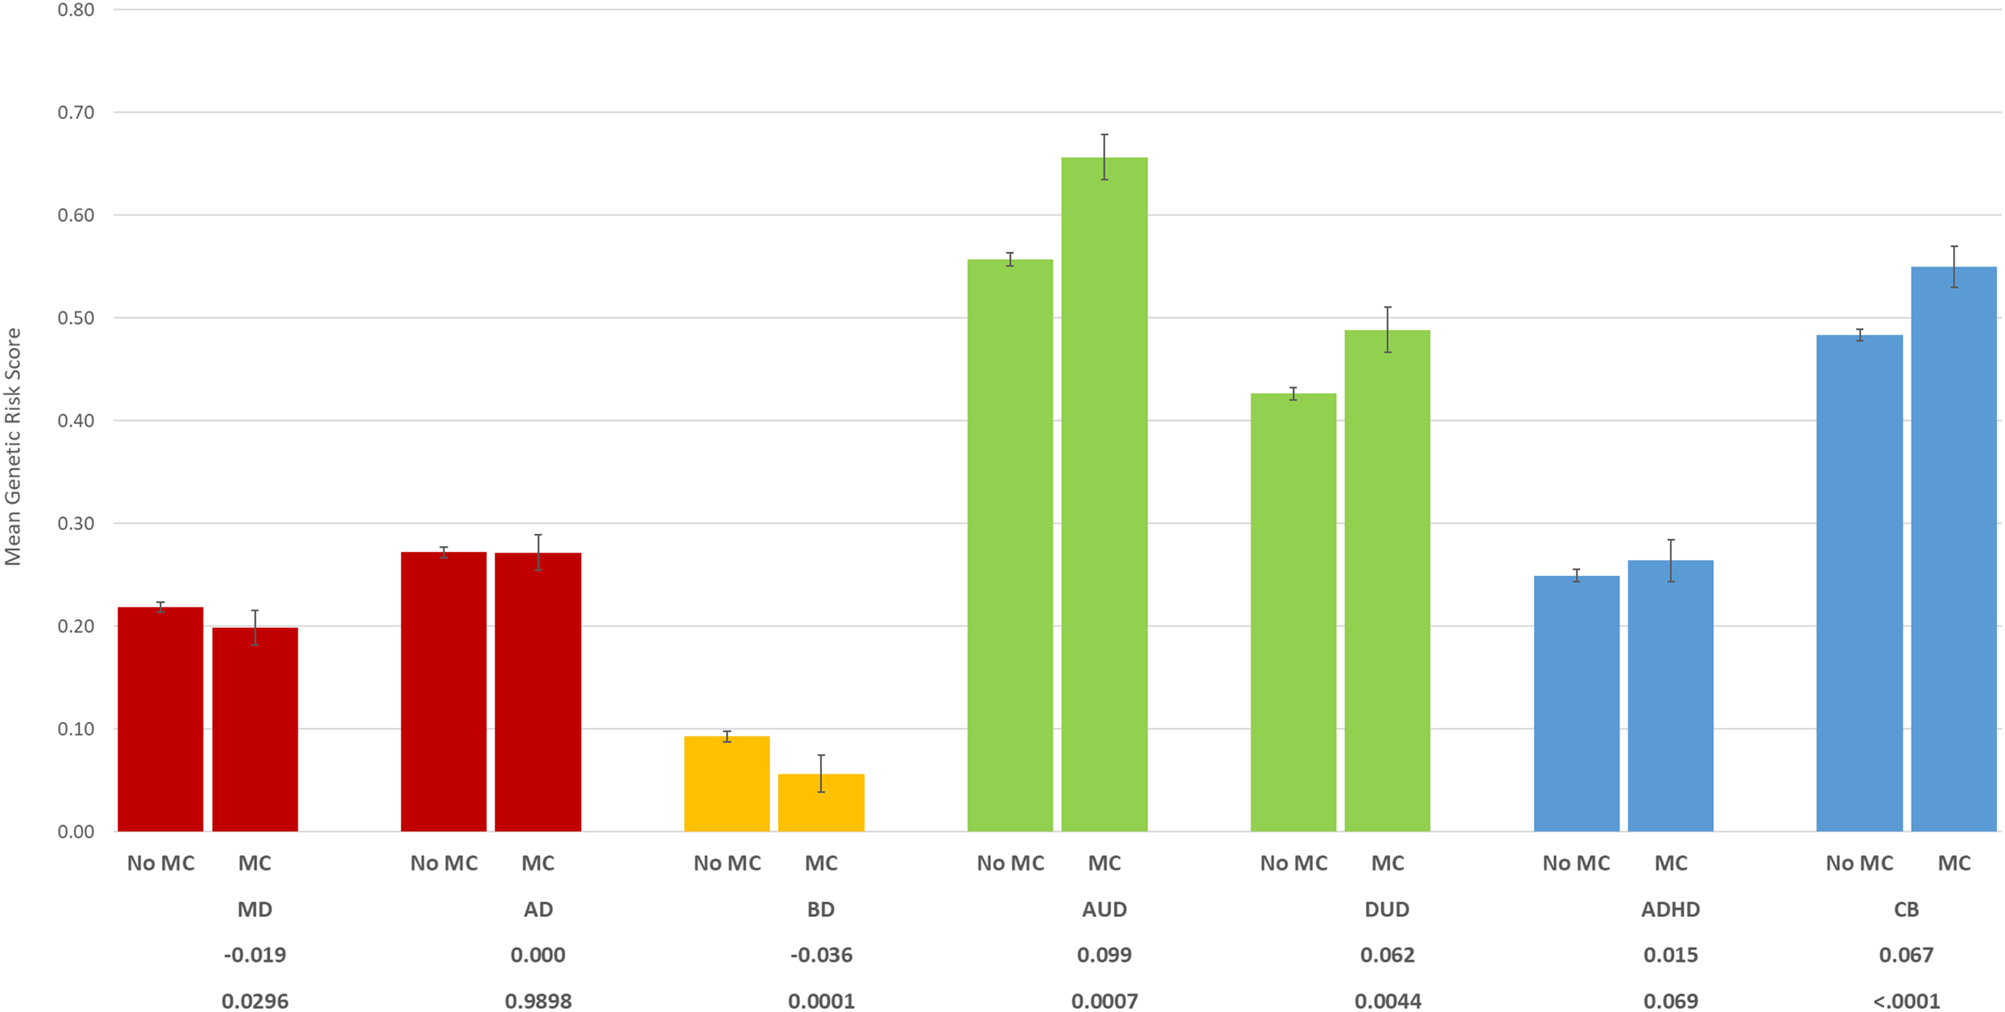
In Fig. 3, beginning with individuals with a diagnosis of AUD (coded as either 303 or 305A in ICD-9 or F-10 in ICD-10), we examined, in a model controlling for age at first registration, year of birth and sex, the impact on the risk profile of also having a medical complication resulting from excessive alcohol use. Those who had medical complications had significantly higher FGRS for AUD and CB and significantly lower levels of FGRSBD.
Mean standardized family genetic risk scores (FGRS) (± 95% CIs) for major depression (MD), anxiety disorders (AD), bipolar disorder (BD), alcohol use disorder (AUD), drug use disorder (DUD), attention deficit-hyperactivity disorder (ADHD) and criminal behavior (CB) as a function of the presence or absence of the medical complications of AUD in individuals diagnosed with clinical AUD in the registers. These FGRS scores are depicted on the Y-axis. No MC = no medical complications, MC – presence of medical complications. The differences and corresponding p values are obtained from a linear regression analysis and reflect the mean FGRS score for individuals with MC minus the FGRS score for individuals without MC. The shade (colors) of the columns reflect the class of the disorders: very light gray (red) – internalizing, light gray (yellow) – ‘psychotic’, dark gray (green) – substance use, black (blue) – externalizing. Given the large number of tests performed, we set a p < 0.001 as a threshold for statistical significance.

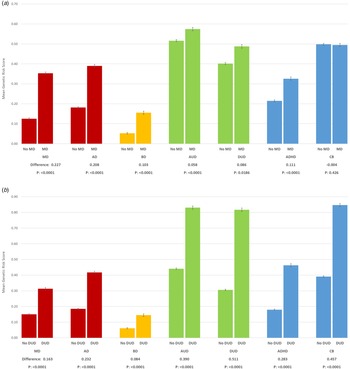
Finally, we asked how different AUD cases might be from a genetic perspective if they were ascertained from samples who were already diagnosed with MD or DUD. As seen in Fig. 4a, FGRS was significantly higher for the AUD + MD v. AUD only cases for all disorders except DUD. The largest differences, as expected, was for MD FGRS which much more modest effects seen for AUD FGRS. That is, the differences between the genetic profile of AUD only and AUD + MD cases were both quantitative (generally higher risk scores in the comorbid cases) and qualitative in that the increase in genetic risk in the comorbid cases was much greater for MD than for AUD FGRS and was entirely absent for the CB FGRS.
(a) Mean standardized family genetic risk scores (FGRS) (± 95% CIs) for major depression (MD), anxiety disorders (AD), bipolar disorder (BD), alcohol use disorder (AUD), drug use disorder (DUD), attention deficit-hyperactivity disorder (ADHD) and criminal behavior (CB) as a function of the presence or absence of a diagnosis of MD in individuals diagnosed with AUD. These FGRS scores are depicted on the Y-axis. The differences and corresponding p values are obtained from a linear regression analysis and reflect the mean FGRS score for individuals with MD minus the FGRS score for individuals without MD. The shade (colors) of the columns reflect the class of the disorders: very light gray (red) – internalizing, light gray (yellow) – ‘psychotic’, dark gray (green) – substance use, black (blue) – externalizing. Given the large number of tests performed, we set a p < 0.001 as a threshold for statistical significance. (b) The mean standardized family genetic risk scores (FGRS) (± 95% CIs) for major depression (MD), anxiety disorders (AD), bipolar disorder (BD), alcohol use disorder (AUD), drug use disorder (DUD), attention deficit-hyperactivity disorder (ADHD) and criminal behavior (CB) as a function of the presence or absence of a diagnosis of DUD in individuals diagnosed with AUD. These FGRS scores are depicted on the Y-axis. The differences and corresponding p values are obtained from a linear regression analysis and reflect the mean FGRS score for individuals with DUD minus the FGRS score for individuals without DUD. The shade (colors) of the columns reflect the class of the disorders: very light gray (red) – internalizing, light gray (yellow) – ‘psychotic’, dark gray (green) – substance use, black (blue) – externalizing. Given the large number of tests performed, we set a p < 0.001 as a threshold for statistical significance.

FGRS were significantly higher for all genetic risk scores in all cases with DUD + AUD v. AUD alone (Fig. 4b) with the largest effect seen for FGRSDUD, but a substantial increase also observed for the FGRSAUD. The difference in the genetic profile in the comorbid DUD + AUD v. AUD only cases was largely quantitative in nature.
Discussion
We sought, in these analyses, to use genetic profiles as a tool to investigate heterogeneity within the syndrome of AUD. We therefore examine both a theoretical question about the degree of variation with subgroups of patients suffering from AUD and an important research question. If we wish to combine and compare cross-site studies of AUD, is it sufficient to utilize the same diagnostic approach or do other features of the patient cohort need to be taken into consideration? Our results would be of particular relevance for efforts to assemble AUD cohorts for molecular genetic investigations as underway within the Psychiatric Genomics Consortium (Sullivan et al., Reference Sullivan, Agrawal, Bulik, Andreassen, Borglum, Breen and O'Donovan2018).
Our first analyses examined differences in the genetic profiles of men and women with AUD. In 1978, Cloninger and colleagues formally examined the fit of the multiple threshold model for sex to family data for AUD (Cloninger, Christiansen, Reich, & Gottesman, Reference Cloninger, Christiansen, Reich and Gottesman1978) which posits that affected females would have higher liability on the same liability distribution as would men. That model was rejected as rates of AUD were not higher in the relatives of female v. male AUD probands as would be expected if higher familial risk was needed for a female to develop AUD. This result has been confirmed in further family studies (Merikangas, Reference Merikangas1990). A much more recent meta-analysis of twin studies found heritability estimates for AUD did not differ across the sexes (Verhulst, Neale, & Kendler, Reference Verhulst, Neale and Kendler2015). Our results, from a large population cohort, run counter to these prior findings. Females with AUD had substantially and significant higher FGRS not only for AUD but for every other disorder investigated. Indeed, the absolute magnitude of the increase in females for their MD and AD FRGS were nearly as large as that seen for AUD itself. From a quantitative perspective, females with AUD have higher genetic loading than do males across a wide spectrum of psychiatric and substance use disorders.
Variations in genetic risk as a function of AAO for AUD were considerably stronger than seen across the sexes. Consistent with a range of prior work(Dawson, Reference Dawson2000; McGue, Pickens, & Svikis, Reference McGue, Pickens and Svikis1992; Penick, Read, Crowley, & Powell, Reference Penick, Read, Crowley and Powell1978; Pickens et al., Reference Pickens, Svikis, McGue, Lykken, Heston and Clayton1991), an individual in the lowest quintile of AAO had a level of genetic risk for AUD over three times greater than an individual with an AAO in the highest quintile. Similar large effects were seen for the genetic risk of the other externalizing disorders: DUD, ADHD and CB. From a genetic perspective, AAO has a robust quantitative effect on the genetic profiles of those with AUD, with risks for all disorders rising in those with early onsets.
Congruent with prior evidence that family history loading for AUD is associated with a more recurrent course(Milne et al., Reference Milne, Caspi, Harrington, Poulton, Rutter and Moffitt2009), we found significant increases in the FGRSAUD with greater numbers of registrations. Levels of genetic risk for all other disorders examined also increased with higher levels of recurrence, the impact being most notable for FGRSDUD and FGRSCB.
As reviewed above, population registries in Sweden permit the ascertainment of cases of AUD from three sources: (i) the criminal registry for alcohol-associated crimes, especially drunk driving; (ii) the medical registry and (iii) the pharmacy registry – made possible because three AUD treatments in Sweden – naloxone, acamprosate and Antabuse – are all AUD-specific. How would the genetic profile of cases ascertained from these various sources differ?
We first compared results for AUD cases ascertained from these three registries and found levels of FGRSAUD were substantially higher in those detected through the criminal registry with similar but even more robust differences seen for FGRSDUD and FGRSCB. By contrast, the differences in genetic risk for MD and AD differed only modestly across these samples.
Within the Swedish medical registry, there are three distinct sub-registries reflecting increasing intensity of clinical services: primary care, specialist out-patient care and in-patient facilities. The FGRSAUD was substantially higher in cases ascertained in the higher v. lower intensity clinical settings with similar trends seen for the genetic risks for DUD and CB. Interestingly, no such effects were seen for FGRSMD although a small similar trend was seen for FGRSAD.
Prior studies suggest a genetic effect on the risk for MC in cases of AUD (Hrubec & Omenn, Reference Hrubec and Omenn1981; Stickel, Moreno, Hampe, & Morgan, Reference Stickel, Moreno, Hampe and Morgan2017), although there is a continuing debate about whether these effects are independent of or correlated with the genetic risk for AUD (Reed, Page, Viken, & Christian, Reference Reed, Page, Viken and Christian1996). In our analyses, FGRSAUD was significantly increased in those with MC, suggesting that MC arise partly due to an increased genetic risk for AUD, likely mediated through effects we see with elevated FGRSAUD, including early AAO and high levels of recurrence. Thus, the level of FGRSAUD would likely be correlated in affected individuals with the level and duration of exposure of vulnerable organs to elevated blood levels of ethanol. It is noteworthy that AUD individuals with MC also had increased genetic risk for other externalizing syndromes.
Our final analyses examined the impact on genetic profiles of ascertaining AUD cases through individuals previously diagnosed with MD or DUD. In each case, the levels of FGRSAUD were significantly greater in the comorbid cases, with a much larger increase seen in those comorbid with DUD than with MD. We suggested that it is useful to consider two kinds of changes that might occur in genetic risk scores with comorbidity: quantitative and qualitative. For the DUD + AUD comorbid cases, the pattern looked largely quantitative in that all FRGS increased to an approximately similar extent compared to that seen in AUD only cases. For MD, by contrast, the pattern was a mixture of quantitative and qualitative effects. Researchers should be aware that selecting cases of AUD from cohorts collected for having other psychiatric or substance use disorders could be advantageous if the effects of comorbidity are largely quantitative so that affected subjects will have higher genetic risk. However, if the genetic risk profiles differ qualitatively, including comorbid cases could introduce undesirable genetic heterogeneity into the results. For example, Walters et al. (Walters et al. Reference Walters, Polimanti, Johnson, McClintick, Adams, Adkins and Agrawal2018) ascertained some of their cases of AUD for a genome-wide association study from studies of cocaine or nicotine dependence and from a study of antisocial drug dependence. Our results suggest that these individuals were likely to have an increased genetic loading for AUD and for a range of other related disorders. It would be an empirical question whether the gain in statistical power from these quantitative differences might be offset by a decrease in the specificity of the genetic signal if substantial qualitative effects were also seen in these comorbid groups.
Limitations
These findings should be viewed in the context of four potential methodological limitations. First, the validity of the FGRS score is dependent on the quality of the available diagnoses in the Swedish national registries which has been well demonstrated for several severe psychiatric disorders including, BD (Lichtenstein et al., Reference Lichtenstein, Bjork, Hultman, Scolnick, Sklar and Sullivan2006) (Ekholm et al., Reference Ekholm, Ekholm, Adolfsson, Vares, Osby, Sedvall and Jonsson2005; Rück et al., Reference Rück, Larsson, Lind, Perez-Vigil, Isomura, Sariaslan and Mataix-Cols2015; Sellgren, Landen, Lichtenstein, Hultman, & Langstrom, Reference Sellgren, Landen, Lichtenstein, Hultman and Langstrom2011). The validity of MD diagnoses is supported by its prevalence, sex ratio, sibling and twin correlations and associated psychosocial risk factors (Kendler, Ohlsson, Lichtenstein, Sundquist, & Sundquist, Reference Kendler, Ohlsson, Lichtenstein, Sundquist and Sundquist2018; Sundquist, Ohlsson, Sundquist, & Kendler, Reference Sundquist, Ohlsson, Sundquist and Kendler2017). Genetic epidemiological findings for AUD and DUD in Sweden have been similar to those found in other samples (Kendler et al., Reference Kendler, Sundquist, Ohlsson, Palmer, Maes, Winkleby and Sundquist2012, Reference Kendler, Ji, Edwards, Ohlsson, Sundquist and Sundquist2015, Reference Kendler, PirouziFard, Lonn, Edwards, Maes, Lichtenstein and Sundquist2016; Kendler, Maes, Sundquist, Ohlsson, & Sundquist, Reference Kendler, Maes, Sundquist, Ohlsson and Sundquist2013). We are unaware of attempts to validate Swedish diagnoses for ADHD or AD.
Second, our diagnoses for individuals with AUD require them to present for medical treatment, have a criminal contact related to alcohol abuse, or take specific pharmacological treatments for AUD. We are therefore likely to miss some mildly affected individuals and cannot rule out correlated treatment seeking in relatives as a potential confounder.
Third, in comparing results across a wide range of disorders, the question of diagnostic hierarches arises. We only utilized them in our ascertainment analyses where we adopted a common-sense approach. AUD cases detected in more ‘deviant’ or ‘severe’ settings (e.g. criminal registry or hospital) were so assigned even if the cases had also been detected through other registries (e.g. pharmacy or primary care).
Fourth, the FGRS is a relatively novel statistic which estimates genetic risk by assessing the aggregation of disease in close and distant relatives and is therefore conceptually quite different from a molecular PRS. Online Supplementary Appendix Table S4 shows that our final genetic risk scores are not highly sensitive to key steps in their calculation, as their deletion produces results that correlate highly with those from the full model and have similar predictive power. For example, if we eliminate our correction for geography or for cohabitation, the results correlate, respectively, +0.97 and +0.99 with the final score. We also explored the stability of our AUD FGRS, examining differences by age cohort and geographical region within Sweden in online Supplementary Appendix Fig. S1. Reassuringly, while significantly different because of our very large sample size, we found only modest quantitative effects of time and space on our AUD FGRS.
Conclusions
Our results demonstrate that the profile of genetic risks for individuals with AUD differs substantially across individuals differing in major clinical features, especially AAO, levels of recurrence and mode of ascertainment. The differences by sex are generally more modest. These findings suggest caution in cross-sample comparisons of AUD cases that differ substantially in these features. While such cases may all make diagnostic criteria for AUD, research findings might be confounded by important inter-sample etiologic heterogeneity as indexed by their genetic risk profiles. If sample characteristics were not standardized in sample collections for molecular genetic studies of AUD, this could result in reduced cross-site replication and noisier aggregate genetic signals.
While increasing the sample size of AUD cohorts for molecular genetic analysis by adding cases ascertained for other disorders might seem as a useful way to increase power, our findings suggest that there could also be a downside to that approach. The relative advantages and disadvantages of using this approach would be related to the degree to which the association changes in the genetic risk pattern would be quantitative v. qualitative in nature.
Supplementary material
The supplementary material for this article can be found at https://doi.org/10.1017/S0033291721003317