INTRODUCTION
General assessments of biodiversity patterns in western Amazonia have focused on a variety of taxa, but data on animal community structure across major forest types remain scarce (Larsen et al. Reference LARSEN, LOPERA and FORSYTH2006, Pearson & Derr Reference PEARSON and DERR1986, Peres Reference PERES1997, Sääksjärvi et al. Reference SÄÄKSJÄRVI, RUOKOLAINEN, TUOMISTO, HAATAJA, FINE, CÁRDENAS, MESONES and VARGAS2006). Most previous studies focusing on amphibian diversity in lowland Amazonia have compared assemblages across different sites without taking into account the effect of naturally occurring forest types on community structure (Azevedo-Ramos & Galatti Reference AZEVEDO-RAMOS and GALATTI2002, Blair & Doan Reference BLAIR and DOAN2009, Dahl et al. Reference DAHL, NOVOTNY, MORAVEC and RICHARDS2009, Doan & Arizábal Reference DOAN and ARIZÁBAL2002). In other studies, researchers have defined habitats based on the degree of anthropogenic disturbance (e.g. primary forest, secondary forest, plantation; Gardner et al. Reference GARDNER, RIBEIRO-JUNIOR, BARLOW, ÁVILA-PIRES, HOOGMOED and PERES2007a, Pearman Reference PEARMAN1997) or focused on only one type of forest (Aichinger Reference AICHINGER1987). In some cases, results from a study conducted in a single site and a single forest type (Allmon Reference ALLMON1991) were regarded as representative of entire South American forests (Vasudevan et al. Reference VASUDEVAN, KUMAR, NOON and CHELLAM2008).
A recent comparison of amphibian assemblages across four major forest types in south-eastern Peru showed that these habitats may contribute to the local variation in amphibian species richness and composition (von May et al. Reference VON MAY, SIU-TING, JACOBS, MEDINA-MÜLLER, GAGLIARDI, RODRÍGUEZ and DONNELLY2009a). Because this comparison was made at only one site, and only species presence/absence data were used, the next step is to evaluate whether similar patterns exist at other sites in the region. A large-scale comparison, incorporating abundance data (this paper), allows us to improve our understanding of amphibian diversity in the region. Moreover, the inclusion of additional sites allows us to explore the relationship between species composition and geographic distance. Some studies have illustrated a negative association between similarity and geographic distance (Azevedo-Ramos & Galatti Reference AZEVEDO-RAMOS and GALATTI2002, Duellman & Thomas Reference DUELLMAN and THOMAS1996), whereas other studies have found no association between similarity and geographic distance (Dahl et al. Reference DAHL, NOVOTNY, MORAVEC and RICHARDS2009, Doan & Arizábal Reference DOAN and ARIZÁBAL2002).
Here, our primary goal was to test the hypothesis that amphibian species richness, composition and abundance differ across forest types in the lowlands of south-eastern Peru. We focused on four major forest types that are widespread and cover most of the lowlands of south-western Amazonia: floodplain forest, terra firme forest, bamboo forest and palm swamp (Griscom et al. Reference GRISCOM, DALY and ASHTON2007, Mostacedo et al. Reference MOSTACEDO, BALCAZAR and MONTERO2006, Phillips et al. Reference PHILLIPS, GENTRY, REYNEL, WILKIN and GALVEZ-DURAND1994, Pitman et al. Reference PITMAN, TERBORGH, SILMAN and NUÑEZ1999). Given that other animal assemblages have been shown to vary according to the type of forest (Larsen et al. Reference LARSEN, LOPERA and FORSYTH2006, Pearson & Derr Reference PEARSON and DERR1986, Peres Reference PERES1997), we predicted that amphibian species richness and abundance distribution patterns would also differ across forest types. Additionally, because geographic distance may influence the patterns of community structure (Ernst & Rödel Reference ERNST and RÖDEL2005, Reference ERNST and RÖDEL2008; Parris Reference PARRIS2004), we tested the hypothesis that sites close to each other are more similar than sites farther away from each other.
MATERIALS AND METHODS
Study sites
We surveyed four major forest types at each of four sites in the Madre de Dios region of south-eastern Peru: Los Amigos Research Center (CICRA is the Spanish acronym), 12°34′07″S, 70°05′57″W, 270 m asl; Centro de Monitoreo 1 (CM1), 12°34′17″S, 70°04′29″W, c. 250 m asl; Centro de Monitoreo 2 (CM2), 12°26′57″S, 70°15′06″W, 260 m asl; Tambopata Research Center (TRC), 13°08′30″S, 69°36′24″W, 350 m asl. The first three sites are 3.5–25 km away from each other and the fourth site (TRC) is 80–105 km away from the other three sites. At CICRA, annual rainfall is variable and ranges between 2700 and 3000 mm (http://atrium-biodiversity.org). The dry season (June–September) has less rainfall and is slightly cooler than the wet season. The mean annual temperature ranges between 21 °C and 26 °C (N. Pitman, pers. comm.). Details about our study sites can be found in Kratter (Reference KRATTER1997), Doan & Arizábal (Reference DOAN and ARIZÁBAL2002) and maps are available at the Atrium Biodiversity Information System site (http://atrium-biodiversity.org).
Forest types
We followed the general categories of forest types recognized by plant ecologists working in Madre de Dios and nearby regions (Griscom & Ashton Reference GRISCOM and ASHTON2006, Griscom et al. Reference GRISCOM, DALY and ASHTON2007, Mostacedo et al. Reference MOSTACEDO, BALCAZAR and MONTERO2006, Olivier Reference OLIVIER2007, Pitman et al. Reference PITMAN, TERBORGH, SILMAN and NUÑEZ1999, Silman et al. Reference SILMAN, ANCAYA, BRINSON, Leite, Pitman and Alvarez2003). We did not follow the categories proposed by Phillips (Reference PHILLIPS1993) and Phillips et al. (Reference PHILLIPS, GENTRY, REYNEL, WILKIN and GALVEZ-DURAND1994) because their classification was limited to a small area (112.4 km2) that represents only 0.13% of Madre de Dios (85 300 km2) and does not include our study sites.
The floodplain forest can be classified in two general categories: mature floodplain forest and primary successional floodplain forest (Pitman et al. Reference PITMAN, TERBORGH, SILMAN and NUÑEZ1999). We sampled only in mature floodplain forest (hereafter referred to as floodplain), which exhibits high plant diversity, a 25–35-m-tall canopy (except for gaps), numerous lianas and emergent tree species. Flooding may occur once a year or once every few years depending on river level fluctuations; inundation varies from > 1.0 m near the river to 0.1 m on more elevated terraces (Hamilton et al. Reference HAMILTON, KELLNDORFER, LEHNER and TOBLER2007). Temporary bodies of water are common during the wet season as a result of rainwater accumulation.
The terra firme forest (hereafter referred to as terra firme) is found on higher terrain that is never flooded by the river (Pitman et al. Reference PITMAN, TERBORGH, SILMAN and NUÑEZ1999). The terra firme at our sites is 20–40 m above the floodplain and is primarily found on flat upland terraces dissected by small permanent or temporary streams. We sampled on these terraces and avoided streams and ravines bordering streams. The terra firme has fewer temporary ponds than the floodplain because little rainwater is retained in the upper soil layers. The terra firme also exhibits high plant diversity, > 32 m tall canopy (except for gaps) and many species of emergent trees (Griscom & Ashton Reference GRISCOM and ASHTON2006).
The bamboo forest (hereafter referred to as bamboo) is patchily distributed and covers extensive areas dominated by two native bamboo species, Guadua sarcocarpa and G. weberbaueri (Griscom et al. Reference GRISCOM, DALY and ASHTON2007, Olivier Reference OLIVIER2007). At our sites, bamboo forms patches of variable size (c. 1 ha to 100+ ha), is interspersed within the terra firme and its canopy is lower (up to 25 m) than the terra firme canopy (Griscom & Ashton Reference GRISCOM and ASHTON2006).
The palm swamp forms patches of variable size, typically between tens to hundreds of hectares, dominated by the native palm Mauritia flexuosa. Palm swamp soils can be permanently or seasonally flooded, are nitrogen-limited and have abundant organic matter (Householder Reference HOUSEHOLDER2007, Kahn Reference KAHN1991). Slow decomposition results in acidic soil and water (pH 4.5–5.5; J. Janovec, pers. comm.). More than 50% of the palm swamps were flooded (0.1–0.7 m) during the study.
Sampling methods
We conducted standardized sampling between 18 January and 16 April 2008 (wet season). The average rainfall, as measured between December 2007 and April 2008, was 159.4 mm mo−1 in 2008 (http://atrium-biodiversity.org). We sampled on flat terrain in all forest types and avoided slopes that mark the transition between forest types. These slopes represent an ecotone and may harbour a mix of species from different habitats. To account for the interspersion of replicated samples, we established twenty 50-m transects per habitat at each site. This number was selected following our preliminary work at CICRA and published reports from other tropical forests (Veith et al. Reference VEITH, LÖTTERS, ANDREONE and RÖDEL2004). We selected habitat patches dissected by at least 200 m of trail at each site and all transects were established away from trails to avoid bias associated with potential trail effects (von May & Donnelly Reference VON MAY and DONNELLY2009). We used a random number table (Heyer et al. Reference HEYER, DONNELLY, MCDIARMID, HAYEK and FOSTER1994) to determine the distance along the trail from which each transect began. All transects were perpendicular with respect to the main trail, began 5 m away from the trail and were separated by at least 30 m. Because transects were established in several patches, transects representing each forest type were separated by up to 3 km. Thus, transects included the variability associated with each habitat. We used a compass and a 50-m string with orange flagging marked at every 5 m to establish each transect. Understorey vegetation was only disturbed when tangled vegetation blocked access; in those cases, we used a machete to clear a narrow path and waited for at least 3 d before sampling. Our sampling effort was 320 transects, and each transect was sampled only once to maintain independent sampling units (as opposed to other studies, where transects were re-sampled multiple times).
We sampled all transects at night (19h00–01h30) because most amphibians are nocturnal, and night sampling using visual encounter surveys (VES; Crump & Scott Reference CRUMP, SCOTT, Heyer, Donnelly, McDiarmid, Hayek and Foster1994) is more effective than other sampling methods (Doan Reference DOAN2003). Our preliminary work showed that nocturnal surveys were effective for finding both diurnal and nocturnal species. Moreover, previous research in other tropical forests has shown that some diurnal species are found more often at night than during the day (Lieberman Reference LIEBERMAN1986).
We used distance-and-time-constrained VES (50 × 4-m transect in 30 min) as an alternative to the traditional VES method. To reduce the variation in species detectabilities, which can be considered an issue in VES (Pearman et al. Reference PEARMAN, VELASCO and LÓPEZ1995), our search protocol included disturbance of the substrate (in traditional VES, the substrate is not effectively disturbed during search). While walking along a transect, we first visually scanned the area using our lights and then disturbed the substrate with a snake hook. Any frog that was not detected by our first visual assessment was eventually spotted as it jumped away from its original location. All individuals located within 2 m on either side of the centre line of the transect, and on substrate up to 2 m in height, were captured. We placed all encountered individuals in separate plastic bags that were tied to the string marking the centre line of the transect. All sampling was conducted by two or three observers with headlamps. If there were three observers, only the first two actively searched while the third one recorded data. If there were only two observers, data recording was done at the end of each survey. Each transect took 30 min to complete, i.e. 1 person-hour was effectively invested per transect. We identified, measured and released all captured individuals.
We collected voucher specimens only when field identification was not possible. These specimens were identified and deposited at the Museo de Historia Natural of Universidad Nacional Mayor de San Marcos, in Lima, Peru. Species nomenclature follows the on-line reference to amphibian taxonomy, Amphibian Species of the World (http://research.amnh.org/herpetology/amphibia/index.php).
Data analysis
Because our primary interest was to evaluate amphibian community structure across forest types, we grouped and analysed most data with respect to forest type. In this paper, the term ‘abundance’ refers to ‘relative abundance’ under the assumption that the number of individuals counted in a transect represents the abundance in which species occur in a particular place and time.
We first used sample-based rarefaction curves to compare patterns of species richness among forest types. We pooled data collected at all sites and used the program EstimateS, version 8.0 (http://viceroy.eeb.uconn.edu/estimates) for this comparison (Gotelli & Colwell Reference GOTELLI and COLWELL2001). We then used analysis of variance (ANOVA) to compare the average species richness among forest types, and graphically compared the minimum and maximum number of species recorded in each forest type across all sites. We plotted rank-abundance curves to compare the species abundance distributions among forest types. We arbitrarily defined as abundant species those that were represented by at least 20 individual observations (which correspond to approximately 1% of all identified individuals).
We used the additive partitioning approach (Lande Reference LANDE1996) to describe patterns of beta diversity across the landscape. According to Lande (Reference LANDE1996), gamma diversity is composed by the addition of the alpha and beta components, γ = α + β. We obtained γ by pooling the number of species recorded in all habitats ( = forest types), while α represented the mean number of species recorded in each habitat and β represented the mean number of species not found in each habitat. We estimated β by β = γ − α. Researchers have used this approach to describe amphibian diversity patterns across habitats (Gardner et al. Reference GARDNER, RIBEIRO-JUNIOR, BARLOW, ÁVILA-PIRES, HOOGMOED and PERES2007a, Pineda & Halffter Reference PINEDA and HALFFTER2004).
We used non-metric multidimensional scaling (nMDS) plots to visualize patterns of community structure. For this analysis, each site had four habitat patches (sensu Leibold et al. Reference LEIBOLD, HOLYOAK, MOUQUET, AMARASEKARE, CHASE, HOOPES, HOLT, SHURIN, LAW, TILMAN, LOREAU and GONZALEZ2004) and each patch represented a different forest type. The nMDS plots were based on a Bray–Curtis dissimilarity matrix, first using species presence/absence and then using species abundance data (Clarke & Warwick Reference CLARKE and WARWICK1994). We also ran an analysis of similarity (ANOSIM) to test for relationship among forest types and calculated the similarity percentage contribution (SIMPER) to evaluate which species were most important in determining the dissimilarity between pairs of groups (Clarke & Warwick Reference CLARKE and WARWICK1994). We applied the indicator species analysis procedure (Dufrene & Legendre Reference DUFRENE and LEGENDRE1997) to determine which species can be used as indicators of particular forest types. We used the statistical software Primer-E, version 5.0 (Clarke & Warwick Reference CLARKE and WARWICK1994) to generate the nMDS plots and to run the ANOSIM and SIMPER, and we used PC-ORD version 5.0 (MjM Software, Gleneden Beach) for the indicator species analysis.
We used a Mantel test to evaluate the correlation between similarity and geographic distance. As in the previous analyses, each site had four habitat patches. We used a matrix containing presence/absence data (Jaccard similarity index) and a matrix with the geographic distance among habitat patches. We also used a matrix containing abundance data (Bray–Curtis dissimilarity index) and a matrix with the geographic distance among habitat patches. First, we tested whether there was a correlation between similarity and distance when forest types are not taken into account (as in previous studies). For this analysis, our matrix contained all possible pairs of habitat patches. Second, we tested whether there was a correlation between similarity and distance when forest types are taken into account. For this analysis, we ran a separate Mantel test for each forest type. We also performed Pearson correlations on the same dataset to further assess the relationship between similarity and distance (the values of distance, originally measured in km, were log-transformed in this case). We used an Excel spreadsheet integrated with PopTools (http://www.cse.csiro.au/poptools) to perform Mantel tests and SPSS version 14.0 (SPSS Inc., Chicago) for the correlations.
RESULTS
We captured and identified 1967 individuals of 65 amphibian species at four sites (Appendix 1). Fifty-one individuals (2.59%) escaped prior to identification and were not included in the analyses. As is typical for most amphibian communities in the Neotropics, the family Hylidae was the most species-rich (26 species). Ten other amphibian families were recorded, three of which were represented by only one species (Appendix 1). The only non-anuran family was Plethodontidae (lungless salamanders).
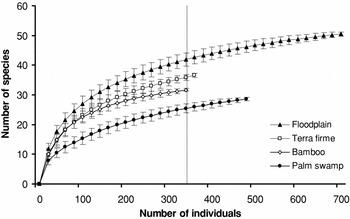
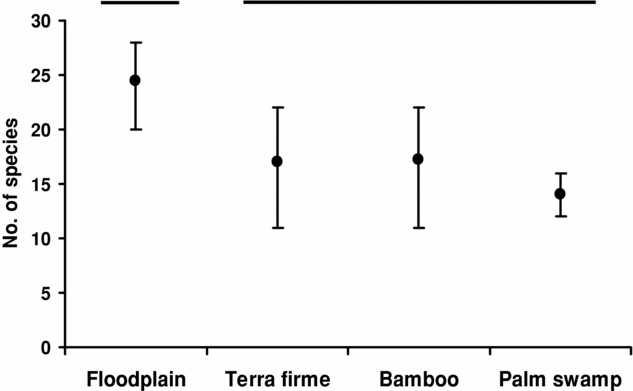
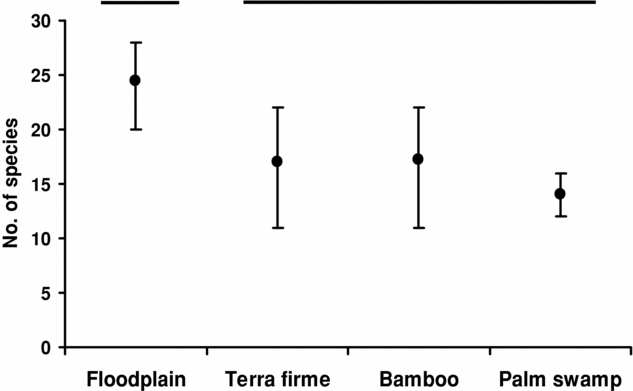
Our sample size was sufficient to characterize the species richness and composition across forest types because the species accumulation curves approached an asymptote (Figure 1). Overall, we recorded more individuals and species in the floodplain than in other forest types (Figure 1). Accordingly, the mean number of species in the floodplain was higher than in other forest types (ANOVA, F 3,12 = 5.37, P = 0.014) and the maximum and minimum numbers of species in this habitat were also higher than in other habitats (Figure 2). We recorded nearly the same number of individuals and species in the terra firme and bamboo, and both forest types exhibited similar pattern of species accumulation. We recorded the lowest number of species in the palm swamp, although this habitat ranked second in terms of total abundance. We found the same pattern when comparing species richness based on a standardized abundance (e.g. 350 individuals; Figure 1).
Rarefaction curves based on data collected at four sites (CICRA, CM1, CM2 and TRC). Each curve represents the expected number of species for a given number of observed individuals, though the rarefaction was based on randomization of sample order. The bars indicate ± 1 SD. The dotted vertical line indicates the point of comparison for the four curves.

Mean (markers), minimum and maximum (bars) number of amphibian species recorded in each forest type, based on data collected at four sites (CICRA, CM1, CM2, TRC). Bars on top denote significantly different groups in Student–Newman–Keuls post hoc comparisons.
The gamma diversity, according to the additive partitioning approach, can be expressed as: 65 [γ] = 18.2 [α] + 46.8 [β]. Within each forest type, beta diversity contributed about half of the total gamma diversity (floodplain = 52%, terra firme = 54%, bamboo = 46%, palm swamp = 53%). Overall, mean diversity and evenness were higher in the floodplain than in the other forest types (Appendix 1).
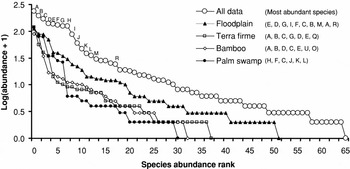
We found differences in species abundance distributions among forest types, as indicated by different shapes of the rank-abundance distribution curves (Figure 3). We found more abundant species (i.e. those with > 20 individuals) in the floodplain than in the other forest types, and the slope of the floodplain curve resembles the curve for all data combined. The species abundance distributions in the terra firme and the bamboo resemble each other and indicate that these forest types have less abundant species compared with the floodplain. The abundance distribution in the palm swamp also indicates that this forest type has less abundant species compared with the floodplain (Figure 3).
Rank-abundance distribution curves of species recorded across sites and forest types. The rank-abundance curve for all data combined is shown on top of the individual curves for each forest type. Each forest type includes pooled data from four sites. The most abundant species (> 20 individuals observed across all sites) are labelled with particular letters in the curve for all data; only four of the 18 most abundant species were not labelled, but they are N, O, P, Q (between labels M and R). For each forest type, the most abundant species (> 70%) are labelled in decreasing order in parentheses. The relative abundance was transformed to log(abundance + 1), where abundance is the number of individuals recorded in each forest type. Letter codes: A = Pristimantis reichlei, B = Leptodactylus (Adenomera) sp., C = Rhinella margaritifera, D = Pristimantis toftae, E = Engystomops freibergi, F = Leptodactylus petersii, G = Hamptophryne boliviana, H = Dendrophryniscus minutus, I = Chiasmocleis ventrimaculata, J = Ameerega hahneli, K = Hypsiboas cinerascens, L = Hypsiboas lanciformis, M = Phyllomedusa vaillanti, N = Noblella myrmecoides, O = Ameerega trivittata, P = Scinax ictericus, Q = Oreobates cruralis, R = Pristimantis carvalhoi, U = Dendropsophus minutus.

Our indicator species analysis confirmed the patterns exhibited by the rank-abundance distribution curves and detected additional species that could be used to characterize each forest type. Overall, between one and six species could be used to characterize each forest type (these species are labelled with an asterisk in Appendix 1) and they contribute more than 50% to the total average dissimilarity between forest types. The SIMPER results show that the average dissimilarity between the floodplain and the terra firme was 73.2%. The average dissimilarity between the floodplain and bamboo was 75.1%, and for the floodplain and palm swamp, 81.0%. The terra firme and bamboo were the most similar habitats, as their average dissimilarity was 57.2%. In contrast, both sites were very different from the palm swamp, as the average dissimilarity was 86.7% and 86.2%, respectively.
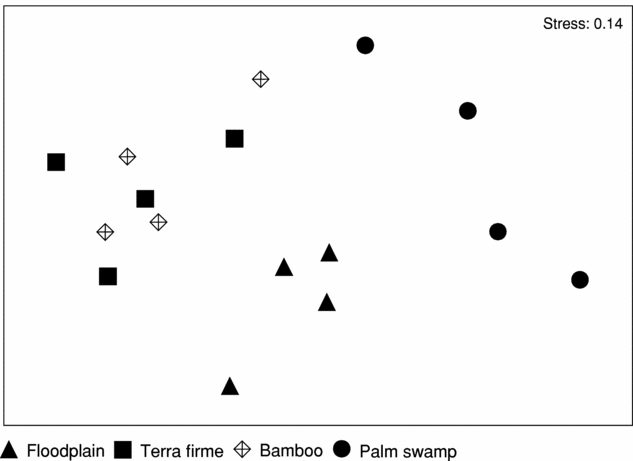
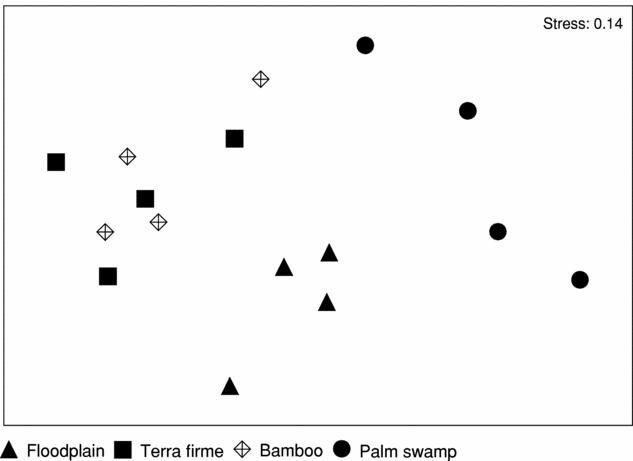
We found that community structure differs across forest types, as both the presence/absence and abundance matrices were effective at discriminating among forest types (Figure 4; only the nMDS plot based on the abundance matrix is shown). When considering abundance data, we found a significant pattern of turnover across forest types (ANOSIM, Global R = 0.524, P = 0.001; Figure 4). In contrast, there was no significant effect of site on assemblage turnover (Global R = 0.055, P = 0.262). Pairwise comparisons indicated that the floodplain differs from the other three forest types and that the palm swamp differs from both the terra firme and bamboo (all comparisons P < 0.029), but that the terra firme and bamboo do not differ from each other (P = 0.629). To verify whether this pattern is maintained in the absence of uncommon species, we repeated the same analyses excluding 16 species represented by singletons and doubletons (Appendix 1). Again, we found a significant pattern of turnover across forest types (ANOSIM, Global R = 0.513, P = 0.001), but no effect of site (Global R = 0.030, P = 0.576).
Non-metric multidimensional scaling plot, four sites (CICRA, CM1, CM2 and TRC), four forest types, wet season 2008. Species abundance data were used for dissimilarity matrix and nMDS plot.
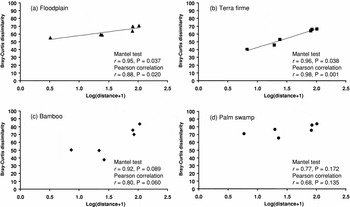
In the Mantel tests, we only found a correlation between assemblage similarities and geographic distance when forest types and abundance data were included in the analyses. First, when forest types were not considered in the analysis, we found no correlation between similarity and geographic distance. The lack of correlation was observed both with presence/absence data (Jaccard similarity index; Mantel test, r = − 0.078, P = 0.255) and abundance data (Bray–Curtis dissimilarity; Mantel test, r = 0.217, P = 0.068). When we conducted the analysis separately for each forest type, but only included presence/absence data, we found no correlation between similarity and geographic distance (Jaccard similarity index; Mantel tests and Pearson correlations, P > 0.05 for each forest type). Only when we conducted the analysis separately for each forest type and included species abundance data, we found a significant correlation between similarity and geographic distance in both floodplain and terra firme (Bray–Curtis dissimilarity; Figure 5a, b). We found no correlation in the bamboo and the palm swamp (Figure 5c, d). However, the trend observed in the bamboo suggests that it would be premature to exclude the possibility that similarity and geographic distance are correlated in this forest type. A linear function best fitted the data in the floodplain (y = 9.85x + 48.0, R 2 = 0.78) and the terra firme (y = 23.7x + 18.8, R 2 = 0.97), where y = Bray–Curtis dissimilarity and x = distance.
Relationship between Bray–Curtis dissimilarity and geographic distance, for all possible pairwise comparisons, analysed separately for each forest type.

DISCUSSION
Our results support the prediction that amphibian species richness, composition and abundance differ across forest types in the heterogeneous landscape of south-eastern Peru. Previous researchers have also shown that forest heterogeneity is important for maintaining amphibian diversity (Ernst & Rödel Reference ERNST and RÖDEL2006, Reference ERNST and RÖDEL2008; Gardner et al. Reference GARDNER, RIBEIRO-JUNIOR, BARLOW, ÁVILA-PIRES, HOOGMOED and PERES2007a), but they often focused on different habitat ‘states’ such as primary and secondary forest. Here, we focused on differences among naturally occurring forest types in a region where patterns of amphibian diversity have not been studied in detail. Our results corroborate some general patterns (e.g. high species diversity in the floodplain; Crump Reference CRUMP1971, Rodríguez Reference RODRÍGUEZ1992) and improve the knowledge of amphibian community structure across other poorly studied habitats, especially bamboo and palm swamp.
We found that a large proportion of amphibian gamma diversity in south-eastern Peru is attributed to habitat-related beta diversity. Although the numerically dominant species may vary across habitats or sites, our results indicate that forest type is more important than site location in predicting both species composition and abundance. The observation that bamboo and terra firme assemblages do not clearly differ from each other (except for a few species; Appendix 1) is not surprising as bamboo habitats are physically nested within a larger land area covered by terra firme. This pattern is consistent with findings by Silman et al. (Reference SILMAN, ANCAYA, BRINSON, Leite, Pitman and Alvarez2003), who demonstrated that plant species composition in bamboo and terra firme in south-eastern Peru are similar to each other. However, more research is needed to make better generalizations about how the bamboo forest differs from terra firme in terms of animal communities.
The patterns of community structure across forest types that we have observed in south-western Amazonia resemble those observed in other tropical regions (Ernst & Rödel Reference ERNST and RÖDEL2005, Reference ERNST and RÖDEL2008; Gardner et al. Reference GARDNER, FITZHERBERT, DREWES, HOWELL and CARO2007b, Watling Reference WATLING2005). For example, East African amphibian assemblages exhibit a significant association with forest types on a similar geographic scale (Gardner et al. Reference GARDNER, FITZHERBERT, DREWES, HOWELL and CARO2007b). Although the number of species recorded in East Africa is much lower than in Amazonia, the patterns observed in both regions suggest that species-sorting across forest types (sensu Leibold et al. Reference LEIBOLD, HOLYOAK, MOUQUET, AMARASEKARE, CHASE, HOOPES, HOLT, SHURIN, LAW, TILMAN, LOREAU and GONZALEZ2004) is important. Our results, and results from the studies cited above, suggest that habitat heterogeneity is important for maintaining phylogenetically distant amphibian faunas.
Perhaps even more remarkable is the similarity of patterns exhibited by the amphibian assemblages in south-eastern Peru with those reported for tree assemblages in the same region (Pitman et al. Reference PITMAN, TERBORGH, SILMAN and NUÑEZ1999). Pitman et al. (Reference PITMAN, TERBORGH, SILMAN and NUÑEZ1999) showed that, for most tree species, habitat preferences are driven by abundance distributions instead of restricted affinity to a given habitat: ‘habitat preferences of Amazonian plants are a matter of degree, and not as strict as suggested by earlier researchers’ (Pitman et al. Reference PITMAN, TERBORGH, SILMAN and NUÑEZ1999: p. 2657). Likewise, most amphibian species we encountered occur in more than one forest type but usually exhibit high abundance in only one forest type. Hence, the results of indicator species analysis should be taken with caution because observing a particular species does not tell observers which forest type they are in. The indicator species analysis can be useful to characterize particular forest types, but it does not imply that those taxa are specialists to those forest types. The only exception might be Ranitomeya biolat, a poison frog that is strongly associated with the bamboo because it is the only anuran in the region that uses bamboo internodes as a reproduction and retreat site (von May et al. Reference VON MAY, MEDINA-MÜLLER, DONNELLY and SUMMERS2009b) and does not successfully breed in other forest types (R. von May, pers. obs.).
We found that, when analyses are conducted separately for each forest type and include species abundance data, similarity between assemblages decreases with increasing geographic distance. Our results stand in contrast to findings by Dahl et al. (Reference DAHL, NOVOTNY, MORAVEC and RICHARDS2009), who did not find a correlation between similarity and distance in south-western Amazonia despite the fact that their sites were separated by up to 400 km. However, Dahl et al. (Reference DAHL, NOVOTNY, MORAVEC and RICHARDS2009) did not standardize their sampling with respect to forest type and did not use abundance data (J. Moravec, pers. comm.). Likewise, we found no correlation between similarity and distance when forest type and abundance data were not included in the analysis. Thus, our results illustrate that abundance data and forest type should always be included in the analysis of amphibian community structure at relatively small regional scales (as small as 100 km in our study). Researchers working in other tropical and subtropical regions (and who included both abundance data and habitat characteristics in their analyses) also found that geographic distance is important for structuring amphibian assemblages (Keller et al. Reference KELLER, RÖDEL, LINSENMAIR and GRAFE2009, Parris Reference PARRIS2004).
The four forest types we studied are relatively discrete in western Amazonia and are, in part, defined by vegetation and different environmental conditions including soil type and flooding regime. Treating each forest type as a separate unit has many advantages and allows researchers to understand which major landscape features influence the structuring of taxonomic assemblages. An alternative method is to analyse the variation of amphibian communities across fine-scaled environmental gradients (e.g. soil type, humidity), with the aim of identifying which habitat characteristics are most relevant for community structure. Preliminary work on this topic has shown that amphibian species may respond individualistically to some substrate characteristics (e.g. soil pH, leaf-litter mass; Menin et al. Reference MENIN, LIMA, MAGNUSSON and WALDEZ2007, Van Sluys et al. Reference VAN SLUYS, VRCIBRADIC, ALVES, BERGALLO and ROCHA2007, R. von May unpubl. data). More research is needed to link environmental gradients with animal diversity patterns in western Amazonia.
In conclusion, evaluating community structure across forest types can improve our understanding of diversity patterns in Amazonian landscapes. At the same time, this type of information can aid in conservation. If different areas are set aside as corridors or small preserves, the inclusion of each forest type will maximize the amount of protected biodiversity in the region. Finally, given that many threatened amphibian species in Peru might be found outside protected areas, more information on species’ habitat requirements is needed to develop strategies for habitat conservation and reserve design.
ACKNOWLEDGEMENTS
We thank Kelsey Reider, Lisseth Flores, Valeriano Quispe, Jerry Martínez, Raúl Thupa, Hernán Collado, Jorge Pérez, Mario Napravnik, Kurt Holle, Jesús Ramos and the staff at CICRA, CM1, CM2 and TRC for help in field work and logistics. We thank Jesús Córdova and César Aguilar for providing access to the herpetological collection in the Museo de Historia Natural Universidad de San Marcos. We thank Nigel Pitman, James Watling, Paul Fine, Alessandro Catenazzi, Evelyn Gaiser, Steve Oberbauer, Kyle Summers, Zhenmin Chen, Vivian Maccachero, Monica Isola, Justin Nowakowski, Robert Hegna, Kelsey Reider, Seiichi Murasaki, Steven Whitfield, Tiffany Doan and two anonymous reviewers for providing constructive comments on the manuscript. We also thank Evelyn Gaiser, Tom Philippi and Zhenmin Chen for providing statistical advice. Collection of data and voucher specimens was authorized by an IACUC permit (Number 05-013) issued by Florida International University (FIU) and collection and export permits issued by the Instituto Nacional de Recursos Naturales (INRENA), Peru (permit numbers 11-2008-INRENA-IFFS-DCB and 09 C/C-2008-INRENA-IANP). We thank Karina Ramírez and Carmen Jaimes for advice with permit applications. Funding for this study was provided by the Amazon Conservation Association, Wildlife Conservation Society, Tinker Foundation, Graduate Student Association and Latin American and Caribbean Center at FIU. RvM thanks FIU's University Graduate School for a Doctoral Year Fellowship. This paper is contribution number 181 to FIU's programme in tropical biology.
Appendices
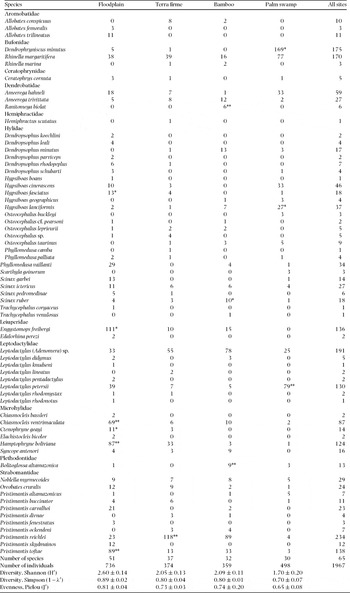
Species of amphibian and number of individuals recorded in each forest type. Data from the four study sites were pooled (N = 20 transects per habitat per site). The asterisk(s) next to the number of individuals denotes that the species could be used as an indicator for that habitat (indicator species analysis: two asterisks, P < 0.05; one asterisk, 0.05 < P < 0.10). Diversity measures (mean ± SE) are included at the bottom of table.