1. Introduction
Drop impact on solids exhibits rich dynamics including deposition (Rioboo, Tropea & Marengo Reference Rioboo, Tropea and Marengo2001), splashing (Rein Reference Rein1993; Roisman et al. Reference Roisman, Prunet-Foch, Tropea and Vignes-Adler2002), rebound (Richard & Quéré Reference Richard and Quéré2000; Richard, Clanet & Quéré Reference Richard, Clanet and Quéré2002; Antonini et al. Reference Antonini, Villa, Bernagozzi, Amirfazli and Marengo2013; Kolinski, Mahadevan & Rubinstein Reference Kolinski, Mahadevan and Rubinstein2014) and bubble entrainment (Thoroddsen et al. Reference Thoroddsen, Etoh, Takehara, Ootsuka and Hatsuki2005). The study of drop impact dates back to Worthington (Reference Worthington1877) and recently its body of literature has undergone rapid growth due to advances in high-speed imaging technology increasing spatial and temporal resolutions associated with rapid contact-line (CL) motions (Versluis Reference Versluis2013; Josserand & Thoroddsen Reference Josserand and Thoroddsen2016; Gelderblom et al. Reference Gelderblom, Visser, Sun and Lohse2017). The understanding of such behaviours is critical for quality control in many industries, such as agricultural crop sprays (Massinon et al. Reference Massinon, De Cock, Forster, Nairn, McCue, Zabkiewicz and Lebeau2017; Mercer, Sweatman & Forster Reference Mercer, Sweatman, Forster and Fitt2010; Delele et al. Reference Delele, Nuyttens, Duga, Ambaw, Lebeau, Nicolai and Verboven2016), inkjet printing (van Dam & Le Clerc Reference van Dam and Le Clerc2004; Karunakaran et al. Reference Karunakaran, Arumugam, Yang, Ge, Khan, Lin and Yang2019; Nayak et al. Reference Nayak, Mohanty, Nayak and Ramadoss2019; van der Meulen et al. Reference van der Meulen, Reinten, Wijshoff, Versluis, Lohse and Steen2020), LEDs (Haverinen, Myllyla & Jabbour Reference Haverinen, Myllyla and Jabbour2010) and circuit boards (Yarin Reference Yarin2006), electroluminescent displays (Kim et al. Reference Kim2015) and thin film transistors (Moonen, Yakimets & Huskens Reference Moonen, Yakimets and Huskens2012; Kang, Lee & Cho Reference Kang, Lee and Cho2013), as well as for the development of technologies such as spray painting (Dalili, Sidawi & Chandra Reference Dalili, Sidawi and Chandra2020), internal combustion engines (Moreira, Moita & Panao Reference Moreira, Moita and Panao2010) and printed solar cells (Sun et al. Reference Sun, Zhang, Liang, Zhang, Chi, Shi and Fang2013; Stüwe et al. Reference Stüwe, Mager, Biro and Korvink2015), to name a few. Our interest is in characterizing the energetics of drop deposition in the capillary-ballistic regime defined by high Reynolds number Re and moderate Weber number We. In this paper, we focus on the energy balance during the fast-time-scale motion of inertial spreading during drop deposition characterizing the CL dissipation, as well as the slow-time-scale dynamics after CL pinning that gives rise to oscillations of the liquid/gas ( $lg$) interface, showing how the post-pinning energy partitions amongst the modal components.
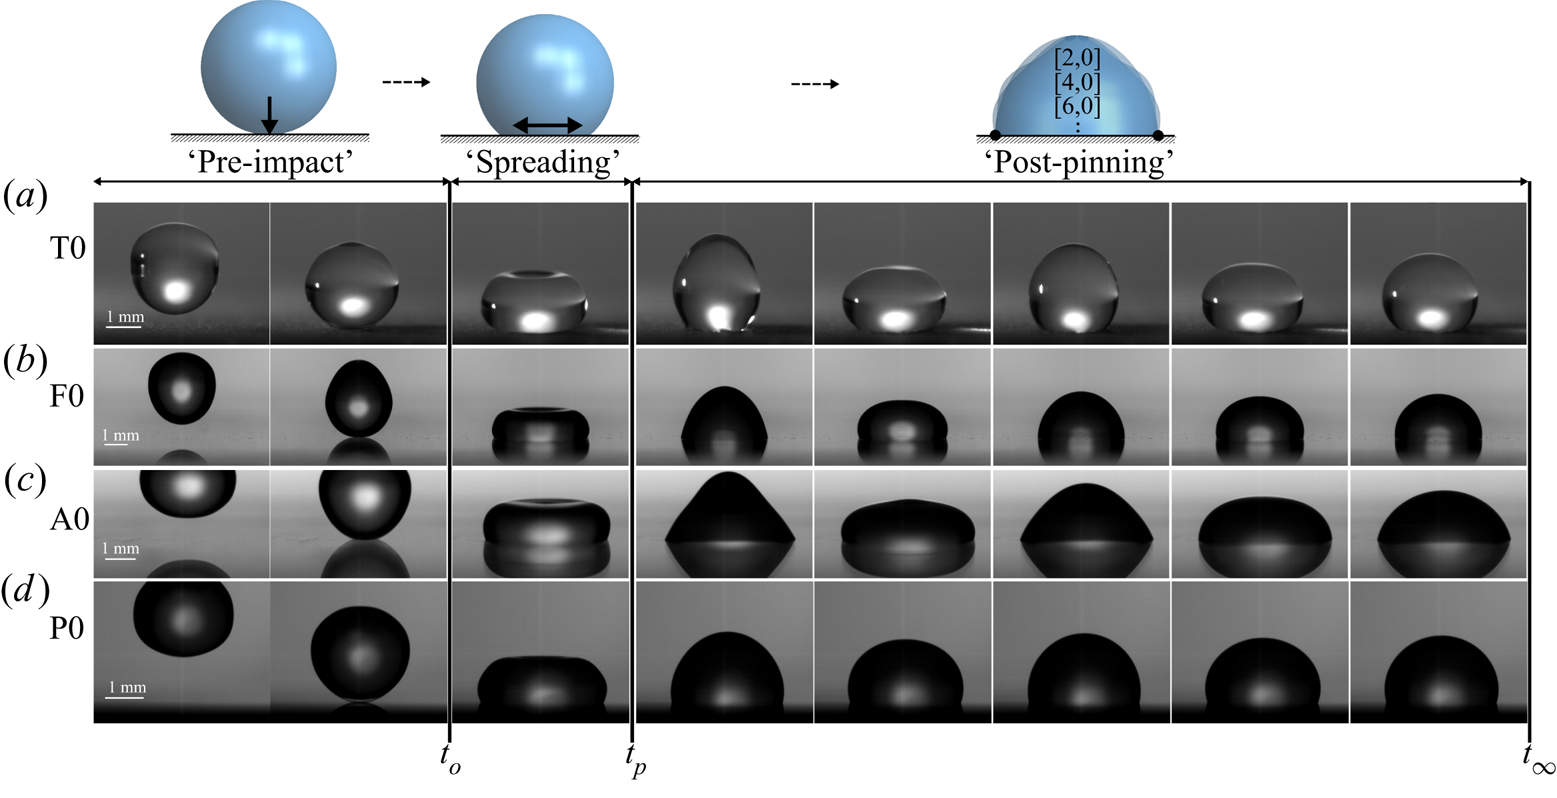
A typical impacting event is shown in figure 1 and can divided into three stages: (i) ‘pre-impact’ defined by a free-falling drop that coalesces with the solid substrate at time  $t_0$, (ii) ‘spreading’ (post-impact) associated with advancing and receding CL motion on the fast time scale after which the CL comes to rest at
 $t_p$ and makes an angle
 $\alpha _p$ with the horizontal and (iii) ‘post-pinning’ of the CL where the liquid/gas (
 $lg$) interface oscillates on the slow time scale dissipating energy through viscous dissipation. Drop impacts are typically defined by the Reynolds number Re and Weber number We. We are interested in capillary-ballistic motions such that
 $ {\textit {Re}}>\sqrt { {\textit {We}}}$. This corresponds to the inertial spreading regime where capillarity is balanced by inertia and is distinguished from most spreading studies, which focus on viscous spreading (Snoeijer & Andreotti Reference Snoeijer and Andreotti2013). We are interested in the energetics of such motions and utilize the analysis of Dussan & Davis (Reference Dussan and Davis1986), who derived an expression for the energetics of dynamic wetting, including dissipation due to bulk viscosity, at the viscous boundary layer, and due to dynamic CL motion.
Overview of an impacting event for water on a solid surface. Time increases left to right. The impacting event can be divided into 3 stages: ‘pre-impact’ ( $t< t_o$), ‘spreading’
 $[t_o,t_p]\approx O(10^{-2})$ and ‘post-pinning’
 $[t_p,t_{\infty }] \approx O(1)$. Panels correspond to prepared surfaces: (a) sanded Teflon, (b) fluorosilane on glass, (c) (3-aminopropyl)triethoxysilane (APTES) on glass, (d) polydimethylsiloxane (PDMS) on silicon.

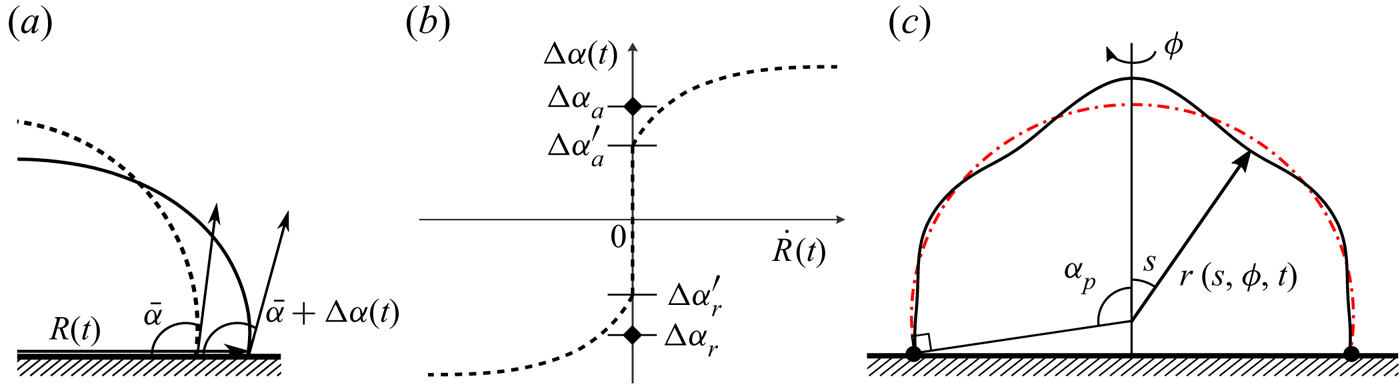
A drop at rest will make an equilibrium angle  $\bar {\alpha }$ defined by the balance of surface energies of the liquid/solid/gas system through the Young–Dupré equation
 $\sigma _{sg}-\sigma _{ls}=\sigma _{lg} \cos \bar {\alpha }$, as shown in figure 2(a). During spreading, the CL radius
 $R$ and contact angle
 $\alpha$ will oscillate about their equilibrium values, where the deviation in angle from equilibrium
 $\Delta \alpha =\alpha -\bar {\alpha }$ is related to the CL speed through the constitutive law shown in figure 2(b). Whenever
 $\Delta \alpha$ lies outside the hysteresis range
 $[\Delta \alpha _a,\Delta \alpha _r]$, motion ensues and energy is dissipated due to the uncompensated Young's CL force, irrespective of the liquid's viscosity. We use the cyclic diagrams
 $\Delta \alpha -R$ proposed by Xia & Steen (Reference Xia and Steen2018) to directly evaluate the CL dissipation (
 $\mathcal {D}_{CL}$), which we show increases with contact-angle hysteresis, and derive a closed-form expression for the post-pinning energy of the system in terms of the equilibrium angle
 $\bar {\alpha }$, hysteresis
 $\Delta \alpha$ and pinning angle
 $\alpha _p$. Our experiments reveal that the post-pinning energy is independent of the pre-impact energy, implying
 $\mathcal {D}_{CL}$ ‘filters’ the pre-impact energy.
Sketch of (a) the CL illustrating the CL radius  $R(t)$ and contact angle
 $\alpha =\bar {\alpha }+\Delta \alpha$ and (b) the dynamic CL law relating the deviation of the contact angle
 $\Delta \alpha$ from its equilibrium value
 $\bar {\alpha }$ to the CL speed
 $\dot {R}$. Here,
 $\Delta \alpha _a$ and
 $\Delta \alpha _r$ are the advancing and receding contact angles and
 $\Delta \alpha _a-\Delta \alpha _r$ is the contact-angle hysteresis. (c) Sketch of the drop's
 $lg$ interface with pinning angle
 $\alpha _p$, adapted from Wesson & Steen (Reference Wesson and Steen2020), illustrating the
 $lg$ interface's radius
 $r$ as a function of the polar angle
 $s$, the azimuthal angle
 $\phi$ and time
 $t$.

In our experiments, inertia dominates the spreading process and the literature is smaller in comparison with viscous-dominated spreading (Scheller & Bousfield Reference Scheller and Bousfield1995; Pasandideh-Fard et al. Reference Pasandideh-Fard, Qiao, Chandra and Mostaghimi1996; Podgorski, Flesselles & Limat Reference Podgorski, Flesselles and Limat2001; Šikalo et al. Reference Šikalo, Marengo, Tropea and Ganić2002; de Gennes, Brochard-Wyart & Quéré Reference de Gennes, Brochard-Wyart and Quéré2004; Yarin Reference Yarin2006; Courbin et al. Reference Courbin, Bird, Reyssat and Stone2009; Winkels et al. Reference Winkels, Peters, Evangelista, Riepen, Daerr, Limat and Snoeijer2011; Manglik et al. Reference Manglik, Jog, Gande and Ravi2013; Ravi, Jog & Manglik Reference Ravi, Jog and Manglik2013; Snoeijer & Andreotti Reference Snoeijer and Andreotti2013). Notable work in the inertial spreading regime includes that of Cox (Reference Cox1998), who used a matched asymptotic analysis to relate the macroscopic contact angle to the CL velocity for small capillary number  $ {\textit {Ca}}\ll 1$ and moderate Reynolds number
 $ {\textit {Re}}\sim 1$, a result which was later confirmed experimentally by Stoev, Ramé & Garoff (Reference Stoev, Ramé and Garoff1999). Later, Biance, Clanet & Quéré (Reference Biance, Clanet and Quéré2004) showed that the initial spreading regime for inviscid liquid drops with small impact velocity scaled with the inertial time scale and demonstrated this by showing impacts on pre-wetted and dry substrates exhibited the same spreading dynamics. This was later confirmed by Bird, Mandre & Stone (Reference Bird, Mandre and Stone2008) who showed that inertial spreading on partially wetting substrates was similar to perfectly wetting substrates and this was verified by Winkels et al. (Reference Winkels, Weijs, Eddi and Snoeijer2012). Numerical simulations of inertial spreading have been performed by Ding & Spelt (Reference Ding and Spelt2007) using direct integration and level-set techniques. Legendre & Maglio (Reference Legendre and Maglio2013) have shown numerically that inertial spreading scales as
 $t^{1/2}$ before transitioning to the viscous-dominated Tanner's law
 $t^{1/10}$. Furthermore, Carlson, Bellani & Amberg (Reference Carlson, Bellani and Amberg2012) showed that when CL friction dominates spreading, a universal spreading behaviour exists irrespective of viscosity. More recently, Gordillo, Riboux & Quintero (Reference Gordillo, Riboux and Quintero2019) derived an analytical expression for the time evolution of the position and thickness of the rim of the drop for inertial motions during splashing.
The maximum extent of spreading during drop deposition has been a focus of prior studies. Cheng (Reference Cheng1977) derived one of the first models to predict the extent of spreading during impact and this basic study has been extended by many others focused on viscous spreading (Snoeijer & Andreotti Reference Snoeijer and Andreotti2013). Of note is the work of Ukiwe & Kwok (Reference Ukiwe and Kwok2005), who have compared numerous models for the maximum spreading extent to experimental observations of drop impact onto surfaces with varying wettability. Our experiments are also focused on the wetting properties of rigid surfaces through the equilibrium angle  $\bar {\alpha }$, as well as the hysteresis
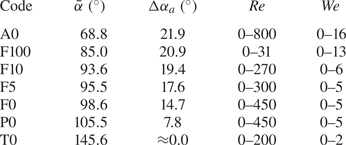
 $\Delta \alpha$. Different wetting properties are achieved through chemical surface treatment of multiple materials yielding a range of
 $\bar {\alpha }\in [68.8^{\circ },105.5^{\circ }]$ and
 $\Delta \alpha \in [7.8^{\circ },21.9^{\circ }]$ close to the neutrally wetting
 $\bar {\alpha }=90^{\circ }$ case. We note that wetting properties of surfaces can also be affected by the introduction of geometric micro-patterning (Bhushan, Jung & Nosonovsky Reference Bhushan, Jung and Nosonovsky2010), but these modifications are not our focus.
Our work concerns complex CL dynamics including stick-slip motions over multiple advancing and receding cycles, which are intimately related to the contact-angle hysteresis. Noblin, Buguin & Brochard-Wyart (Reference Noblin, Buguin and Brochard-Wyart2004) investigated the transition from pinned to mobile CLs in mechanically vibrated liquid puddles showing that frequencies close to resonance can influence CL depinning and the onset of CL motion. Here, contact-angle hysteresis must be overcome to induce motion. In fact, it has been shown that a drop can climb a vertically vibrated inclined surface against the force of gravity in such situations (Brunet, Eggers & Deegan Reference Brunet, Eggers and Deegan2007; Benilov & Billingham Reference Benilov and Billingham2011; Bradshaw & Billingham Reference Bradshaw and Billingham2018). For our prepared substrates, we report the hysteresis value from the goniometer. Depending on the method of measuring the contact-angle hysteresis (e.g. immobile to mobile as by a goniometer or mobile to rest as for vibration experiments Xia & Steen Reference Xia and Steen2018), a disagreement between the measured values may occur, but the existence of contact-angle hysteresis is not disputed (Dussan Reference Dussan1979).
CL pinning is defined as the instant in time  $t_p$ when the CL comes to rest and makes a rest angle
 $\alpha _p$ with the substrate, as shown in figures 1 and 2, and is preceded by the inertial spreading regime. Here, oscillations of the
 $lg$ interface viscously dissipate energy on the slow time scale. We find that these motions can be understood from the theory of sessile drop oscillations by Bostwick & Steen (Reference Bostwick and Steen2014) and corresponding experiments using mechanical excitation (Chang et al. Reference Chang, Bostwick, Daniel and Steen2015). We adopt the same nomenclature for the modal structure
 $[k,l]$ of interface deformation, where
 $k$ is the polar wavenumber and
 $l$ the azimuthal wavenumber. The solution for the interface shape can be written as
 \begin{equation} r(s,\phi,t) = \csc{(\alpha_p)} + \epsilon\psi(s)\cos{(l\phi)}\cos{(\varOmega t)}, \end{equation}
where lengths have been scaled by the footprint radius. Here,  $\csc \alpha _p$ is the radius of the unperturbed drop,
 $\epsilon$ the perturbation amplitude,
 $s$ the polar angle,
 $\phi$ the azimuthal angle,
 $\varOmega$ the eigenfrequency and
 $\psi$ the eigenmode with pinned CL
 $\psi (\alpha _p)=0$ and rest angle
 $\alpha _p$ associated with the
 $[k,l]$ mode (cf. figure 2c). In our experiments, we only observe the axisymmetric
 $l=0$ modes (cf. figure 8), allowing for the simplification
 $r=r(s,t)$. We did not observe modal coexistence as described by Brunet & Snoeijer (Reference Brunet and Snoeijer2011) for liquid puddles and Bostwick & Steen (Reference Bostwick and Steen2016) for sessile drops. For axisymmetric motions, the liquid/gas wave dynamics can be described by the deformation of the drop's north pole
 $r(s=0)$. Here, we take a fast Fourier transform (FFT) to identify the frequencies excited by the impacting event. The observed resonance frequencies agree well with theory over a large range of contact angles and are independent of the pre-impact energy. This important observation justifies our decomposition of the interfacial energy into modal components for use in quantifying the post-pinning energy, and we find that the energy partitioning between the modes remains essentially constant for low-hysteresis surfaces.
Sessile drop theory can be viewed as a symmetry-breaking extension to the Rayleigh drop spectrum by accounting for wetting properties of the solid surface through the static contact angle and CL mobility (Bostwick & Steen Reference Bostwick and Steen2014). The Rayleigh (Reference Rayleigh1879) spectrum for the free drop is given by
 \begin{equation} \frac{\rho \omega^{2} R^{3}}{\sigma}=k(k-1)(k+2), \end{equation}
with  $\rho$ the fluid density,
 $\omega$ the frequency of oscillation,
 $R$ the equilibrium drop radius and
 $\sigma$ the surface tension, and has been verified experimentally (Trinh & Wang Reference Trinh and Wang1982; Wang, Anilkumar & Lee Reference Wang, Anilkumar and Lee1996). The corresponding mode shape for the free drop is given by the spherical harmonic
 $Y_k^{l}(\theta ,\varphi )$ and described by the mode number pair
 $[k,l]$ (MacRobert Reference MacRobert1967). Extensions to (1.2) have been made to account for viscous effects (Reid Reference Reid1960; Miller & Scriven Reference Miller and Scriven1968; Prosperetti et al. Reference Prosperetti1980), large-amplitude deformation (Tsamopoulos & Brown Reference Tsamopoulos and Brown1983; Lundgren & Mansour Reference Lundgren and Mansour1988) and constrained geometries (Strani & Sabetta Reference Strani and Sabetta1984; Bostwick & Steen Reference Bostwick and Steen2009; Ramalingam & Basaran Reference Ramalingam and Basaran2010; Bostwick & Steen Reference Bostwick and Steen2013a). For the sessile drop, symmetry considerations restrict mode numbers
 $k+l-\textrm {even}$ and break the degeneracy of the free drop spectrum to the azimuthal mode number
 $l$, such that each sessile drop mode of vibration has a unique resonance frequency. This has been observed experimentally by Chang et al. (Reference Chang, Bostwick, Steen and Daniel2013, Reference Chang, Bostwick, Daniel and Steen2015) and an organizing principle for the sessile drop spectrum has been developed resulting in the ‘periodic table of droplet motions’ (Steen, Chang & Bostwick Reference Steen, Chang and Bostwick2019).
Drop oscillations can be realized experimentally through a number of mechanisms including electrowetting (Mampallil et al. Reference Mampallil, Eral, Staicu, Mugele and van den Ende2013), surface acoustic waves (Baudoin et al. Reference Baudoin, Brunet, Bou Matar and Herth2012), air jets (Deepu, Basu & Kumar Reference Deepu, Basu and Kumar2014), mechanical vibration (Vukasinovic, Smith & Glezer Reference Vukasinovic, Smith and Glezer2007) and pressure excitation (Tilger, Olles & Hirsa Reference Tilger, Olles and Hirsa2013). For these forced oscillations, energy is continuously injected into the drop and resonance occurs whenever the applied frequency is equal to one of the drop's natural frequencies. In our experiments, drop oscillations originate from the impacting event and associated pre-impact energy. This is a free oscillation problem in which the interface is disturbed from equilibrium and released, resulting in under-damped motions. The interfacial energy associated with these complex motions can be faithfully computed using the predicted mode shapes from sessile drop theory as a basis to construct the interface shape. This allows us to do the proper energy accounting for the drop motion during post-pinning. In this paper we detail the procedure to infer the CL dissipation from the difference between pre-impact and post-pinning energies. In addition, we show how the modal decomposition of post-pinning energy depends upon the contact-angle hysteresis.
During post-pinning, viscous dissipation causes the  $lg$ oscillations to be underdamped with decay rate
 $\gamma _{[k,l]}$ associated with the
 $[k,l]$ mode. We determine these
 $\gamma _{[k,l]}$ experimentally from FFTs. Our measured decay rates show reasonable agreement with predictions for free drops by Lamb (Reference Lamb1932) and Miller & Scriven (Reference Miller and Scriven1968), but are under-predicted. This could be due to (i) the assumption of irrotational motion by Lamb (Reference Lamb1932) and corresponding first-order correction by Miller & Scriven (Reference Miller and Scriven1968), (ii) the added effect of the viscous boundary layer Dussan & Davis (Reference Dussan and Davis1986) and (iii) the effect of the pinned CL. It is well known that pinning constrains the
 $lg$ motion causing an increase in frequency and higher curvature of the
 $lg$ interface, consequently increasing viscous dissipation. Rotational effects to the velocity field also play a role in the decay rate (Prosperetti Reference Prosperetti1980; Bostwick & Steen Reference Bostwick and Steen2013b).
We begin this paper by describing the experimental set-up and imaging techniques to describe the impact event in § 2. A derivation of the energy balance within the context of our experimental results is presented in § 3. The pre-impact and post-pinning energies are defined and we show how the difference between the two are related to CL dissipation, as interpreted by the cyclic  $\Delta \alpha -R$ diagram. The post-pinning energy is independent of the initial kinetic energy and we derive an expression for it using experimental observations from the cyclic diagram. In § 4 we discuss the dissipation during the inertial ‘spreading’ regime. In § 5 we report the frequency spectrum for the impacting event from FFTs, modal decay rates from FFT analysis and post-pinning energy as it partitions into modal components. Each reported quantity is independent of the pre-impact energy. We compare the post-pinning energy computed directly from the CL dynamics and indirectly from the modal decomposition of
 $lg$ oscillations in § 6. The agreement between our experimental results and predictions are excellent. Lastly, we offer some concluding remarks in § 7 to contextualize our results.
2. Experiment
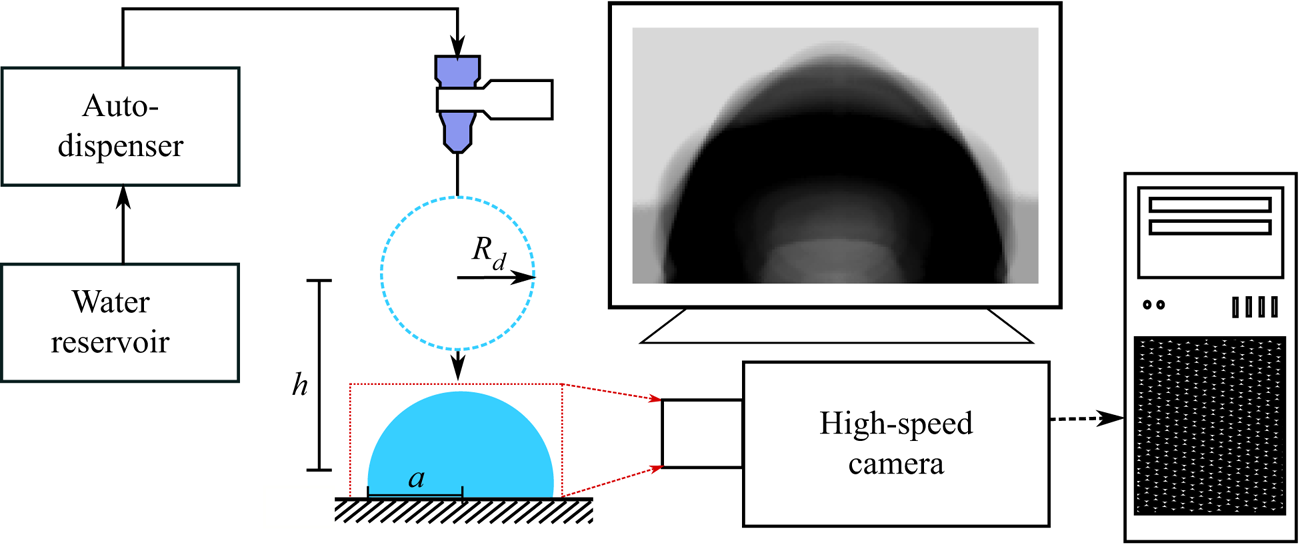
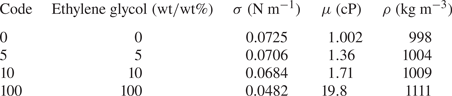
Experiments were performed using the set-up shown in figure 3. Drops were formed using a Ramé–Hart auto-dispensing system to pump water/glycol solutions through a syringe tip at a flow rate of  $1.0\ \mathrm {\mu }\textrm {l}\ \textrm {s}^{-1}$. Water/glycol solutions were chosen to span a range of viscosities
 $\mu$ with similar surface tensions
 $\sigma$ and densities
 $\rho$, as shown in table 1. Multiple syringe tips of gauges 22–30 (inner diameter, 0.41–0.16 mm) were used to control the drop's volume
 $V=4/3{\rm \pi} R_d^{3}$ to
 $\pm 0.1\ \mathrm {\mu }\textrm {l}$, where
 $R_d$ is the drop radius. The drop formed was allowed to freely break from the syringe tip due to gravity, which caused oscillations on the drop's liquid/gas interface that were damped out before impact. The drop's pre-impact kinetic energy,
 $K_o = (\rho V u_o^{2})/2$, was controlled by adjusting the height
 $h$ between the syringe tip and the substrate. The drop impacted a prepared surface described in table 2 with velocity
 $u_o=\sqrt {2 g h}$. These capillary-ballistic impacts are characterized by moderate Reynolds number Re and low Weber number We with
 \begin{equation} {\textit{We}} = \frac{\rho {u_o}^{2}D_d}{\sigma} = \frac{4\rho ghR_d}{\sigma}, \quad {\textit{Re}} = \frac{\rho u_o D_d}{\mu} = \frac{2\rho R_d\sqrt{2gh}}{\mu}, \end{equation}
where  $\rho$ is the density,
 $D_d$ the diameter,
 $R_d$ the radius,
 $u_o$ the impact velocity,
 $\sigma$ the surface tension,
 $\mu$ the dynamic viscosity of the drop,
 $g$ gravity and
 $h$ the distance between the centre of mass of the drop as it detaches from the syringe tip and the centre of mass of the drop once it comes to rest on the surface. The range of experimental conditions encompassed the case where the drop just touched the surface to just before partial rebound or drop ejection, as shown in table 3.
Water/glycol drops of radius  $R_d$ are generated from an auto-dispensing system with a low flow rate of
 $1\ \mathrm {\mu }\textrm {l}\ \textrm {s}^{-1}$ at a height
 $h$ above the substrate. Different gauge syringe tips control the drop volume and the impacting event is quantified using high-speed photography. Post CL pinning, the drop has a footprint radius
 $a$. The over-exposed image shown illustrates the observed vibrations.

Liquid properties. Surface tension  $\sigma$, viscosity
 $\mu$ and density
 $\rho$ for water/glycol mixtures;
 $\sigma$ and
 $\mu$ from Horibe, Fukusako & Yamada (Reference Horibe, Fukusako and Yamada1996).

Substrate identification system.

Wetting properties of liquid/solid systems defined by the equilibrium contact angle  $\bar {\alpha }$ and contact-angle hysteresis
 $\Delta \alpha _a$ as measured by a goniometer with corresponding range of experimental parameters Re and We.

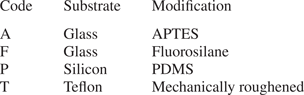
Four different substrate preparations were chosen, a hydrophilic (3-aminopropyl)triethoxysilane (APTES) on glass, a hydrophobic fluorosilane on glass, a low-hysteresis hydrophobic polydimethylsiloxane (PDMS) on silicon and a superhydrophobic mechanically roughened Teflon as identified in table 2. Surface preparation details are described in § A.2. These liquid/solid systems were chosen to explore a range of contact-angle hystereses  $\Delta \alpha _a=\alpha _a-\bar {\alpha }$ and equilibrium contact angles
 $\bar {\alpha }$ near neutral wetting, as measured using a Ramé–Hart goniometer. Table 3 summarizes these wetting properties.
The impacting event and associated dynamics were recorded at a frame rate of at least 5000 f.p.s. using a Redlake MotionXtra HG-XL high-speed camera. Figure 1 shows a typical experiment, included in the data set, that is divided into 3 stages: ‘pre-impact’, ‘spreading’ and ‘post-pinning’, separated by two times,  $t_o$ and
 $t_p$. Here,
 $t_o$ is defined as the instant the drop touches the surface and
 $t_p$ as the instant when the CL comes to its final rest position on the surface. A final time
 $t_{\infty }$ is defined as the time the drop's
 $lg$ interface comes to rest. Our study focuses on (i) spreading in the time interval
 $[t_o,t_p]$, and (ii) the energetics of the
 $lg$ interfacial vibrations during post-pinning in the time interval
 $[t_p,t_{\infty }]$.
3. Energy analysis
Observables from the experiment are the time-varying contact angle (CA)  $\alpha (t)$ and position of the CL
 $R(t)$ herein denoted
 $\varGamma$. We note that the CL spreads with radial symmetry, that is, with a circular shape for normal drop impact onto a homogeneous surface with modest pre-impact energy. It is convenient to report the CA relative to a reference value
 $\bar {\alpha }$,
 $\Delta \alpha \equiv \alpha - \bar {\alpha }$. This value can be thought of as the static CA measured separately by a goniometer.
The uncompensated Young's force acting along  $\varGamma$ is defined as
 \begin{equation} \mathcal{F_Y} \equiv{-}\sigma \left(\cos{\left(\Delta\alpha + \bar{\alpha}\right)}-\cos{\bar{\alpha}}\right), \end{equation}
where  $\sigma$ is the
 $lg$ surface tension. CL dissipation
 $\mathcal {D}_{CL}$ is the unrecoverable rate of work done along the CL (Dussan Reference Dussan1979),
 \begin{equation} \mathcal{D}_{CL} \equiv \oint_{\varGamma} \mathcal{F}_{\mathcal{Y}} \dot{R} \,\mathrm{d}l. \end{equation}
In what follows, we discuss the energy quantification during the different stages of impact: ‘pre-impact’, ‘spreading’ and ‘post-pinning’. First, our discussion will focus on post-pinning and understanding the modal decomposition of the drop's post-pinning energy. Next, we will focus on the filtering effect CL spreading has on the pre-impact energy, and understanding how the energy dissipated during spreading can lead to predictions of the drop's post-pinning energy a priori to impact.
3.1. Energy formulation and mobility of the CL
Our discussion about CL dissipation is framed around the mechanical energy balance for dynamic wetting (Dussan & Davis Reference Dussan and Davis1986, (2.7)), with modified notation,
 \begin{equation} \frac{\mathrm{d} }{\mathrm{d} t}\left(K+\mathcal{A}\right)={-}\int_V \operatorname{Tr}\left(\boldsymbol{\mathsf{T}}\boldsymbol{\cdot} \boldsymbol{\mathsf{D}}\right)\mathrm{d}V +2\mu \oint_{\varGamma} \frac{\dot{R}^{2} \sin{\alpha}^{2}}{\alpha - \sin{\alpha}\cos{\alpha}}\, \mathrm{d}l - \mathcal{D}_{CL}.\end{equation}
The first term on the right-hand side represents the bulk dissipation of the system, with  $\boldsymbol{\mathsf{T}}$ being the Cauchy stress tensor and
 $\boldsymbol{\mathsf{D}}$ the deformation tensor. The second term represents dissipation in the viscous boundary layer integrated about the CL, where
 $\mu$ is the bulk viscosity,
 $\dot {R}$ the CL velocity and
 $\alpha = \bar {\alpha }+\Delta \alpha$. The third term represents dissipation from work done at the moving CL.
The kinetic energy associated with the velocity field  $\boldsymbol{\mathsf{u}}$ is defined as
 \begin{equation} K=\tfrac{1}{2}\int_V \rho\boldsymbol{\mathsf{u}}^{2}\,\mathrm{d}V,\end{equation}
and the surface energy as
 \begin{equation} \mathcal{A}=\sigma A_{lg}+\sigma_{ls} A_{ls}+ \sigma_{sg} A_{sg}, \end{equation}
which is the sum of the interfacial areas  $A$ weighted by the associated surface tensions
 $\sigma$. The subscripts
 $lg$,
 $ls$ and
 $sg$ denote liquid/gas, liquid/solid and solid/gas, respectively.
Applying the Young–Dupré equation  $\sigma _{sg}-\sigma _{ls}=\sigma _{lg} \cos \bar {\alpha }$ and noting that
 ${\mathrm {d} }/{\mathrm {d} t}(A_{sg}+A_{ls})=0$, one can reduce (3.5) to
 \begin{equation} \mathcal{A}=\sigma ( A_{lg}- \cos{\bar{\alpha}} \,A_{ls}).\end{equation}
Note that the same result would be reached by assuming  $\sigma _{sg}=0$, as per Horibe et al. (Reference Horibe, Fukusako and Yamada1996). Alternatively, the effective interfacial area can also be defined as
 \begin{equation} \mathcal{A} \equiv \sigma( A_{lg}-\mathcal{M} A_{ls}) \end{equation}
where the wettability parameter is defined as  $\mathcal {M} \equiv (\sigma _{sg}-\sigma _{ls})/\sigma$. If material properties are such that
 $\mathcal {M}$ falls outside
 $(-1,1)$, the liquid completely dewets (
 $\mathcal {M} < -1$) or wets (
 $1 < \mathcal {M}$) the solid. Otherwise, the liquid is partially non-wetting (
 $-1 < \mathcal {M}<0$) or partially wetting (
 $0 < \mathcal {M}<1$). Equilibrium requires
 $\mathcal {M} = \cos {\bar {\alpha }}$ (Bangham & Razouk Reference Bangham and Razouk1937), known as the Young–Dupré equation, thus relating (3.5) to (3.6). Hence, partially wetting and partially non-wetting can be distinguished by the neutrally wetting case,
 $\bar {\alpha } = 90 ^{\circ }$ (
 $\mathcal {M}=0$). Our primary interest is in partially wetting and partially non-wetting systems with
 $\bar {\alpha }$ not too far from
 $90 ^{\circ }$.
3.2. Inertial spreading ‘fast time scale’
Dissipation during impact occurs across two different time scales. The first is the fast time scale associated with spreading in the interval  $[t_o,t_p]$, which is approximately
 $O(10^{-2})$. For normal impact onto a homogeneous surface, we observe that CL spreading is azimuthally uniform such that
 $\mathrm {d}l=R\,\mathrm {d}\phi$. The liquids used in our experiments are relatively inviscid,
 $\mu \ll 1$, and we assume that liquid away from the CL does no work on the substrate, a situation which would be obtained if the no-slip condition were respected. These assumptions are rationalized by noting the small capillary numbers
 $ {\textit {Ca}}= {\textit {We}}/ {\textit {Re}}=0.01 - 0.04$ used in the experiments and validated by evaluating the dissipation in the viscous boundary layer using experimental data (a dominant balance argument). Together, these assumptions justify the neglect of the first two terms on the right-hand side of (3.3), which leaves after integration
 \begin{equation} \{K+\mathcal{A}\}_{o}-\{K+\mathcal{A}\}_{p}=\int_{t_o}^{t_p} 2{\rm \pi} R\dot{R}\mathcal{F_Y} \,\mathrm{d}t, \end{equation}
where  $\{K+\mathcal {A}\}_{o}$ denotes the drop's pre-impact energy and
 $\{K+\mathcal {A}\}_{p}$ the drop's post-pinning energy. The right-hand side of (3.8) represents the energy dissipated at the CL during spreading. Implications from (3.8) are that the only form of dissipation in the system during spreading is from the work done by the CL as it moves along the surface, consistent with Carlson et al. (Reference Carlson, Bellani and Amberg2012) and Xia & Steen (Reference Xia and Steen2018).
3.3. Viscous dissipation ‘slow time scale’
The second time scale is the slow time scale during post-pinning in the interval  $[t_p,t_{\infty }]$, which is approximately
 $O(1)$. Here, viscous dissipation dominates and integrating the energy balance over
 $[t_p,t_{\infty }]$ yields
 \begin{equation} \{K+\mathcal{A}\}_{\infty}-\{K+\mathcal{A}\}_{p}=\int_{t_p}^{t_{\infty}} \mathcal{D}_{bulk} \,\mathrm{d}t, \quad \mathcal{D}_{bulk} \equiv{-}\int_V \textrm{tr}\left(\boldsymbol{\mathsf{T}}\boldsymbol{\cdot}\boldsymbol{\mathsf{D}}\right)\mathrm{d}V, \end{equation}
showing that the viscous dissipation  $\mathcal {D}_{bulk}$ is effectively decoupled from CL dissipation
 $\mathcal {D}_{CL}$ during post-pinning. Here,
 $\{K+\mathcal {A}\}_{p}$ denotes the post-pinning energy,
 $\{K+\mathcal {A}\}_{\infty }$ the final resting energy,
 $t_p$ the instant the CL comes to rest and
 $t_{\infty }$ the instant when the post-pinning
 $lg$ vibrations have come to rest.
3.4. ‘Pre-impact’ energy
Quantification of the drop's pre-impact energy  $\{K+\mathcal {A}\}_{o}$ is the first step in discussing the energetics of impact. To quantify
 $\{K+\mathcal {A}\}_{o}$, we assume that the drop is a sphere with some impacting velocity inferred from the fall height. Then we can write
 \begin{equation} \{K+\mathcal{A}\}_{o}=\{\rho Vgh+4{\rm \pi}\sigma R_d^{2}\}, \end{equation}
where the height  $h$ is measured in the laboratory frame. The volume
 $V$ and radius
 $R_d$ are controlled by the gauge of the syringe tip. Alternatively, the pre-impact energy can be written as
 \begin{equation} \{K+\mathcal{A}\}_{o}=\left\{\tfrac{1}{2}\rho Vu_o^{2}+4{\rm \pi}\sigma R_d^{2}\right\},\end{equation}
where the impact velocity,  $u_o$, is measured directly from the experimental images using MATLAB to track the drop's centre of mass. The variation between these two methods of measurement was on average
 ${<}5\,\%$. Hereafter, all calculations were performed using (3.11).
We assume based on observation that the surface energy contribution of the capillary waves generated when the drop breaks off the needle tip can be ignored. At higher impacting velocities these waves are sufficiently damped out before impact, and at lower impacting velocities the contribution to the overall surface energy remained negligible. Similarly we ignored oblate–prolate vibration of the drop prior to impact, a phenomenon shown to be important for vorticity generation during impact (Peck & Sigurdson Reference Peck and Sigurdson1994).
3.5. ‘Post-pinning’ energy
The post-pinning energy  $\{K+\mathcal {A}\}_{p}$ at the instant of pinning
 $t=t_p$ is defined as
 \begin{equation} \{K+\mathcal{A}\}_{p}=\tfrac{1}{2}\int_V \rho\boldsymbol{\mathsf{u}}^{2}\,\mathrm{d}V+\sigma\left( A_{lg} - A_{ls}\cos{\left(\alpha_p\right)}\right),\end{equation}
which is the sum of the drop's kinetic and interfacial energies. In order to calculate  $\{K+\mathcal {A}\}_{p}$ from experimental images, it would be helpful to simplify (3.12) to avoid calculating the velocity field
 $\boldsymbol{\mathsf{u}}$ in the entire drop domain. We assume an incompressible
 $\boldsymbol {\nabla }\boldsymbol {\cdot }\boldsymbol{\mathsf{u}}=0$ and irrotational potential flow
 $\boldsymbol{\mathsf{u}}=\boldsymbol {\nabla }\varPsi$ and use the identity
 $\boldsymbol {\nabla } \boldsymbol {\cdot } (\varPsi \boldsymbol{\mathsf{u}}) = \boldsymbol {\nabla }\varPsi \boldsymbol {\cdot }\boldsymbol{\mathsf{u}} + \varPsi \boldsymbol {\nabla }\boldsymbol {\cdot }\boldsymbol{\mathsf{u}}$ to rewrite (3.12) as
 \begin{equation} \{K+\mathcal{A}\}_{p}=\frac{\rho}{2}\int_V(\boldsymbol{\nabla}\varPsi\boldsymbol{\cdot}\boldsymbol{\mathsf{u}}+\varPsi \boldsymbol{\nabla}\boldsymbol{\cdot}\boldsymbol{\mathsf{u}})\,\mathrm{d}V +\sigma\left( A_{lg} - A_{ls}\cos{\left(\alpha_p\right)}\right).\end{equation}
Application of Green's identity  $\int _V{(\boldsymbol {\nabla }\varPsi \boldsymbol {\cdot } \boldsymbol {\nabla } \varPsi + \varPsi \nabla ^{2}\varPsi )}\,\mathrm {d}V = \int _{\partial V}{\varPsi (\boldsymbol {\nabla }\varPsi \boldsymbol {\cdot }\boldsymbol {n})}\,\mathrm {d}S$ and noting that
 $\nabla ^{2}\varPsi =0$ for incompressible flows allows us to rewrite (3.13) as
 \begin{equation} \{K+\mathcal{A}\}_{p}=\frac{\rho}{2}\int_S \varPsi \frac{\mathrm{d}\varPsi}{\mathrm{d}\textrm{n}} \mathrm{d}S +\sigma\left( A_{lg} - A_{ls}\cos{\left(\alpha_p\right)}\right).\end{equation}
This is a boundary integral approach. Here,  ${\boldsymbol {n}}$ is the unit outward normal to the liquid/gas interface, which we can identify with the radial coordinate
 $r$ defined in the spherical coordinate system shown in figure 2(c). For small interface disturbances,
 $\varPsi \approx r\,\mathrm {d}\varPsi /\mathrm {d}r\equiv r u_r$ at the
 $lg$ boundary and we can write (3.14) as
 \begin{equation} \{K+\mathcal{A}\}_{p}=\frac{\rho}{2}\int_0^{2{\rm \pi}}\int_{\theta_0}^{\rm \pi} u_r^{2}r^{3}\sin{(\theta)} \,\mathrm{d}\theta\,\mathrm{d}\phi +\sigma\left( A_{lg} - A_{ls}\cos{\left(\alpha_p\right)}\right),\end{equation}
which can be evaluated directly from the side view experimental images, as shown in figure 1.
4. Dissipation during ‘spreading’
4.1. Perfectly slipping CL
This important special case will aid in our interpretation of the experimental results. Models of CL response relate  $\Delta \alpha$ to CL speed, sometimes denoted
 $U$, where
 $U=\dot {R}$ in this study. One of the simplest of models of CL response is ‘perfect slip’, where the CL moves at constant CA independent of
 $\dot {R}$,
 \begin{equation} \alpha =\begin{cases} \alpha_A & \text{for} \ \dot{R} > 0 \\ \alpha_R & \text{for} \ \dot{R} < 0. \end{cases} \end{equation}
Here,  $\alpha _A$ and
 $\alpha _R$ are the advancing and receding CAs. Along both the advancing and receding slip legs, the driving forces
 $\mathcal {F}_{\mathcal {Y}A}$ and
 $\mathcal {F}_{\mathcal {Y}R}$ are constant,
 \begin{gather} \mathcal{F}_{\mathcal{Y}A} \equiv{-}\sigma \left(\cos{\alpha_A}-\cos{\bar{\alpha}}\right)\quad \text{for}\ \dot{R} > 0, \end{gather}
 \begin{gather}\mathcal{F}_{\mathcal{Y}R} \equiv{-}\sigma \left(\cos{\alpha_R}-\cos{\bar{\alpha}}\right)\quad \text{for}\ \dot{R} < 0. \end{gather}
An immediate consequence is that the right-hand side of (3.8) can be integrated along either leg (advancing here),
 \begin{equation} \left.\{K+\mathcal{A}\}\right\vert_{t_0}^{t_p}= \left.({\rm \pi} R^{2} \mathcal{F}_{\mathcal{Y}A}) \right\vert_{t_0}^{t_p}. \end{equation}
Noting that  $({\rm \pi} R^{2})\vert _{t_0}^{t_p} = A_{ls} \vert _{t_0}^{t_p}$ and that
 $\mathcal {F}_{\mathcal {Y}A}/\sigma = \mathcal {M} - \mathcal {M_A}$, one can rearrange (4.4) into the form,
 \begin{equation} \left.\{ K+(\mathcal{A}_{lg}- \mathcal{M}_{\mathcal{A}} \mathcal{A}_{ls})\}\right\vert_{t_0}^{t_p}=0. \end{equation}
This striking result says that the loss of kinetic energy along a slip leg precisely equals the change in interfacial energy that would occur as if on a surface with wettability  $\mathcal {M}_{\mathcal {A}}$.
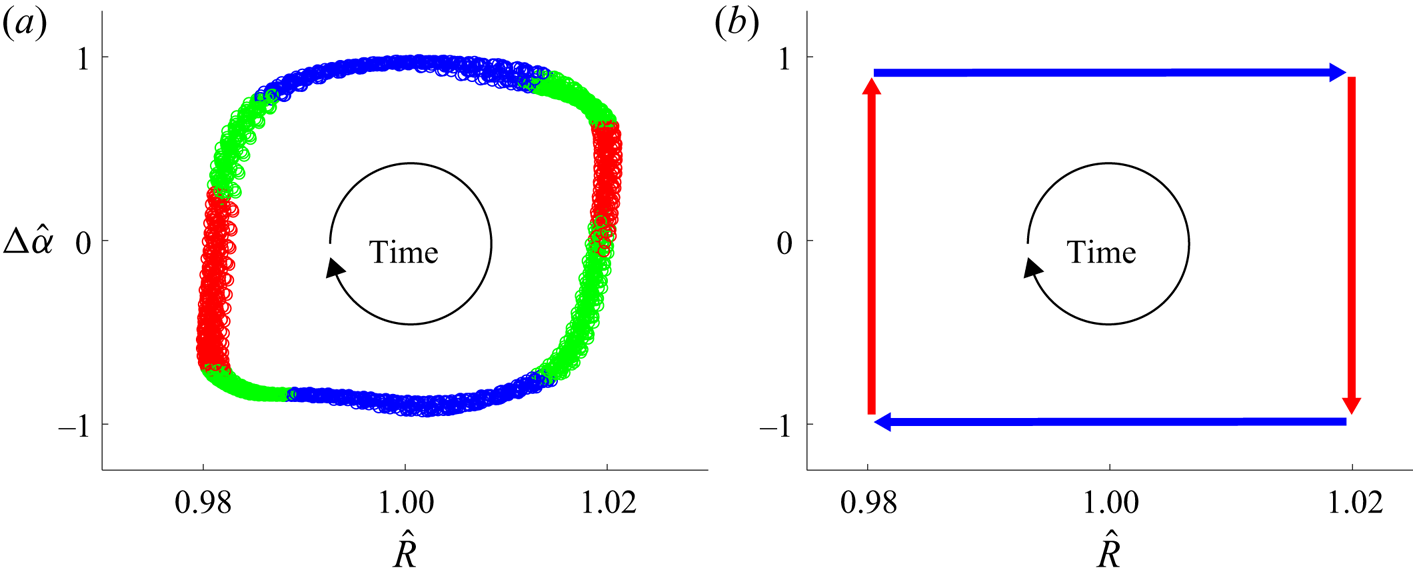
Graphically, we can realize the result of (4.5) by looking at the cyclic driving diagram for a P0 surface with a given wettability,  $\mathcal {M_A}$, shown in figure 4. In figure 4(a), we see the results for a P0 surface driven from below at the
 $[2,0]$ resonance mode frequency, nomenclature from Bostwick & Steen (Reference Bostwick and Steen2014) and experimental procedure from Xia & Steen (Reference Xia and Steen2018). The resonant response of the drop causes CL motion. The blue data represent ‘slip’ for
 $\mathcal {F}_{\mathcal {A}}$ and
 $\mathcal {F}_{\mathcal {R}}$ when
 $\Delta \hat {\alpha }\approx 1$ and
 $\Delta \hat {\alpha }\approx -1$, respectively. The red data represent ‘stick’, when the CL is stationary. For a ‘perfect slip’ system, only the blue and red lines would be present, as shown in figure 4(b). However, our system only approximates this ‘perfect slip’ scenario, with the green data representing the time where the CL is moving while
 $\Delta \alpha$ is changing and
 $\mathcal {F}_{\mathcal {Y}}$ is no longer constant.
Cyclic diagram showing deviation in CA  $\Delta \hat {\alpha }$ against CL radius
 $\hat {R}$ for a drop on a P0 substrate driven from below. Blue corresponds to the region of perfect slip where the CA is constant while the CL advances or recedes. Red corresponds to an immobile CL. Green corresponds to CL advancing or receding with a changing CA. Time proceeds clockwise. The dissipation during one cycle of CL motion is proportional to the area inside the rectangle,
 $\varDelta (\Delta \hat {\alpha })\Delta \hat {R}$ (Xia & Steen Reference Xia and Steen2020). (a) Laboratory generated results for 30 oscillations of a
 $20\ \mathrm {\mu }\textrm {l}$ sessile drop on P0 driven at an acceleration,
 $a = 5.7\ \textrm {m}\ \textrm {s}^{-2}$. (b) Idealized diagram for the perfect slip case.

For near neutral wetting systems,  $\bar {\alpha }\approx {\rm \pi}/2$ and
 $\Delta \alpha \ll {\rm \pi}/2$, Xia & Steen (Reference Xia and Steen2020) showed that the damping ratio of the harmonically driven drop is a measure of dissipation within the drop, and that the Young's force, (3.1), can be expanded in Taylor series resulting in the damping ratio being proportional to the area of the region enclosed in the
 $\Delta \hat {\alpha } - \hat {R}$ plane (cf. figure 4). For our system the only source of dissipation within the drop is from CL motion, implying that the area of the region enclosed in the
 $\Delta \hat {\alpha } - \hat {R}$ plane can be used to quantitatively interpret
 $\mathcal {D}_{CL}$.
4.2. Inertial ‘spreading’ and CL dissipation
Up until now we have assumed that CL dissipation,  $\mathcal {D}_{CL}$, is the primary form of dissipation during spreading, accounting for the difference between a drop's pre-impact,
 $\{K+\mathcal {A}\}_o$, and post-pinning,
 $\{K+\mathcal {A}\}_p$, energy. To test the validity of this assumption, the right-hand side of (3.8) was quantified. Throughout spreading,
 $R$ and
 $\dot {R}$ were measured from experimental images in MATLAB using subpixel edge detection techniques (Trujillo-Pino Reference Trujillo-Pino2019), and
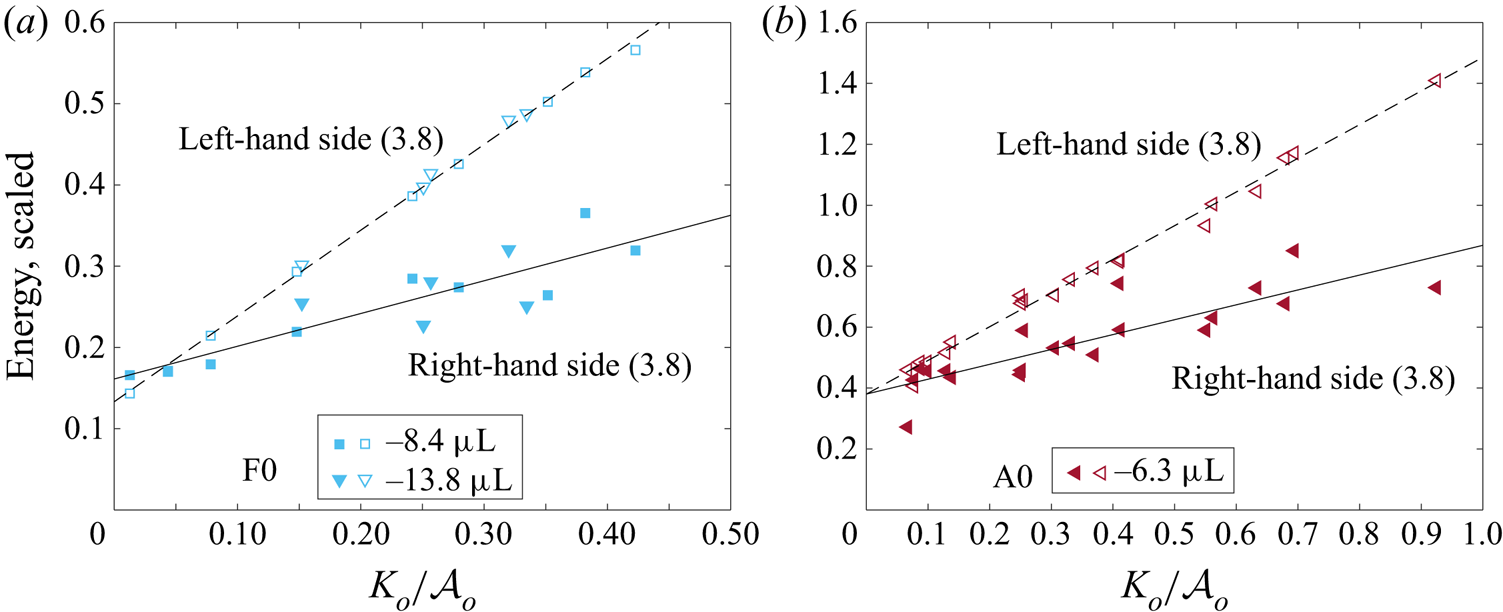
 $\Delta \alpha$ was measured using the software DROPImageAdvanced. Figure 5 shows the results of directly integrating the CL dissipation (right-hand side of (3.8)) compared with the difference between the pre-impact and post-pinning energy of the drop (left-hand side of (3.8)). For low
 $K_o/\mathcal {A}_o$ we find that (3.8) holds, implying that the primary form of dissipation in the system is CL dissipation. However, as
 $K_o/\mathcal {A}_o$ increases the accuracy of (3.8) decreases. This deviation most likely occurs because the inviscid assumption fails, consequently increasing the contribution to the dissipation from the viscous boundary layer (Pasandideh-Fard et al. Reference Pasandideh-Fard, Qiao, Chandra and Mostaghimi1996) and from bulk dissipation, i.e. the second and first right-hand side terms from (3.3), respectively.
Scaled spreading energy against  $K_o/\mathcal {A}_o$ for (a) a
 $8.4$ and
 $13.8\ \mathrm {\mu }\textrm {l}$ drop on an F0 surface and (b) a
 $6.3\ \mathrm {\mu }\textrm {l}$ drop on an A0 surface. Solid and empty symbols denote the right- and left-hand sides of (3.8), respectively. For small
 $K_o/\mathcal {A}_o$, CL dissipation (
 $\mathcal {D}_{CL}$) is the primary form of dissipation in the system. Increasing
 $K_o/\mathcal {A}_o$ increases bulk and viscous boundary layer dissipation.

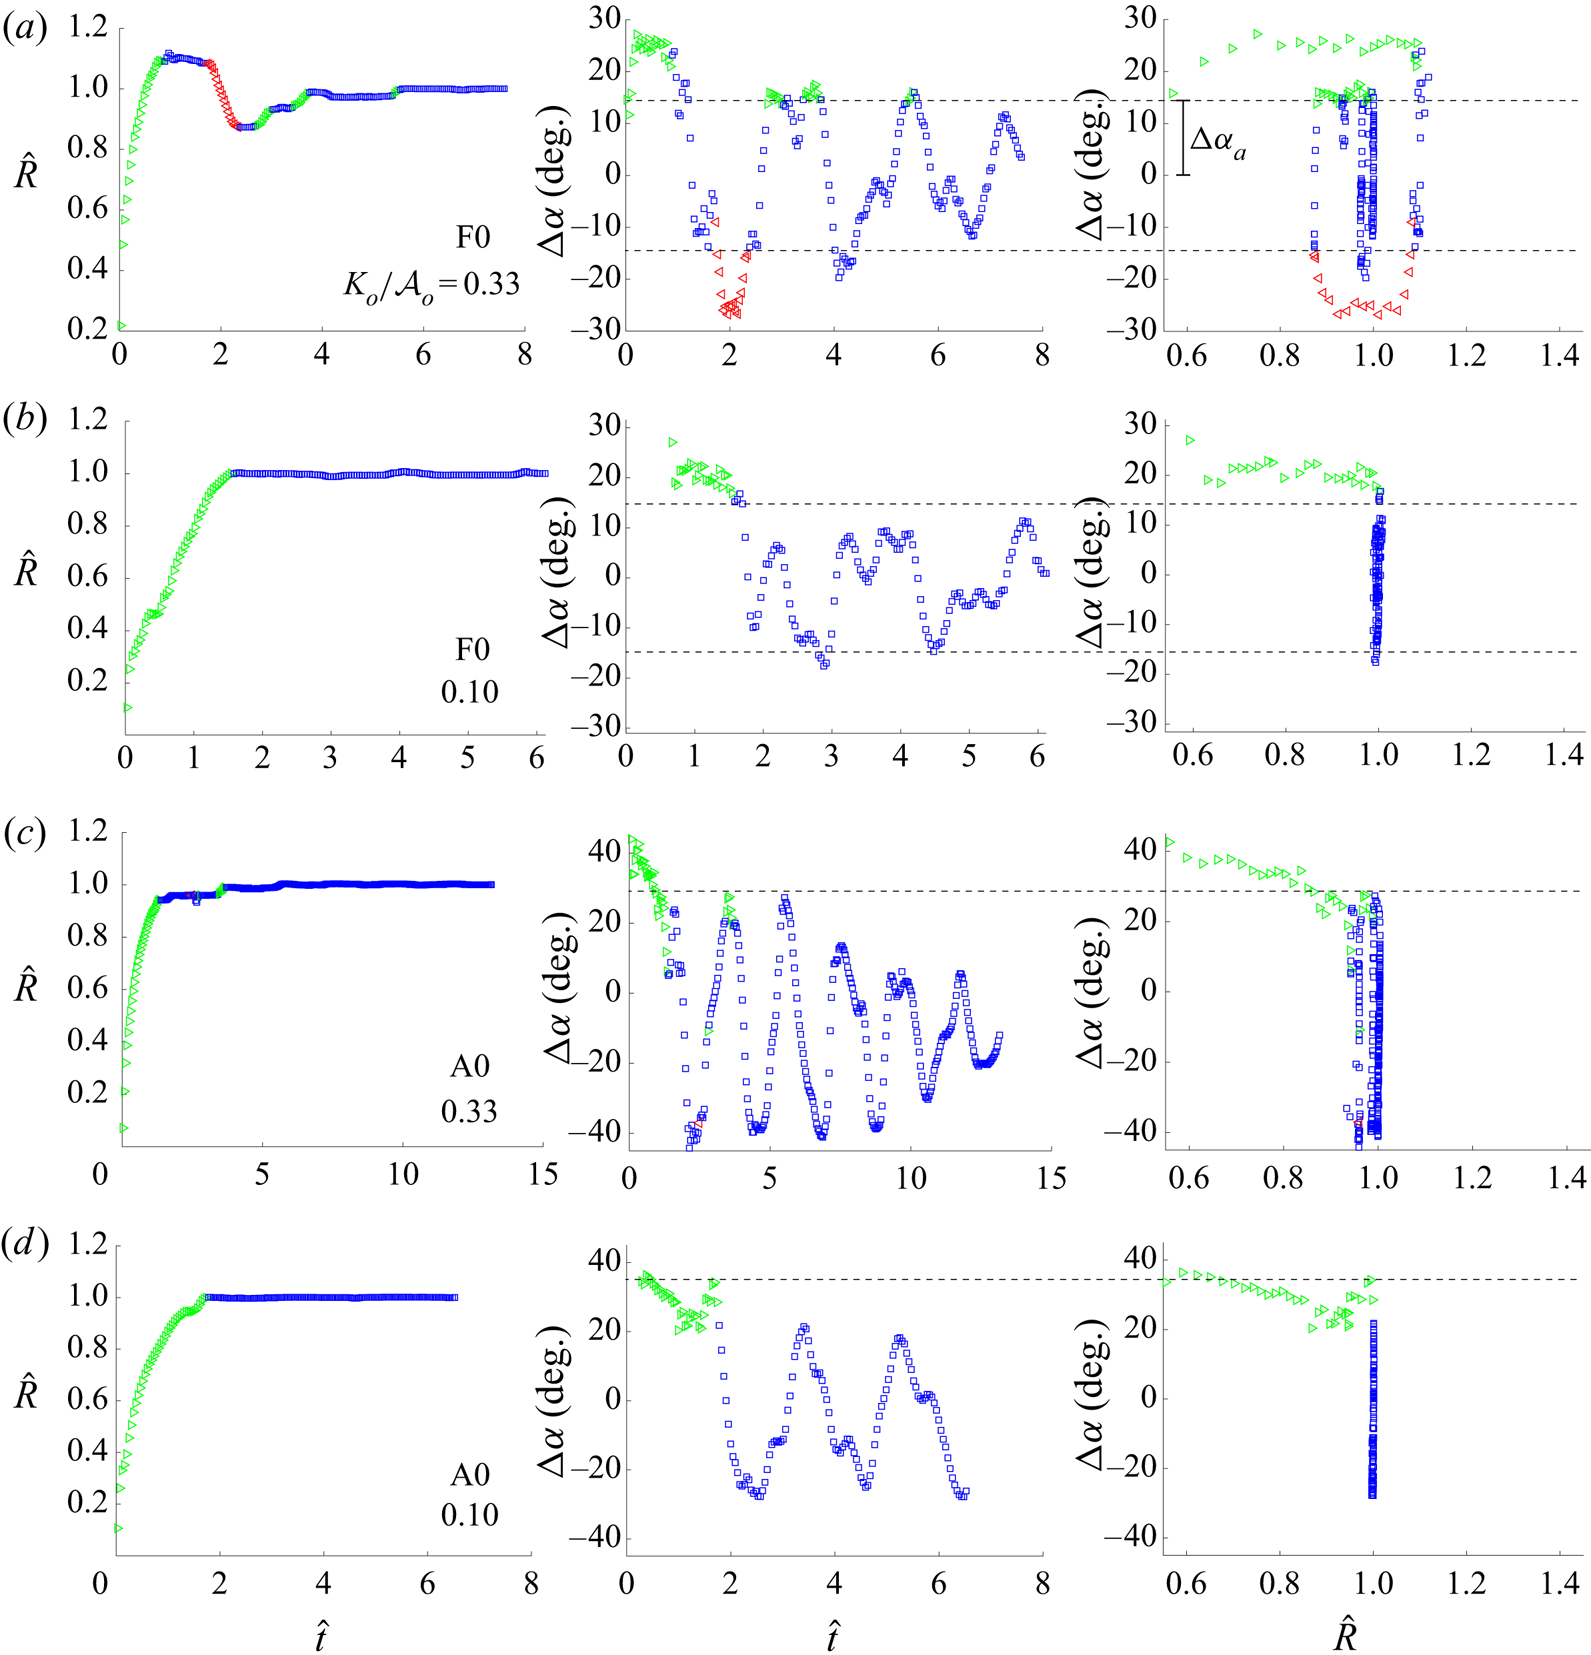
Figure 6 shows the results of typical spreading events for drop impacts on F0 and A0 surfaces at  $K_o/\mathcal {A}_o = 0.10$ and
 $K_o/\mathcal {A}_o = 0.33$, respectively. For hydrophobic systems such as P0, F0, F5 and F10 at moderate
 $K_o/\mathcal {A}_o$, as for example in figure 6(a), the motion of the CL is under-damped, oscillating about its pinning angle
 $\alpha _p$. Figure 6(b) shows that, as
 $K_o/\mathcal {A}_o$ decreases, the drop approaches critical damping, only needing one advancing leg before enough energy is dissipated to halt CL motion. Interestingly, for drop impacts onto hydrophilic systems such as F100 and A0 (cf. figure 6c,d) the motion of the CL followed the same qualitative behaviour of the low
 $K_o/\mathcal {A}_o$ hydrophobic impact, regardless of
 $K_o/\mathcal {A}_o$. A similar phenomenon was observed for F100, however, a long relaxation back to equilibrium
 $\bar {\alpha }$ did occur after the drop's
 $lg$ interface came to rest,
 $t=t_{\infty }$.
CL dynamics dependence on substrate wettability for (a) F0 with  $K_o/\mathcal {A}_o = 0.33$, (b) F0 with
 $K_o/\mathcal {A}_o = 0.1$, (c) A0 with
 $K_o/\mathcal {A}_o = 0.33$, (d) A0 with
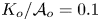 $K_o/\mathcal {A}_o = 0.1$. CL radius against scaled time (left), CA hysteresis
 $\Delta \alpha$ against scaled time (centre) and
 $\Delta \alpha$ against scaled
 $R$ (right). Green symbols represent an advancing CL, red symbols a receding CL and blue symbols a pinned CL.

The rightmost panels in figure 6 are analogous to the cyclic diagram shown in figure 4. In the case of the driven drop, the work inputted into the system equals the work dissipated by the system, causing the loop to close. For the freely impacting drop no work is inputted into the system, energy is irreversibly dissipated at the CL and the result is the spiral decay to the rest state shown in figure 6. Here the rest state of the CL is represented by  $\hat {R} = 1$.
This observed behaviour is similar to the experiments done by Noblin et al. (Reference Noblin, Buguin and Brochard-Wyart2004), where a drop was subject to a forced vibration at resonant frequencies, and the transition from a pinned CL to a mobile CL was observed. When the drop was not forced at a high enough acceleration the authors observed that  $\Delta \alpha$ oscillated within its hysteresis,
 $[\Delta \alpha _r,\Delta \alpha _a]$ with no CL motion. Above a certain threshold acceleration they observed the transition to a moving CL. In our experiments we observe the opposite. At the beginning of spreading the drop's CL is moving with
 $\Delta \alpha >\Delta \alpha _a$, and only moves when
 $\Delta \alpha$ is outside the CL hysteresis shown in the middle column of figure 6. Once enough energy is dissipated at the CL, the drop does not contain enough energy for the
 $lg$ interface to deform in such a way for
 $\Delta \alpha$ to exceed the CL hysteresis, causing
 $\Delta \alpha$ to oscillate only within the hysteresis range. Consequently, the CL comes to rest at a static contact angle
 $\alpha _p$ determined from its rest position.
For low  $K_o/\mathcal {A}_o$ it was shown that (3.8) holds and contact-line dissipation
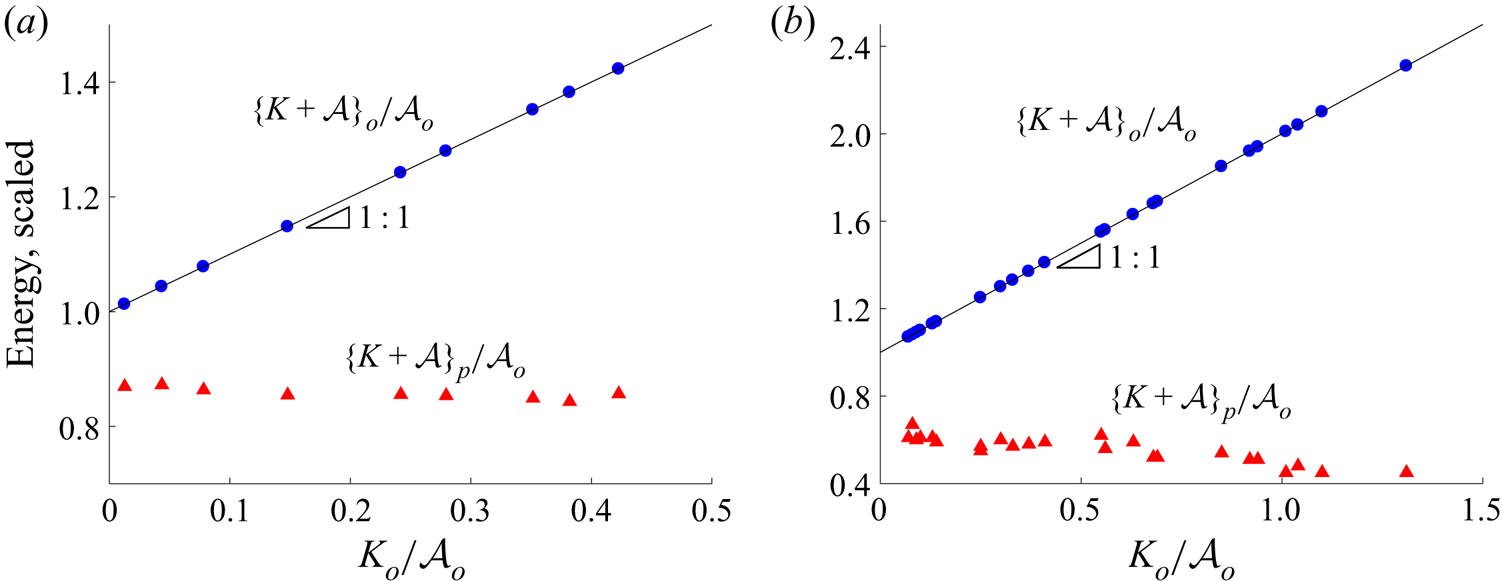
 $\mathcal {D}_{CL}$ is the primary form of dissipation in the system. In figure 7 we see that the drop's pre-impact energy
 $\{K+\mathcal {A}\}_o$ must decay below a certain threshold for the CL to come to rest, where this threshold is the post-pinning energy,
 $\{K+\mathcal {A}\}_p$. Otherwise stated, for a drop with a pre-impact energy above the post-pinning threshold, CL motion ensues until enough energy is dissipated to cause the CL to come to rest. Accordingly, the motion of the CL during spreading acts as a natural filter for the energy of the impacting drop. The energy that remains is the post-pinning energy
 $\{K+\mathcal {A}\}_p$, which contributes to the post-pinning
 $lg$ vibrations, which we discuss in the next section.
The pre-impact energy,  $\{K+\mathcal {A}\}_{o}/\mathcal {A}_o$, and post-pinning energy,
 $\{K+\mathcal {A}\}_{p}/\mathcal {A}_o$, against
 $K_o/\mathcal {A}_o$ for substrate (a) F0;
 $V = 8.39\ \mathrm {\mu } \textrm {l}$,
 $\alpha _p = 98.9^{\circ }$ and (b) A0;
 $V = 6.3\ \mathrm {\mu } \textrm {l}$,
 $\alpha _p = 47 - 73^{\circ }$. The post-pinning energy is invariant to the pre-impact energy when
 $\alpha _p$ is invariant to
 $K_o/\mathcal {A}_o$ as for F0, and decreases with increasing pre-impact energy when
 $\alpha _p$ decreases with increasing
 $K_o/\mathcal {A}_o$ as for A0.

4.3. ‘Post-pinning’ energy
Figure 7 plots the post-pinning energy  $\{K+\mathcal {A}\}_p$ from (3.15) against
 $K_o/\mathcal {A}_o$ for sets of experiments on the F0 and A0 surfaces. Interestingly, we find that regardless of
 $K_o/\mathcal {A}_o$,
 $\{K+\mathcal {A}\}_{p}/\mathcal {A}_o$ remains approximately constant for a given liquid/solid/gas combination when the rest angle
 $\alpha _p$ is approximately constant, as for F0 shown in figure 7(a). Note that the pinning angle
 $\alpha _p$ is not necessarily the equilibrium angle
 $\bar {\alpha }$, but can fall anywhere within the system's hysteresis interval
 $[\alpha _r,\alpha _a]$, graphically represented in figure 2(b). For systems such as F0, this hysteresis interval is relatively small, resulting in the approximately constant
 $\alpha _p$ and
 $\{K+\mathcal {A}\}_{p}/\mathcal {A}_o$, as shown in figure 7(a). For systems such as A0, however, a large hysteresis interval led to a large range of
 $\alpha _p$. Figure 7(b) shows how decreasing
 $\alpha _p$ with increasing
 $K_o/\mathcal {A}_o$ decreased the post-pinning energy
 $\{K+\mathcal {A}\}_{p}/\mathcal {A}_o$. This result establishes a direct connection between the post-pinning energy
 $\{K+\mathcal {A}\}_{p}/\mathcal {A}_o$ and the contact-angle hysteresis through
 $\alpha _p$. We explore this result further in the next sections.
In order to predict the post-pinning energy  $\{K+\mathcal {A}\}_p$, it will be helpful to reframe (3.8) in terms of the energy contributions made by each advancing and receding segment of the spreading event. From the right-hand panels of figure 6 it would be reasonable to assume that each advancing and receding CL event occurs at a constant
 $\Delta \alpha$, as was rationalized in § 4.1, allowing us to rewrite (3.8) as a sum of ‘perfect slip’ legs
 \begin{equation} \{K+\mathcal{A}\}_{o}-\{K+\mathcal{A}\}_{p}=\sum_{n=1}^{m}\int_{R_n-1}^{R_{n}} 2{\rm \pi} R \mathcal{F_Y}_n \,\mathrm{d}R.\end{equation}
Then we can imagine that as  $K_o/\mathcal {A}_o\rightarrow 0$ only one spreading event will occur (cf. figure 6). We can also assume that the only source of dissipation for this singular spreading event will be CL dissipation from (3.8), since as
 $K_o/\mathcal {A}_o\rightarrow 0$, (3.8) holds (cf. figure 5). Last, we assume that the advancing
 $\Delta \alpha$ for this singular spreading event will be the minimal
 $\Delta \alpha$ at which advancing contact-line spreading occurs,
 $\Delta \alpha _a$. With these assumptions, we can infer
 $\{K+\mathcal {A}\}_p$ by manipulating (4.6) and rewriting
 $R$ in terms of
 $\alpha _p$,
 \begin{equation} \frac{\{K+\mathcal{A}\}_p}{\mathcal{A}_o}=1-\frac{1}{4^{{1}/{3}}}\left[\frac{\sin^{3}{\alpha_p}}{2-3\cos{\alpha_p}+\cos^{3}{\alpha_p}}\right]\left(\cos{\bar{\alpha}}-\cos\left({\bar{\alpha}+ \Delta\alpha_a}\right)\right).\end{equation}
We will contrast this theoretical prediction with experimental measurements of the post-pinning energy in § 6.
5. ‘Post-pinning’ modal vibrations
5.1. Modal decomposition
During post-pinning the drop's  $lg$ interface vibrates dissipating energy through viscous dissipation before coming to rest. In this section we aim to understand how these freely disturbed
 $lg$ interfacial vibrations can be understood using the work of Bostwick & Steen (Reference Bostwick and Steen2014) and Bostwick & Steen (Reference Bostwick and Steen2016).
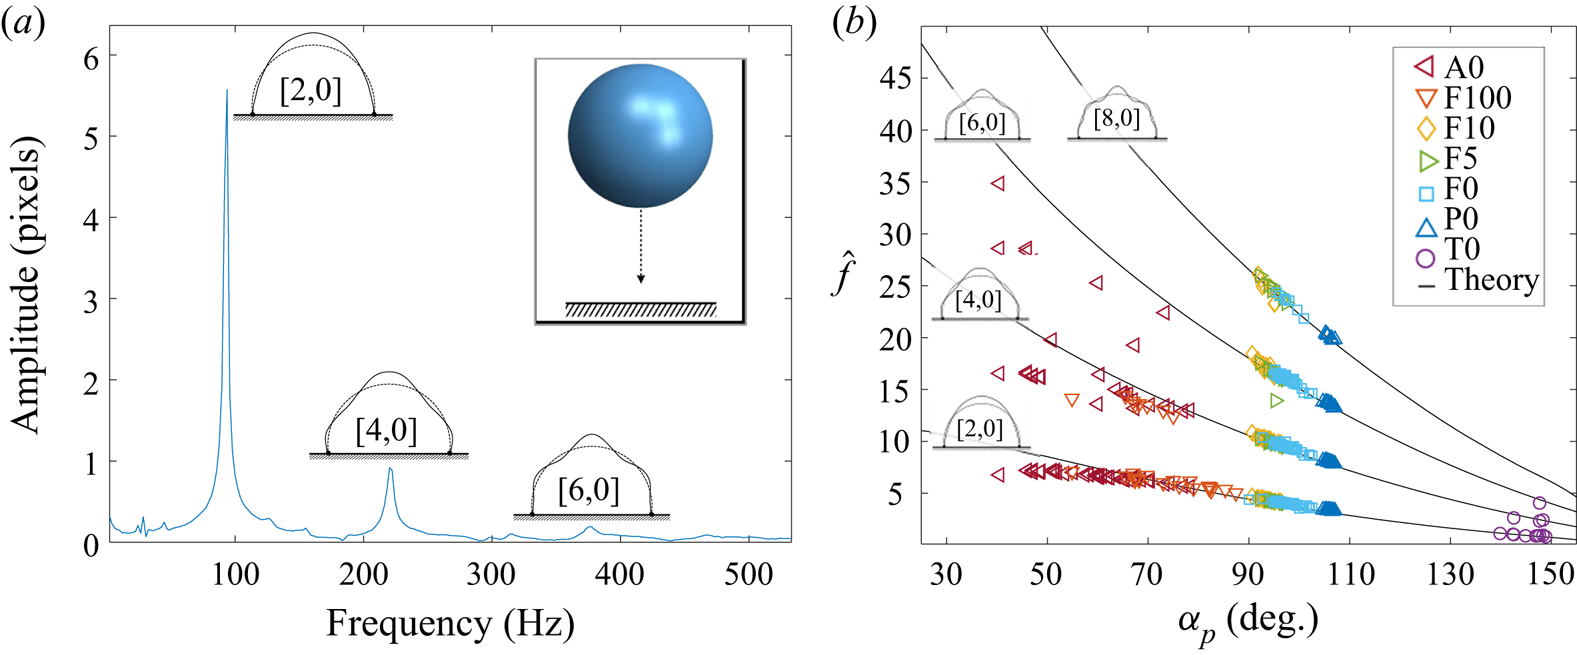
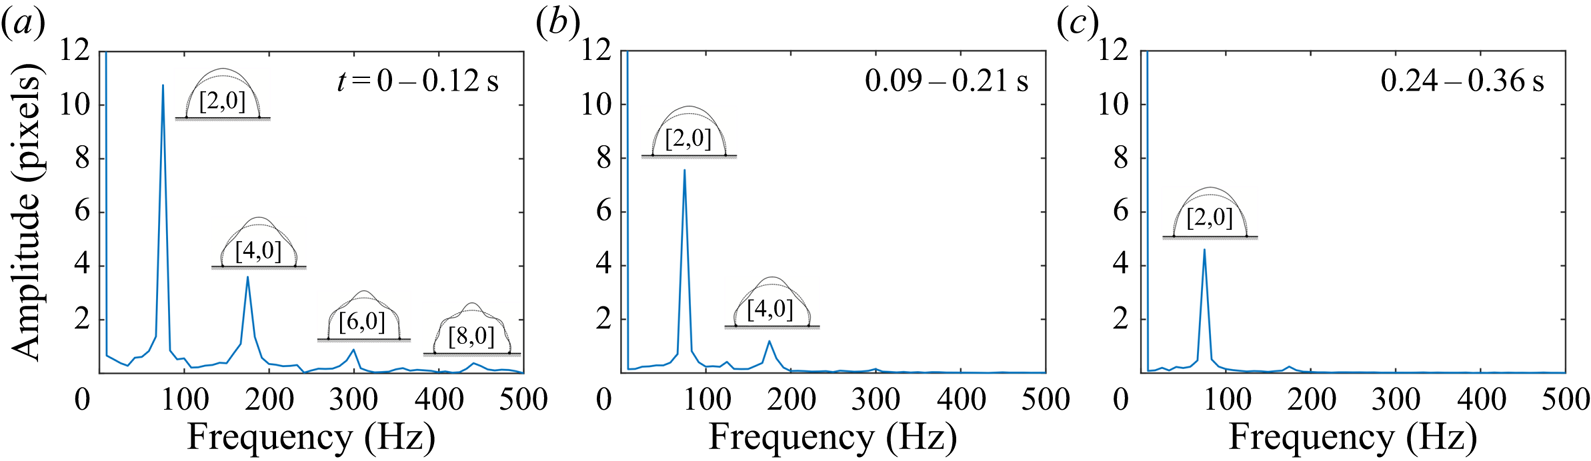
We find that the drop frequency spectrum from impact is the same as a forced drop. Figure 8(a) shows a frequency response diagram computed by taking the FFT of the time trace of the  $lg$ interface at the drop's apex during post-pinning. The resonance peaks correspond to the natural frequencies associated with the
 $l=0$ vibrational modes for the sessile drop predicted by Bostwick & Steen (Reference Bostwick and Steen2014). This procedure can be repeated for all of our substrates.
FFT of the post-pinning  $lg$ interface. Modes are categorized by their wavenumber,
 $[k,l]$ (Bostwick & Steen Reference Bostwick and Steen2014). (a) Drop amplitude against frequency shows a series of resonance peaks associated with axisymmetric modes
 $[k,0]$. (b) Scaled resonance frequency against contact angle
 $\alpha _p$, as it depends upon the liquid/solid/gas system.

Figure 8(b) plots the scaled frequencies 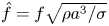 $\hat {f}=f\sqrt {\rho a^{3}/\sigma }$, where
 $a$ is the footprint radius of the drop, during post-pinning over a large range of CAs
 $\alpha _p$. The agreement between experiment and theory is good. Experiments ranged from
 $K_o/\mathcal {A}_o=0$ to
 $1.3$, where we have scaled the drop's pre-impact kinetic energy
 $K_o$ by its pre-impact interfacial energy
 $\mathcal {A}_o$ in order to account for the variation in drop size. This range encompasses impacting energies from when the drop is just touching the surface to energies large enough to cause partial rebound. Interestingly, variation of
 $K_o/\mathcal {A}_o$ did not shift the measured
 $\hat {f}$ from that predicted by the linear theory (Bostwick & Steen Reference Bostwick and Steen2014) despite the increasingly violent behaviour of the drop's interface during spreading, as seen in figure 1. However, variation in
 $K_o/\mathcal {A}_o$ did affect
 $\alpha _p$ for both the hydrophilic A0 and F100 systems, with increases in
 $K_o/\mathcal {A}_o$ leading to decreases in
 $\alpha _p$. For
 $\alpha _p<60^{\circ }$,
 $\hat {f}$ was suppressed relative to the values predicted by Bostwick & Steen (Reference Bostwick and Steen2014), as was observed and discussed in Chang et al. (Reference Chang, Bostwick, Daniel and Steen2015).
We have shown that the frequencies at which the drop's  $lg$ interface vibrates during post-pinning match the frequencies from theory, but knowing only that the frequencies at the apex of the drop match those of the
 $l=0$ mode shapes does not ensure that the vibration of the
 $lg$ interface as a whole can be decomposed into modal components or that these modal components are exclusively
 $l=0$ vibrational modes. In order to show that the vibrations of the drop's
 $lg$ interface excited during normal surface impact can be decomposed into exclusively
 $l=0$ modal components, it is important to perform this same analysis at multiple points along the drop's
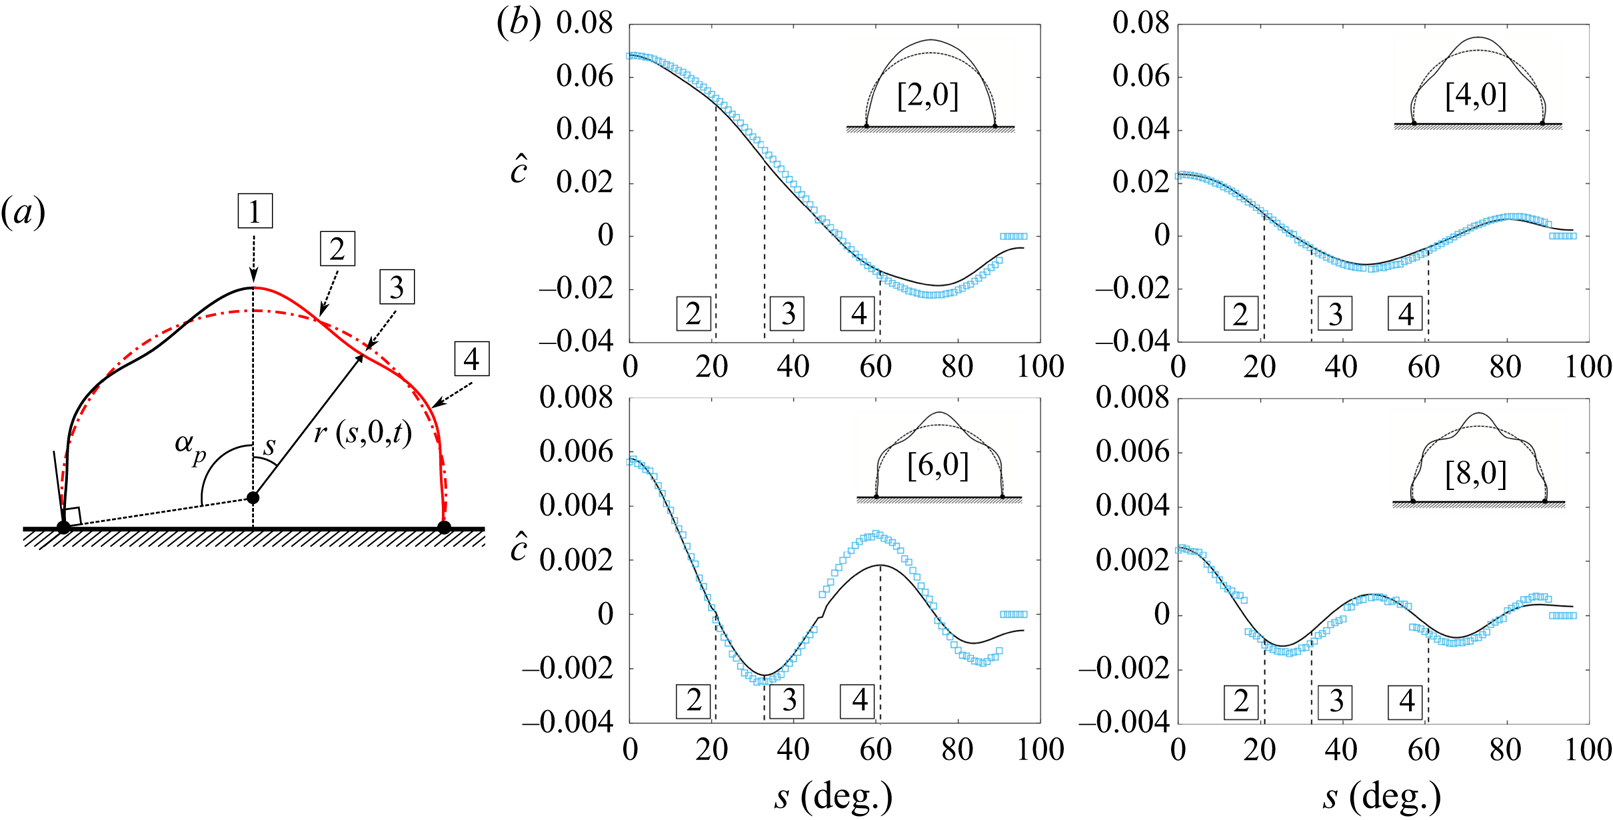
 $lg$ interface, as illustrated in figure 9(a). In performing such an analysis, we found that regardless of the location
 $s$, the FFT only picks up frequencies corresponding to the
 $l=0$ shapes, allowing us to conclude that for normal impact
 $l=0$ modes are excited exclusively. We postulate that this exclusivity occurs because the motion of the centre of mass of the drop remains normal to the surface (Wesson & Steen Reference Wesson and Steen2020).
Drop oscillation shapes in (a) definition sketch and (b) as experimentally determined by the normalized FFT taken at different locations  $s$ along the drop's interface. Empty symbols are experimental values and solid lines are predictions from theory. Maximum deflection for each mode occurs at
 $s=0$. Each mode has a value of
 $s$ that maximizes its contribution to the
 $lg$ disturbance and values of
 $s$ that minimize it.

In order to capture the modal decomposition of the shape of the drop from the FFT at the start of post-pinning, we restrict the time interval of the FFT to the minimum allowed by the Nyquist sampling theorem, beginning at  $t_p$. Figure 9(b) plots the amplitude of the resonance peak for the
 $[k,0]$ mode from the FFT at different locations
 $s$ along the
 $lg$ interface and overlays these points with the
 $lg$ interface shape predicted by theory for each mode. These locations are defined by the ray,
 $r=r(s,0,t)$ extending from the centre of the spherical cap to drop's
 $lg$ interface from
 $s=0$ to the CL
 $s=\alpha _p$. Notably we see that when theory predicts the drop shape has a node that the FFT has a corresponding minimum. For all the detected mode shapes, the prediction from theory for the shape of the drop matches well with the decomposed shapes from the experiment, especially for the two most dominant shapes, the
 $[2,0]$ and
 $[4,0]$, allowing us to conclude that during post-pinning the motion of the drop's
 $lg$ interface can be meaningfully decomposed into mode shapes predicted by Bostwick & Steen (Reference Bostwick and Steen2014). This result is important for quantification of the post-pinning energy.
5.2. Modal decay
Viscous dissipation causes amplitude decay of the vibrations during post-pinning. The study of the decay of vibrational modes dates back to Lamb (Reference Lamb1932), who developed approximate expressions for the damping rates of different vibrational modes of a free drop. Notable studies since include that of Valentine, Sather & Heideger (Reference Valentine, Sather and Heideger1965) who considered the case when both fluids, in our case liquid/gas, have a non-zero viscosity, and that of Prosperetti et al. (Reference Prosperetti1980) who provide a detailed comparison of theoretically predicted damping rates for similar viscous drops in immiscible solutions to the experimental results of Valentine et al. (Reference Valentine, Sather and Heideger1965). Miller & Scriven (Reference Miller and Scriven1968) have additionally shown how inviscid velocity profiles do not account for the boundary layer flow near the free interface, consequently suppressing the theoretical predicted damping rate for each individual mode. In this section we report on the experimentally determined damping rate,  $\gamma _{[k,l]}$, for each of our observed mode shapes during normal impact and compare to those predicted by Miller & Scriven (Reference Miller and Scriven1968) for the free drop case.
In order to calculate the energy contribution of the individual mode shapes during post-pinning, it is important to understand the amount of energy contained within the drop at the instant post-pinning begins. As we have shown in § 5.1, the motion of the drop's interface can be understood as a linear superposition of modal components, each vibrating independently and containing its own contribution to the drop's total energy during post-pinning. By breaking up the motion of the drop's interface into modes, we can then think of the energy of the interface as having a point in time when the kinetic energy  $K$ is maximized and a point where
 $K$ is minimized. When
 $K$ is minimized, all of the drop's energy is contained as
 $lg$ interfacial energy
 $\mathcal {A}$ for each mode shape
 $\mathcal {A}_{[k,l]}$. At this point in time we can determine the magnitude of the disturbance
 $c$ associated with this maximal
 $\mathcal {A}$ at
 $s=0$. This value of
 $c$ corresponds to the instant of pinning
 $t=t_p$, before any energy has been lost due to viscous dissipation
 $\mathcal {D}_{bulk}$.
In order to quantify the disturbance  $c$ at time
 $t_p$, we determine the rate of decay of the individual mode shapes
 $\gamma _{[k,l]}$ and use this rate to determine the disturbance at the instant of pinning
 $c_{[k,l]}$ from the disturbance
 $c$ at any point during post-pinning. In this work we choose to measure
 $\gamma _{[k,l]}$ directly from the experiment for each mode. In order to calculate
 $\gamma _{[k,l]}$, the post-pinning experimental images were broken into intervals, such that the Nyquist condition is satisfied, and a series of FFTs were performed. The magnitude of the disturbance
 $c$ during post-pinning is expected and experimentally confirmed to take the form
 \begin{equation} c(t) = c_{[k,l]}\exp({-\gamma_{[k,l]} (t-t_p)})\cos{(2{\rm \pi} f_{[k,l]}(t-t_p)+\beta)}, \end{equation}
where  $\beta$ is the phase shift. The amplitude of the peak from the FFT corresponding to each mode was recorded. The natural logarithm of these amplitudes was taken and
 $\gamma _{[k,l]}$ extracted by measuring the slope over time. The decay rate
 $\gamma _{[k,l]}$ was found to be constant throughout post-pinning for each of the mode shapes. Alternatively,
 $\gamma _{[k,l]}$ can be determined by performing a wavelet transformation on the waveform traced by
 $r=r(s,t)$ at a fixed
 $s$ from the experiment.
Figure 10 shows a series of FFTs taken over different time intervals during post-pinning. In figure 10(a), just after the start of post-pinning, mode shapes up to  $k=8$ are observed. As
 $t$ increases, bulk dissipation
 $\mathcal {D}_{bulk}$ damps the modal contributions to the post-pinning
 $lg$ interfacial vibrations. After approximately
 $0.1\ {\rm s}$ post pinning the higher-order modes are almost completely dissipated, as seen in figure 10(b). For longer times, all of the higher-order modes have decayed leaving only the
 $[2,0]$ mode, as shown in figure 10(c).
FFTs of sequential 0.12 s time intervals of  $r(s,t)$ measured at
 $s=0$ for a
 $13.8\ \mathrm {\mu }\textrm {l}$ drop for liquid/solid system F0. Higher-order mode shapes, larger
 $k$, decay faster than their lower-order counterparts.

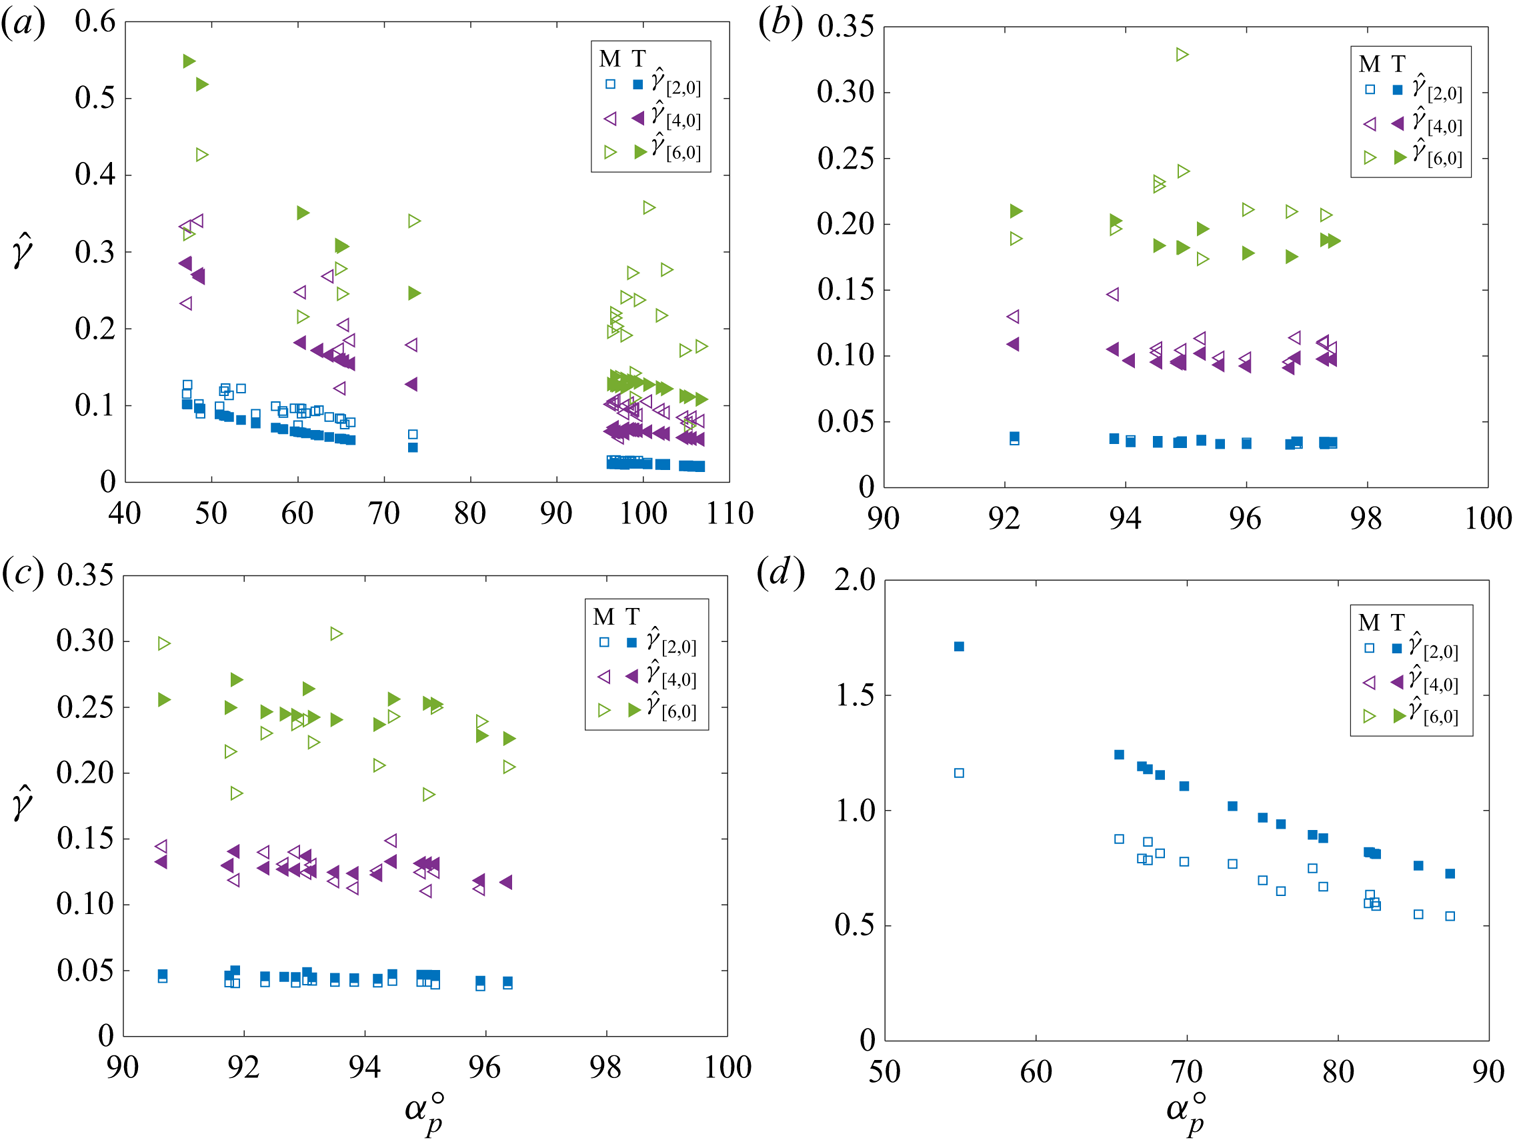
Figure 11 summarizes the measured decay rates compared with Miller & Scriven (Reference Miller and Scriven1968), equation (28), for a low viscosity free drop oscillating in a gas of negligible density,
 \begin{equation} \hat{\gamma}_{[k,0]} = \frac{\mu (k^{2}+3k)}{2\rho}\frac{R}{R_d^{3}}\sqrt{\frac{\rho a^{3}}{\sigma}}.\end{equation}
Here, we have used the sessile drop radius  $R$ as the length scale and multiplied the decay rate by the scaled volume
 $R^{3}/R_d^{3}$ to account for the difference in volume between the sessile drop and a free drop. Equation (5.2) lends itself to a good first order approximation of the decay rates of the individual modes, where
 $k=2$ corresponds to the
 $[2,0]$ mode,
 $k=4$ the
 $[4,0]$ mode, etc. In our case, the pinned CL constrains the sessile drop, causing its modes to decay faster than a similar free drop for 0 wt/wt%, 5 wt/wt% and 10 wt/wt% glycol/water solutions as observed in figure 11(a–c). However, for the 100 wt/wt% glycol/water case, the non-negligible viscosity of the solution caused the approximation to over predict the decay rate as seen in figure 11(d). In all cases, higher order mode shapes decayed faster than their lower-order counterparts, as expected.
Experimentally determined (M) and theoretically approximated (T) scaled decay rates  $\hat {\gamma }$ against rest angle
 $\alpha _p$ for (a) 0 wt/wt% glycol/water, (b) 5 wt/wt% glycol/water, (c) 10 wt/wt% glycol/water, (d) 100 wt/wt% glycol/water impacts. For low viscosity systems (a–c), a scaled equation (28) from Miller & Scriven (Reference Miller and Scriven1968) provides a good first-order approximation of the decay rates of individual modes. The value of
 $K_o/\mathcal {A}_o$ was not found to influence
 $\hat {\gamma }$.

5.3. Modal energy decomposition
In § 3.5 we derived an expression for the post-pinning energy, (3.15), that allowed us to calculate  $\{K+\mathcal {A}\}_{p}$ directly from experimental images. In order to minimize the numerical error associated with calculating the
 $lg$ interfacial velocity,
 $u_r$, from discrete experimental images, it would be advantageous to recast (3.15) to remove
 $u_r$. Since we know the
 $lg$ interface is oscillating, we can consider the case when
 $u_r=0$, which corresponds to the maximum deformation of the drop's
 $lg$ interface. We know a point in time must exist where
 $u_r=0$ for each mode shape at all values of
 $s$ by looking at the time derivative of (1.1)
 \begin{equation} \dot{r}(s,t) = u_r ={-}\epsilon \psi(s) \varOmega \cos{(l\phi)} \sin{(\varOmega t)},\end{equation}
justifying a simplification of (3.15) to
 \begin{equation} \{K+\mathcal{A}\}_{p}=\sigma\left( A_{cap}+\sum_{k=2,4,6\ldots}^{\infty}\left(2{\rm \pi} S_{\left[k,0\right]}\overline{x}_{\left[k,0\right]}-A_{cap}\right)- A_{ls}\cos{\left(\alpha_p\right)}\right),\end{equation}
where  $S_{[k,0]}$ represents the arc length of each modal shape and is quantified by fitting the solution from Bostwick & Steen (Reference Bostwick and Steen2014) to the disturbance,
 $c_{[k,0]}$, measured for each mode using the procedure outlined in § 5.2. The energy associated with each mode shape is then calculated using Pappus's first centroid theorem,
 $\mathcal {A}_{[k,0]}=2{\rm \pi} \bar {x}S_{[k,0]}$, since the mode shapes are azimuthally symmetric, where
 $\bar {x}$ represents the geometric centroid of
 $S$, as shown in figure 12.
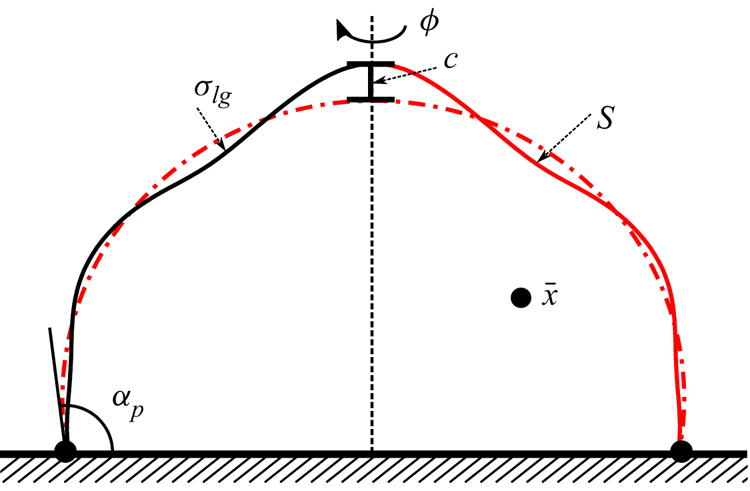
Schematic of an oscillating drop with CA  $\alpha _p$ illustrating the arclength
 $S$, geometric centroid
 $\bar {x}$ and disturbance magnitude
 $c$. The post-pinning energy
 $\{K+\mathcal {A}\}_p$ can be determined by evaluating the
 $lg$ interfacial energy from Bostwick's solution and application of Pappus's theorem.

This simplification to (5.4) relies on the assumptions that the motion of the  $lg$ interface can be broken into linearly superimposable components as described in § 5.1 and that the energies of each of these modal components can be calculated. In simplifying (3.15) to (5.4) we assume that the energy of the drop is completely contained within the surface energy of the drop
 $\mathcal {A}_p$. This assumption is justified because the motion of the drop during post-pinning can be described as a linear superposition of mode shapes, and for each mode a point in time exists where
 $K=0$, i.e.
 $u_r=0$ from (5.3). We can then express
 $\{K+\mathcal {A}\}_{p}$ as a sum of three contributions to
 $\mathcal {A}_p$ as in (5.4): (i) the energy of the
 $lg$ interface at time
 $t_{\infty }$,
 $\sigma A_{cap}$, (ii) the additional contribution from each mode shape to the drop's
 $lg$ rest state
 $\sigma 2{\rm \pi} S_{[k,0]}\overline {x}_{[k,0]}-A_{cap}$ and (iii) the contribution from the
 $ls$ interface
 $-\sigma A_{ls} \cos {(\alpha _p)}$.
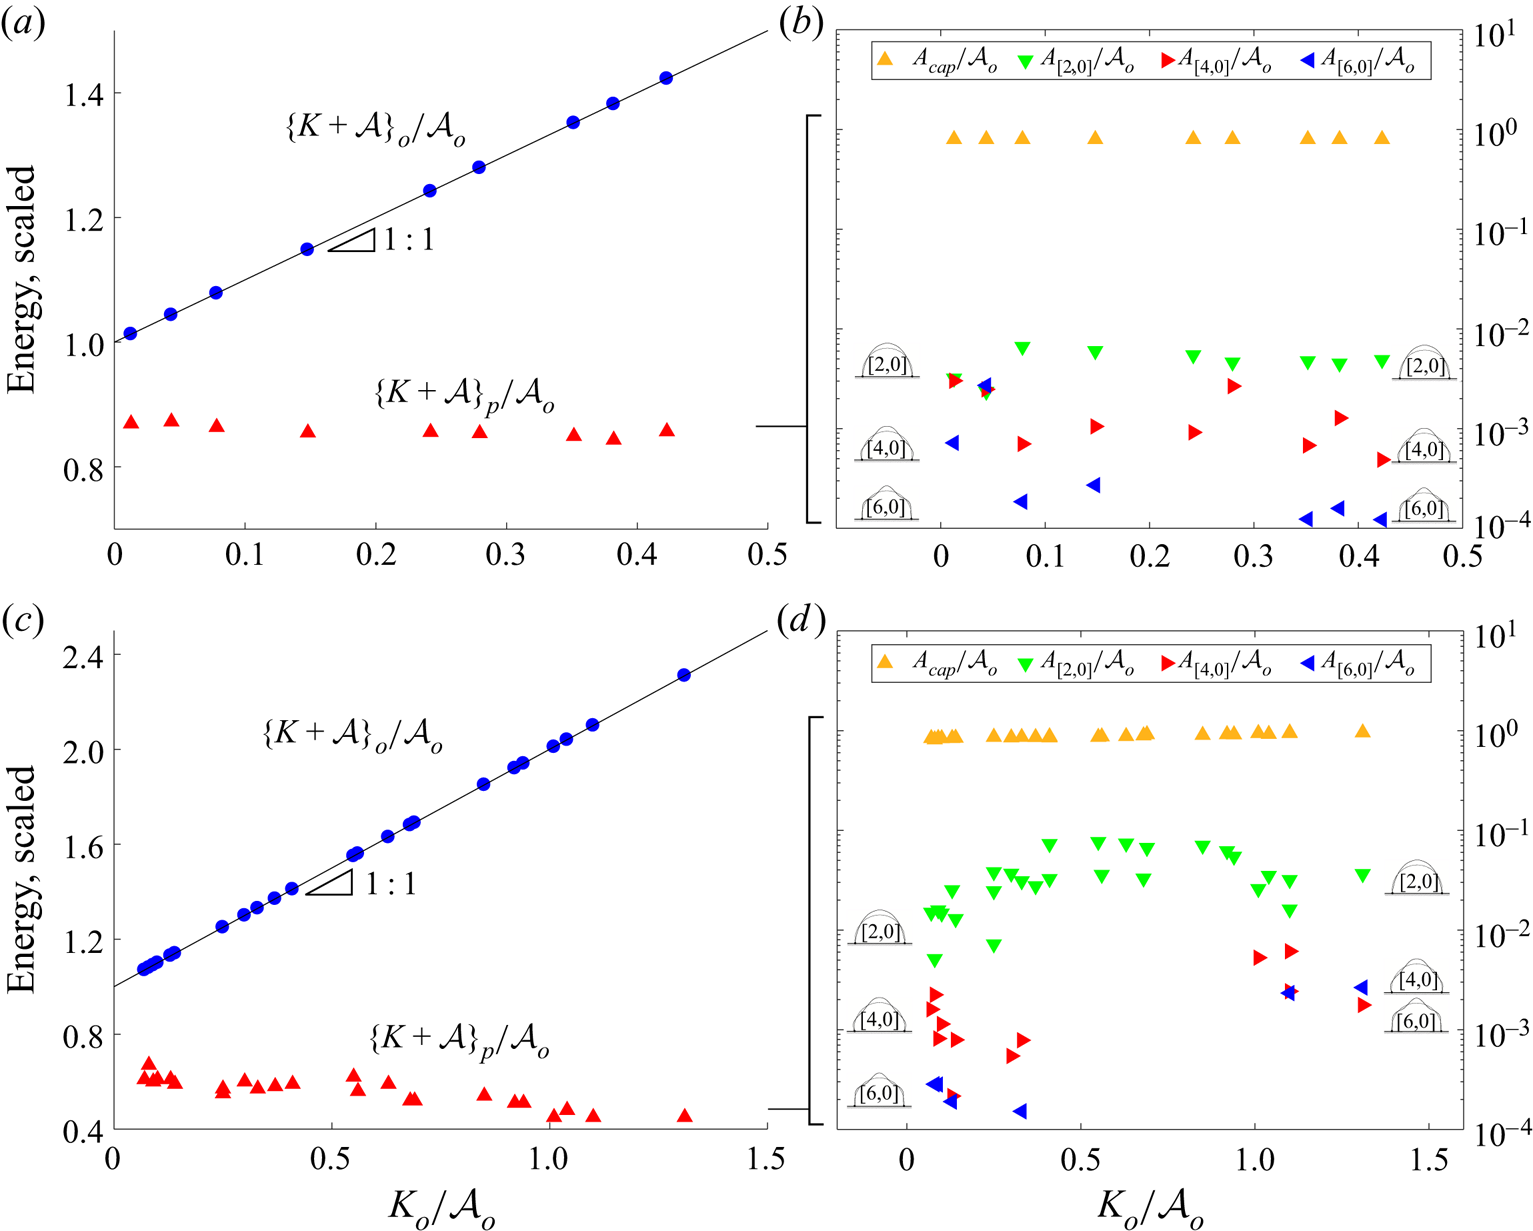
Figure 13 shows the energy decomposition using (5.4) for a set of experiments from F0 and A0 systems with varying  $K_o/\mathcal {A}_o$. Figure 13(a,c) shows the total energy of the drop during post-pinning
 $\{K+\mathcal {A}\}_p$ compared with the drop's pre-impact energy
 $\{K+\mathcal {A}\}_o$ both scaled by
 $\mathcal {A}_o$. Earlier, we saw that variation in
 $\{K+\mathcal {A}\}_p$ for any given system is a result of varying
 $\alpha _p$. Here, we show the results of calculating the modal components of
 $\{K+\mathcal {A}\}_p$, i.e.
 $\sigma 2{\rm \pi} S_{[k,0]}\overline {x}_{[k,0]}-A_{cap}$, in figure 13b,d). We see that when
 $\alpha _p$ and
 $\{K+\mathcal {A}\}_p$ are constant, the modal contributions to
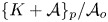 $\{K+\mathcal {A}\}_{p}/\mathcal {A}_o$ are relatively constant as in figure 13(b), and that variation in
 $\alpha _p$ leads to variation in the modal energy contributions in figure 13(d). For increasing
 $K_o/\mathcal {A}_o$, figure 13(d) shows increasing modal energy contributions, despite a decreasing
 $\{K+\mathcal {A}\}_p$. This seemingly contradictory result is a consequence of the
 $ls$ energy term
 $-\sigma A_{ls}\cos {(\alpha _p)}$ from (5.4), which increases in magnitude with increasing
 $K_o/\mathcal {A}_o$ as
 $\alpha _p$ decreases with increasing
 $K_o/\mathcal {A}_o$ for the A0 system.
(a,c) Scaled energy and (b,d) modal decomposition of  $lg$ interfacial energy against
 $K_o/\mathcal {A}_o$ for (a,b) F0 system
 $V = 8.39\ \mathrm {\mu } \textrm {l}$,
 $\alpha _p = 98.9^{\circ }$ and (c,d) A0 system
 $V = 6.3\ \mathrm {\mu } \textrm {l}$,
 $\alpha _p = 47 - 73^{\circ }$. The post-pinning energy is invariant to
 $K_o/\mathcal {A}_o$ when
 $\alpha _p$ is constant but decreases when
 $\alpha _p$ changes with
 $K_o/\mathcal {A}_o$. Note the
 $[4,0]$ and
 $[6,0]$ shapes were present during each impacting event but not always shown due to clarity of images.

6. ‘Post-pinning’ predictions
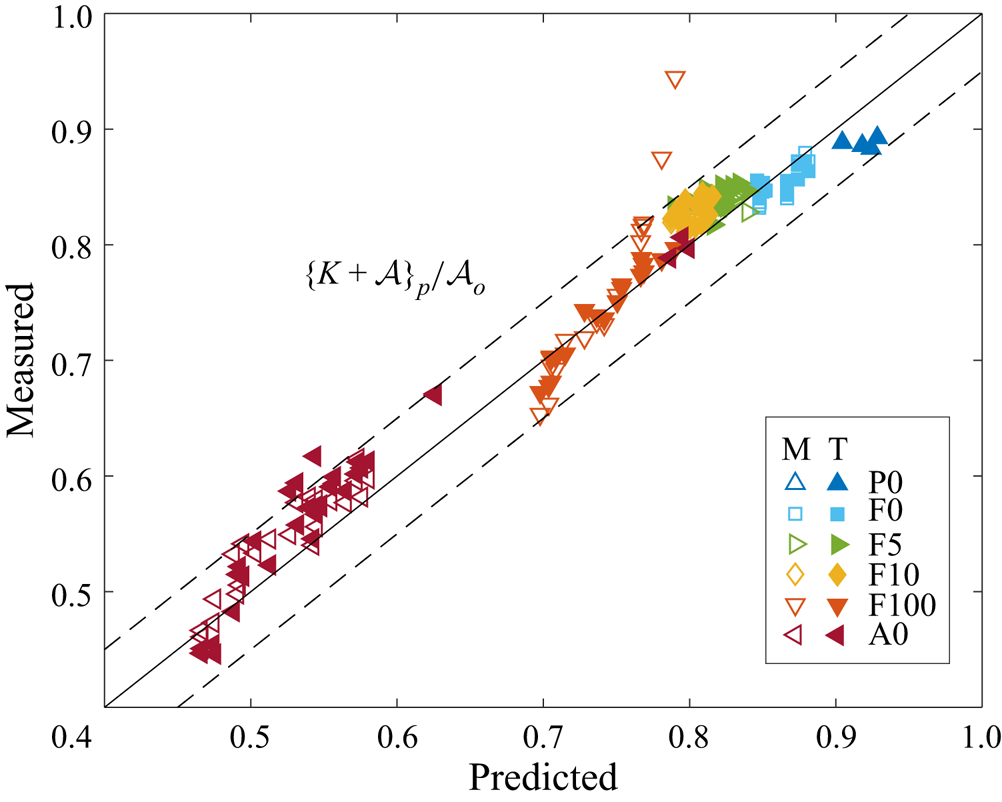
As stated earlier, the difference between pre-impact and post-pinning energies is the energy dissipated by the dynamic CL motion and we have derived an explicit expression for the post-pinning energy, (4.7), based upon the assumption of perfect slip legs. Figure 14 compares this prediction (4.7) with values explicitly measured (3.15) and where the  $lg$ interfacial energy has been calculated by decomposing into modal components (5.4) using the theory of Bostwick & Steen (Reference Bostwick and Steen2014). It can be seen that (4.7) is independent of viscosity and predicts
 $\{K+\mathcal {A}\}_p/ \mathcal {A}_o$ to within 5 % of the experimentally measured values for most experiments over a range of viscosities.
Measured against predicted ‘post-pinning’ energy  $\{K+\mathcal {A}\}_p/\mathcal {A}_o$. Empty symbols (M) calculated by measuring
 $lg$ interface in MATLAB directly from images over time using (3.15). Solid symbols (T) calculated by decomposing the post-pinning
 $lg$ vibrations into modal components (5.4) and using the theory from Bostwick & Steen (Reference Bostwick and Steen2014) to calculate the
 $lg$ interfacial energy.

Multiple conclusions can be drawn from (4.7). First, for low-hysteresis surfaces where  $\alpha _p \rightarrow \bar {\alpha }$, since both
 $\alpha _p$ and
 $\bar {\alpha }$ fall in the interval
 $[\Delta \alpha _r,\Delta \alpha _a]$,
 $\{K+\mathcal {A}\}_p/\mathcal {A}_o$ can be known a priori assuming
 $\bar {\alpha }$ and
 $\Delta \alpha _a$ are also known. Second, if
 $\Delta \alpha _a$ increases then
 $\{K+\mathcal {A}\}_p/\mathcal {A}_o$ decreases and vice versa, implying that this transmitted energy can also be used as a measure of CA hysteresis, i.e. a filter. Third, if
 $\Delta \alpha _a\rightarrow 0$ then
 $\{K+\mathcal {A}\}_p/\mathcal {A}_o \rightarrow 1$, implying all of the drop's pre-impact interfacial energy,
 $\mathcal {A}_o$, is converted into post-pinning kinetic and interfacial energy,
 $\{K+\mathcal {A}\}_p$. This result may seem inharmonious with (3.8) which states for
 $\Delta \alpha _a\rightarrow 0$ that
 $\{K+\mathcal {A}\}_p=\{K+\mathcal {A}\}_o$ for
 $K_o \neq 0$, however, we must remember that in this derivation we are ignoring other forms of dissipation in the system from (3.3), implying any
 $K_o$ present must be dissipated through other means. More importantly this result says that without the presence of CL dissipation, all of
 $\mathcal {A}_o$ is converted into
 $\{K+\mathcal {A}\}_p$, the drop's post-pinning vibrations.
7. Conclusion
The energetics of drop impact on partially wetting substrates was studied in the capillary-ballistic regime. Experiments were performed using water/glycol mixtures on multiple substrates with varying wetting properties, as defined by the CA and CA hysteresis. High-speed imaging was used to capture the drop motion and the CL dynamics during the impacting event, which we divided into three stages: (i) ‘pre-impact’, (ii) ‘spreading’ and (iii) ‘post-pinning’.
First, we focused on the fast-time-scale spreading where the primary source of dissipation is due to the work done by the CL ( $\mathcal {D}_{CL}$). We showed that the post-pinning energy is independent of the drop's pre-impact kinetic energy and that the difference between pre-impact and post-pinning energies does not depend upon liquid viscosity. Instead, it is related to the CL dissipation, which acts as a natural filter dissipating the drop's impact energy. The origin of CL dissipation is the loss of kinetic energy along perfect slip legs during spreading, as interpreted from the area enclosed within the cyclic diagram (
 $\Delta \alpha -R$). This observation leads us to a closed-form prediction for the post-pinning energy, (4.7), that depends upon the rest angle
 $\alpha _p$, equilibrium angle
 $\bar {\alpha }$ and hysteresis
 $\Delta \alpha _a$. There are a number of immediate consequences to this theoretical prediction: (i) the post-pinning energy can be known a priori for low-hysteresis surfaces if
 $\bar {\alpha }$ and
 $\Delta \alpha _a$ are known, (ii) increasing hysteresis leads to decreased post-pinning energy implying the transmitted energy can be used as a measure of hysteresis and (iii) in the limit
 $\Delta \alpha \rightarrow 0$ all the drop's initial pre-impact
 $lg$ energy is converted to post-pinning energy.
Next, we focused on the slow time scale associated with viscous dissipation. Here we showed how the post-pinning energy gives rise to oscillations of the  $lg$ interface and how these oscillations can be decomposed into modal components predicted by the sessile drop theory of Bostwick & Steen (Reference Bostwick and Steen2014). Following the fast-time-scale spreading regime, the CL becomes pinned making a rest angle
 $\alpha _p$ that lies within the hysteresis
 $[\Delta \alpha _r, \Delta \alpha _a]$. This hysteresis is defined by the wetting properties of the substrate. The post-pinning energy is transformed into oscillations of the
 $lg$ interface, which occur on a slow time scale characterized by energy loss due to viscous dissipation. These oscillations can be decomposed into axisymmetric (
 $l=0$) pinned sessile drop modes from theory (Bostwick & Steen Reference Bostwick and Steen2014). FFTs are used to determine the frequency spectrum and interface shape for the resonant modes. We observed that these modes are independent of the pre-impact energy, only depending upon the rest angle
 $\alpha _p$. We also observed that the measured frequencies agree well with theory but are suppressed for
 $\alpha _p<60^{\circ }$, consistent with the experimental observations of Chang et al. (Reference Chang, Bostwick, Daniel and Steen2015). The decay rates for each mode
 $\gamma _{[k,l]}$ were measured and compared with those predicted by Miller & Scriven (Reference Miller and Scriven1968) for a free drop, which are shown to be a good first approximation of
 $\gamma _{[k,0]}$. As expected, higher-order modes decay faster and the pinned modes have a larger decay rate compared with the free drop.
Lastly, we found that the post-pinning energy can be partitioned into modal components. We measured the energy decomposition and showed that the modal contributions  $\mathcal {A}_{[k,l]}/\mathcal {A}_o$ are independent of the pre-impact energy but depend upon the rest angle
 $\alpha _p$. The modal decomposition allowed us to quantify the post-pinning energy
 $\{K+\mathcal {A}\}_p$ at the moment of pinning
 $t_p$. Quantifying the post-pinning energy in this way can be used to determine
 $\mathcal {D}_{CL}$ by comparing the difference in pre-impact energy
 $\{K+\mathcal {A}\}_o$ and post-pinning energy
 $\{K+\mathcal {A}\}_p$. This information could be used to evaluate the wetting properties of designer substrates.
Our work sheds light on the CL dynamics during inertial spreading in the capillary-ballistic regime. This work is distinguished from most studies of viscous-dominated spreading which are described by Tanner's law. The complex stick-slip motions we observe are best illustrated in the cyclic diagram  $\Delta \alpha -R$ from which we quantify the energy dissipated via CL motion. This work is useful for many spray coating technologies where maximizing the extent of spreading is desirable and whose rapid CL motions naturally need to overcome
 $\mathcal {D}_{CL}$. Capillary-ballistic CL motions are also observed during drop/drop coalescence events (Ludwicki & Steen Reference Ludwicki and Steen2020) and application of these results could be useful for future experimental studies.
The modal decomposition and energy analysis performed in this paper could also be useful in forensic science for blood spatter analysis as the formation of satellite drops is often determined by the modal structure (Comiskey et al. Reference Comiskey, Yarin, Kim and Attinger2016). The problem becomes even more complicated for oblique impacts, as the pre-impact energy is transformed into complex drop motions that are no longer purely axisymmetric, but also contain asymmetric components. These complex motions leave the CL non-circular, complicating the CL dissipation analysis presented in § 3.5. During post-pinning, the  $lg$ vibrations can be decomposed into vertical and horizontal centre-of-mass motions, largely defined by the impact angle and wetting properties of the substrate. In this case, it may be useful to use the classification structure for sessile drop motions introduced by Steen et al. (Reference Steen, Chang and Bostwick2019). This topic should be pursued in future studies.
Acknowledgements
The authors acknowledge Professor P.H. Steen's role in leading this research, and note his passing before the time of publishing. We are honoured to be able to continue this work and bring it to the field. We would also like to acknowledge the invaluable insight provided by Y. Xia, E. Wesson, J. McCraney, S. Weinstein, J. Ludwicki, J. Mattson and S. Daniel throughout completion of this work.
Funding
We gratefully acknowledge support from NSF grants 1530522, 1637960 and 1935590.
Declaration of interests
The authors report no conflict of interest.
Appendix A. Materials and methods
A.1. Materials
Glass slides (VWR VistaVision, catalogue no. 16004-430,  $3\ {\rm in.} \times 1\ {\rm in.}$,
 $\times 1\ \textrm {mm}$), sulphuric acid (95 %–98 % min., MW 98.08, CAS no. 7664-93-9), ethanol (reagent alcohol, absolute, CAS no. 64-17-5; Macron Chemicals), toluene (99.5 % min., MW 92.14, CAS no. 108-88-3) and acetone (CAS no. 67-64-1; Macron Chemicals) were purchased from VWR International (Radnor, PA). Silicon wafers (Silicon Quest International, catalogue no. 808-007) were purchased from Silicon Quest International (San Jose, CA). Hydrogen peroxide (50 wt%, SKU 516813-500ML, CAS no. 7722-84-1, MW
 $34.01 \ \textrm {g}\ \textrm {mol}^{-1}$) was purchased from Sigma-Aldrich (St. Louis, MO). Fluorosilane (Heptadecafluoro-1,1,2,2-tetrahydrododecyl trichlorosilane, CAS no. 78560-44-8, MW 581.56), trimethylsiloxy terminated poly(dimethylsiloxane) (PDMS) (Gelest, Product Code DMS-T22) and APTES –
 $99+\%$ were purchased from Gelest (Morrisville, PA). Light mineral oil (CAS no. 8042-47-5) was purchased from Fisher Scientific (Pittsburgh, PA). Liquid nitrogen and high-purity compressed nitrogen were purchased from Airgas (Radnor, PA). A Teflon sheet (
 $12\ {\rm in.} \times 12\ {\rm in.} \times 0.125\ {\rm in.}$) cut into (
 $1\ {\rm in.}\times 1\ {\rm in.} \times 0.125\ {\rm in.}$) pieces was purchased from ePlastics. 240 grit sand paper was purchased from Perfect Sanding Supply. A 14–30g assortment of syringe tips (part no. 922-005) were purchased from CML Supply.
A.2. Surface preparation
A.2.1. Fluorosilane
Glass slides were sonicated (Ultrasonic Cleaner, model B2500A-DTH, VWR) for 20 min in water to remove solid particles from their surfaces, then immersed in piranha solution (70 % sulfuric acid/30 % hydrogen peroxide) for 20 min to remove any organic contaminants. The slides were then rinsed with de-ionized (DI) water (purified by an Elga Ultra SC MK2, Siemens) and kept immersed until needed. Next, 2 g of mineral oil and 2  ${\rm \mu}$L of fluorosilane were deposited in a plastic Petri dish and homogenized via manually stirring. The fluorosilane/mineral oil solution was placed in a vacuum desiccator. A trap in the line between the desiccator and vacuum pump was filled with liquid nitrogen to prevent pump corrosion from vaporized fluorosilane. A vacuum was pulled on the desiccator for 30 min to remove any gaseous impurities in the fluorosilane/mineral oil solution. The glass slides were removed the DI water and blown dry with high-purity compressed nitrogen and placed onto a clean dry rack. The vacuum on the desiccator was slowly broken and the rack holding the glass slides was placed into the desiccator alongside the fluorosilane/mineral oil solution. A vacuum was pulled on the desiccator, now containing both the fluorosilane/mineral oil solution and the rack holding the glass slides, for 30 min. The desiccator was sealed and allowed to set for a minimum of 3 h to allow the deposition to react. Prior to experimental use, the slides were rinsed with (i) ethanol, (ii) DI water and dried with high-purity nitrogen gas.
A.2.2. APTES
Glass slides were sonicated (Ultrasonic Cleaner, model B2500A-DTH, VWR) for 20 min in water to remove solid particles from their surfaces and then immersed in piranha solution (70 % sulfuric acid/30 % hydrogen peroxide) for 20 min to remove any organic contaminants. The slides were then rinsed with DI water (purified by an Elga Ultra SC MK2, Siemens) and kept immersed until needed. The interior of a 400 ml staining dish and glass rack were rinsed with (i) soap, (ii) reverse osmosis (RO) water, (iii) ethanol and (iv) acetone, blown dry with compressed nitrogen and baked dry in the oven for 15 min. 200 ml of acetone, 8 ml of APTES and the glass rack were deposited in the cleaned staining dish. Each glass slide was blown dry with high-purity compressed nitrogen and set in the APTES/acetone solution on the glass rack. The slides were soaked for 20 min. After soaking, the slides were heated in the oven at  $85\,^{\circ }\textrm {C}$ for 20 min. Prior to experimental use, the slides were rinsed with (i) ethanol, (ii) DI water and dried with high-purity nitrogen gas.
A.2.3. PDMS
Silicon wafers were cut into  $1\ \textrm {cm}\times 1\ \textrm {cm}$ pieces and then immersed in piranha solution (70 % sulfuric acid/30 % hydrogen peroxide) for 20 min to remove any organic contaminants. The slides were then plasma cleaned (Harrick Plasma BASIC) at 18 W and 300 mmTorr for 30 min. The slides were then placed inside 20 ml borosilicate glass scintillation vials and wetted with DMS-T22 as received. The vials were then capped and baked in an oven at
 $100\,^{\circ }\textrm {C}$ for 24 h. Prior to experimental use the surfaces were rinsed with (i) toluene, (ii) acetone and (iii) DI water.
A.2.4. Super-hydrophobic Teflon
Teflon squares of size  $(1\ {\rm in.} \times 1\ {\rm in.} \times 0.125\ {\rm in.})$ were sanded with 240 grit sandpaper in all directions to produce a uniformly roughened surface. The edges of each square were lightly sanded to remove any roughness that would obscure experimental image acquisition. The squares were rinsed with RO water to remove any debris from sanding. Prior to experimental use, the squares were rinsed with DI water (purified by an Elga Ultra SC MK2, Siemens) and blown dry with air. This procedure was inspired by the work of Nilsson, Daniello & Rothstein (Reference Nilsson, Daniello and Rothstein2010).
A.3. Surface characterization
All surfaces were characterized using a Ramé–Hart goniometer. All CAs were measured using the secant method in DROPImageAdvanced.