
1. Introduction
With the rapid development of space exploration technology, atmospheric re-entry vehicle flight travels at an increasingly high velocity. At extremely high re-entry velocity, a strong bow shock forms ahead of the vehicle, producing a high-temperature thermal environment around the vehicle (Collen et al. Reference Collen, Satchell, Di Mare and Mcgilvray2022), as shown in figure 1, which presents the following features: (i) the characteristic time scales of flow, energy relaxation and chemical reactions are comparable, thus there are significant thermal and chemical non-equilibrium effects existing in the flow field (Anderson Reference Anderson2006). (ii) There exist frequent and complex collision interactions between particles in the flow field, such as vibrational excitation, dissociation, electronic excitation, ionization, etc. (Gnoffo Reference Gnoffo1999), leading to the non-equilibrium distribution of internal energy levels. (iii) Strong radiation occurs in the high-temperature re-entry flow field and changes the characteristics of the flow field and heat transfer. The radiative heating is comparable to or even exceeds the convective heating at high re-entry velocity (Gnoffo Reference Gnoffo1999). The thermochemical non-equilibrium flow, microscopic particle collision interactions and radiative transitions are tightly coupled, therefore, it is required to develop a complex multi-physics coupled model in order to better understand the non-equilibrium flow, heat transfer and radiation.
Schematic diagram of the complex physical and chemical processes occurring in the re-entry flow field.

At present there are many thermochemical non-equilibrium simulations on the aerothermodynamics of hypersonic re-entry vehicles (Sanderson et al. Reference Sanderson, Hornung and Sturtevant2004; Kim, Kang & Park Reference Kim, Kang and Park2020; Li et al. Reference Li, Zeng, Su and Wu2021; Miró Miró et al. Reference Miró Miró, Beyak, Pinna and Reed2021; Passiatore et al. Reference Passiatore, Sciacovelli, Cinnella and Pascazio2022; Wu et al. Reference Wu, Xu, Chen and Yang2022; Schramm, Hannemann & Hornung Reference Schramm, Hannemann and Hornung2023). In these numerical studies, the thermal non-equilibrium effect was described by the multi-temperature energy equations (Zheng et al. Reference Zheng, Wang, Mahbub Alam, Noack, Li and Chen2021). The two-temperature (2-T) model proposed by Park (Reference Park1985a) was the most widely used thermal non-equilibrium model (Guo et al. Reference Guo, Lin, Zhang, Bu and Li2019; Hornung, Gollan & Jacobs Reference Hornung, Gollan and Jacobs2022; Passiatore et al. Reference Passiatore, Sciacovelli, Cinnella and Pascazio2022). Recently, the 3-T, 4-T and 5-T models were applied in the numerical simulation to describe the relaxation processes among different energy modes in detail (Farbar, Boyd & Martin Reference Farbar, Boyd and Martin2013; Surzhikov Reference Surzhikov2016; Wu et al. Reference Wu, Xu, Chen and Yang2022). For the chemical non-equilibrium effect, the classic global chemical models of air, including the models developed by Park (Reference Park1993), Gupta et al. (Reference Gupta, Yos, Thompson and Lee1990) and Dunn & Kang (Reference Dunn and Kang1973), are usually employed in the chemical non-equilibrium numerical studies (Wang et al. Reference Wang, Yan, Zheng and Li2017b; Niu et al. Reference Niu, Yuan, Dong and Tan2018; Yan et al. Reference Yan, Fu, Wang, Yu and Li2022; Yang, Wang & Gao Reference Yang, Wang and Gao2022). The global chemical models treat the species as a whole and assume that the internal energy levels follow the Boltzmann distribution. These global chemical models require low computational cost, thus they are very convenient for coupling in two-dimensional (2-D) or three-dimensional (3-D) flow simulations. However, Wu et al. (Reference Wu, Xu, Chen and Yang2022) reported recently that an obvious difference exists for the mass fractions and temperatures predicted by different global chemical models under the same calculation conditions. Furthermore, these global chemical models assume that the internal energy levels follow a Boltzmann distribution, leading to a certain degree of error in non-equilibrium flow and radiation calculations (Johnston Reference Johnston2006).
In order to accurately assess the non-equilibrium distribution of excited energy levels, the collisional–radiative (CR) model has been developed in recent years to describe the chemical kinetics and radiation in the non-equilibrium flow field (Sun & Wang Reference Sun and Wang2014; Cheng, Wang & Sun Reference Cheng, Wang and Sun2016; Sun et al. Reference Sun, Wang, Mei, X and Bogaerts2017; Sun, Wang & Zhu Reference Sun, Wang and Zhu2020). The collisional–radiative model treats the vibrational and electronic energy states as individual species, and takes into account all relevant collisional and radiative processes among different species (Armenise & Kustova Reference Armenise and Kustova2013). Therefore, compared with the conventional thermochemical non-equilibrium models, the collisional–radiative model can more reasonably predict the energy relaxation processes, chemical non-equilibrium and excited energy levels non-equilibrium phenomena. At present, the collisional–radiative model is usually implemented in zero-dimensional (0-D) (Teulet, Sarrette & Gomes Reference Teulet, Sarrette and Gomes2001; Bultel et al. Reference Bultel, Chéron, Bourdon, Motapon and Schneider2006; Capitelli et al. Reference Capitelli2007; Annaloro & Bultel Reference Annaloro and Bultel2014) and one-dimensional (1-D) models (Panesi et al. Reference Panesi, Magin, Bourdon, Bultel and Chazot2009; Campoli et al. Reference Campoli, Kunova, Kustova and Melnik2020; Du et al. Reference Du, Sun, Tan, Zhou, Chen, Meng and Wang2022), but has not been used in multi-dimensional flow calculations so far due to its intensive computational cost, and some simplification methods, such as the multi-group maximum entropy method, were proposed for simplifying the CR model for future coupling to multi-dimensional computational fluid dynamics (CFD) simulation (Liu et al. Reference Liu, Panesi, Sahai and Vinokur2015; Munafo, Liu & Panesi Reference Munafo, Liu and Panesi2015; Munafo, Mansour & Panesi Reference Munafo, Mansour and Panesi2017; Sahai et al. Reference Sahai, Lopez, Johnston and Panesi2017, Reference Sahai, Johnston, Lopez and Panesi2019, Reference Sahai, Johnston, Lopez and Panesi2020; Sharma, Liu & Panesi Reference Sharma, Liu and Panesi2020). The 0-D calculations of the air collisional–radiative model for typical re-entry conditions indicated that the distributions of chemical species exhibit large differences from the results obtained by the global air chemical models (Bultel et al. Reference Bultel, Chéron, Bourdon, Motapon and Schneider2006; Annaloro & Bultel Reference Annaloro and Bultel2014). Based on the coupled calculation between 1-D flow and the electronically specific collisional–radiative model, Panesi et al. (Reference Panesi, Magin, Bourdon, Bultel and Chazot2009) found that the populations of high vibrationally and electronically excited states are much lower than the Boltzmann distribution in the non-equilibrium region. Therefore, a comprehensive air collisional–radiative model is established in this study to better describe the thermal non-equilibrium, chemical non-equilibrium and energy level non-equilibrium under the conditions of hypersonic vehicle atmospheric re-entry.
The collisional–radiative model should be fully coupled with the flow field and the radiative transfer model to better predict the characteristics of the flow field, wall heat flux and radiative properties of hypersonic re-entry vehicles, since the chemical species, temperatures and excited energy levels in the flow field strongly change the radiative properties of the gas, and the radiative transitions also have an important influence on the temperature and electronically excited levels populations. As pointed out in a review by Gnoffo (Reference Gnoffo1999), the accurate modelling of radiation and flow field–radiation coupling is one of the great challenges in aerothermodynamics numerical study. Some previous researchers have laid a good foundation for radiation coupling calculations of the hypersonic flow field (Scalabrin & Boyd Reference Scalabrin and Boyd2007; Farbar & Boyd Reference Farbar and Boyd2008; Feldick et al. Reference Feldick, Modest, Levin, Gnoffo and Johnston2009; Palmer et al. Reference Palmer, White and Alexander2010; Sohn et al. Reference Sohn, Li, Levin and Modest2012; Jo, Kwon & Kim Reference Jo, Kwon and Kim2020; Beyer, Pfeiffer & Fasoulas Reference Beyer, Pfeiffer and Fasoulas2022). The research of Jo et al. (Reference Jo, Kwon and Kim2020) performed the flow–radiation coupled simulation, which combined the conventional 2-T viscous shock layer equations with the radiative transfer model. In Jo et al.'s model, the flow analysis neglects the effect of excited states, i.e. assuming the Boltzmann distribution, however, the non-equilibrium excited energy level distributions in the radiation calculation are obtained by the quasi-steady state (QSS) model. Thus, the populations of species and excited energy levels in the flow field and radiative transfer calculations are inconsistent. In addition, the QSS approximation has been proved to be invalid in the non-equilibrium region just behind the shock and the near-wall non-equilibrium region (Johnston & Panesi Reference Johnston and Panesi2018). Scalabrin & Boyd (Reference Scalabrin and Boyd2007), Feldick et al. (Reference Feldick, Modest, Levin, Gnoffo and Johnston2009) and Palmer et al. (Reference Palmer, White and Alexander2010) combined the CFD codes with the well-known non-equilibrium air radiation code NEQAIR developed by Park (Reference Park1985b). However, these studies either did not consider flow–radiation coupling effects (Scalabrin & Boyd Reference Scalabrin and Boyd2007) or only considered energy coupling neglecting the radiation effect on species concentrations (Feldick et al. Reference Feldick, Modest, Levin, Gnoffo and Johnston2009; Palmer et al. Reference Palmer, White and Alexander2010). There is also some research on the radiation coupling calculations with the gas kinetic methods. Farbar & Boyd (Reference Farbar and Boyd2008) calculated the radiative heat flux by a unidirectional calculation from direct simulation Monte Carlo (DSMC) to NEQAIR. Sohn et al. (Reference Sohn, Li, Levin and Modest2012) developed a photon Monte Carlo radiative transport method, which only considered the energy coupling effect. Beyer et al. (Reference Beyer, Pfeiffer and Fasoulas2022) developed a photon Monte Carlo code PICLas for the calculation of radiative energy transfer, however, this model is currently only used for unidirectional computation from flow field to radiation.
To our knowledge, at present there is no self-consistent flow–collision–radiation fully coupled simulation. Therefore, a self-consistent non-equilibrium flow–collision–radiation fully coupled model is developed in this study, which combines a vibrationally and electronically specific collisional–radiative model, a 1-D stagnation line flow model and a radiative transfer model considering the detailed radiation mechanisms and non-local effect. Therefore, the populations of species and excited energy levels in the flow field and radiative transfer calculations are self-consistently obtained by the state-to-state model. Meanwhile, the fully coupled model considers the detailed energy states, the state-specific rate coefficients and elaborate energy relaxation between different energy modes, thus avoiding the additional approximate assumptions, such as the semi-estimated energy source terms. This fully coupled model is applied to the FIRE II (Cornette Reference Cornette1966; Cauchon Reference Cauchon1967) vehicle re-entry process analysis, aiming to provide insight into the coupling effects of non-equilibrium flow and non-local radiative transfer, and to accurately analyse the non-equilibrium flow characteristics, heat transfer and radiation for atmospheric re-entry. Section 2 of this paper gives a brief description of the high-temperature air collisional–radiative model, and § 3 describes the flow governing equations, radiative transfer equation and radiative transitions, and illustrate the coupling interactions between different models. The model validation and grid independence check are given in § 4. The non-equilibrium flow characteristics, wall heat flux, radiative properties and radiative transfer and flow–radiation coupling effect are presented and discussed in detail in § 5. Finally, concluding remarks are drawn in § 6.
2. High-temperature air collisional–radiative model
2.1. Species and states
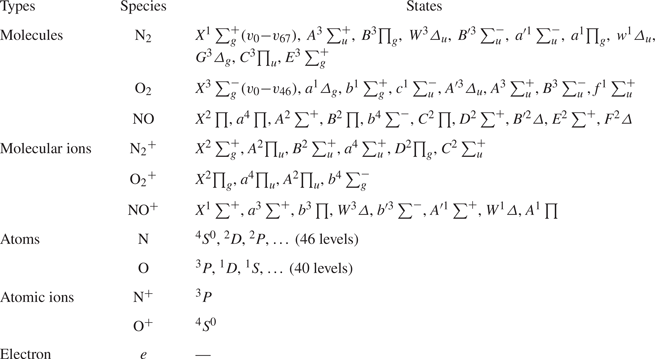
In the present work, a high-temperature air collisional–radiative model is established, which consists of N2 and O2 in the ground state, as well as in the vibrationally and electronically excited states, molecules NO and molecular ions  ${\textrm{N}_\textrm{2}}^ +$,
 ${\textrm{O}_\textrm{2}}^ +$, NO+ in the ground state and electronically excited states, atoms N and O in their ground state and electronically excited states, ground state atomic ions N+, O+ and electrons. In total, 248 various species states as well as electrons are involved in the air collisional–radiative model, as listed in table 1. Based on our previous study (Du et al. Reference Du, Sun, Tan, Zhou, Chen, Meng and Wang2022), the vibrationally and electronically excited states are critical for accurately evaluating the energy relaxations between different energy modes. Moreover, the transitions of electronically excited states of atoms N and O also play an important role on the radiative heating. Therefore, special attention is paid to accurately predicting the non-Boltzmann populations of electronically excited states of atoms. The CR model without considering the multivalent ions is valid for the flight regime with equilibrium temperatures below 20 000 K.
Species and relevant states included in the collisional–radiative model.

2.2. Collisional elementary processes
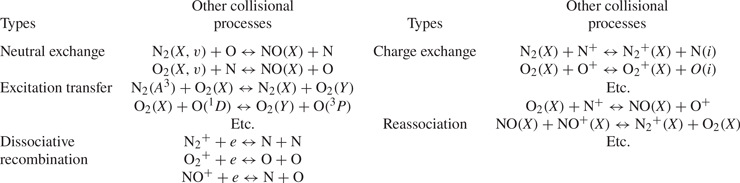
The relevant collisional processes between various species states include vibrational processes by electron and heavy-species impact, dissociation processes of molecules, electronic excitation and ionization processes of molecules and atoms and other collisional processes, comprising the neutral exchange, excitation transfer, dissociative recombination, associative ionization, charge exchange and reassociation processes. These different types of collisional elementary processes are listed in tables 6–9 in Appendix A. More details about these collisional processes can be found in our previous study (Du et al. Reference Du, Sun, Tan, Zhou, Chen, Meng and Wang2022).
For the vibrational processes of molecules  ${\rm N}_2(X^{1}\sum^{+}_{g})$ and
 ${\textrm{O}_2}\textrm{(}{X^3}\sum _g^ - )$, three kinds of vibrational excitation processes are considered: (i) vibrational excitation processes under molecule and atom impacts, i.e. VT-m and VT-a processes, (ii) vibrational transfer between different vibrational states, i.e. VV processes, (iii) vibrational excitation processes under electron impacts, i.e. Ve processes. The VT-m and VV processes only consider the single-quantum jumps, whose rate coefficients are taken from the experimental data and the calculated data by the trajectory method and Schwartz–Slawsky–Herzfeld theory (Armenise et al. Reference Armenise, Capitelli, Colonna and Gorse1996; Capitelli et al. Reference Capitelli, Ferreira, Gordiets and Osipov2001). The multi-quantum jumps of VT-a processes are involved in the CR model, and the related rate coefficients are obtained by the quasi-classical method (Esposito, Armenise & Capitelli Reference Esposito, Armenise and Capitelli2006; Esposito et al. Reference Esposito, Armenise, Capitta and Capitelli2008). The rate coefficients of Ve processes are calculated by the local complex potential model (Laporta, Celiberto & Wadehra Reference Laporta, Celiberto and Wadehra2012; Laporta & Bruno Reference Laporta and Bruno2013). Table 6 lists the vibrational processes involved in the CR model.
The molecular dissociation processes involved in the CR model are distinguished to two different cases: (i) the vibrational excitation-induced dissociation of N2(X, v) and O2(X, v), (ii) the dissociation of other molecules and molecular ions. The vibrational excitation-induced dissociation can be regarded as the result of vibrational excitation breaking the dissociation energy limit, which can be further divided into the dissociation under molecular impact (DVT-m), the dissociation under atomic impact (DVT-a), the dissociation under electron impact (DVe) and the dissociation under VV processes (DVV), and the selection of their rate coefficients is similar to that of vibrational processes (Annaloro & Bultel Reference Annaloro and Bultel2014). The relevant rate coefficients of dissociation processes of other molecules and molecular ions are obtained from the experimental data and theoretical calculations (Teulet, Sarrette & Gomes Reference Teulet, Sarrette and Gomes1999; Park Reference Park2008; Annaloro & Bultel Reference Annaloro and Bultel2014). The dissociation processes considered in the CR model are listed in table 7.
The excitation and ionization processes of molecules and atoms play decisive roles on the population of electronically excited states, so these different processes are considered in the CR model and listed in table 8. The relevant rate coefficients of molecules excitation and ionization processes can be found in Du et al. (Reference Du, Sun, Tan, Zhou, Chen, Meng and Wang2022) in detail. For the transitions between the ground state and metastable states of atoms, the rate coefficients are obtained from the Capitelli et al. (Reference Capitelli, Ferreira, Gordiets and Osipov2001) and Bultel et al. (Reference Bultel, Chéron, Bourdon, Motapon and Schneider2006). For the transitions among higher electronically excited states, the cross-sections proposed by Lotz (Reference Lotz1967) and Drawin (Reference Drawin1967) are adopted to derive the rate coefficients. The other collisional processes listed in table 9 are also very important for species variation and formation, for example, neutral exchange reactions are critical to the formation of atoms and nitrogen oxides, and associative ionization is crucial for the production of electrons. The detailed information about the forward rate coefficients of the above processes has been given in Du et al. (Reference Du, Sun, Tan, Zhou, Chen, Meng and Wang2022). The detailed balance principle is adopted to obtain the corresponding inverse reaction rate coefficients. In the present work, a set of more than 40,000 collisional elementary processes is involved in the CR model.
2.3. Radiative processes
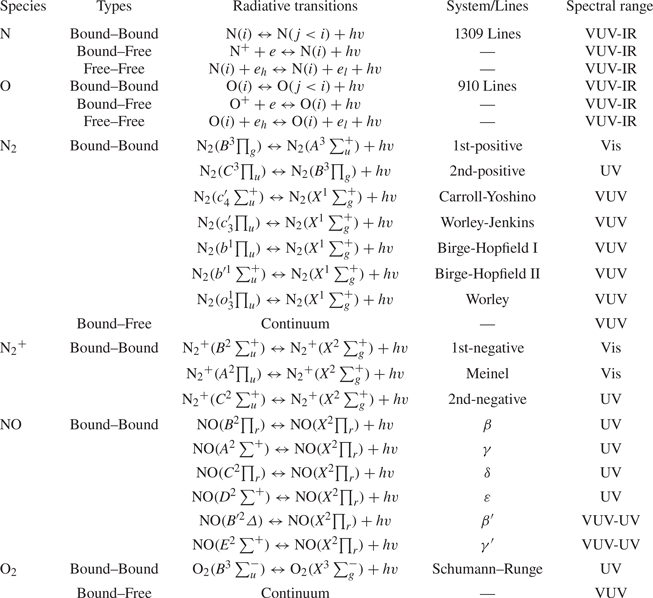
For the conditions of hypersonic vehicles re-entry, the radiative processes of air species are significant, exerting their influence on the chemical components and heat transfer in the flow field. The bound–bound, bound–free and free–free transitions of N and O are included in the CR model. In addition, the diatomic species N2, O2, NO and  ${\textrm{N}_\textrm{2}}^{+}$ are also considered as radiators in the CR model, and their bound–bound and bound–free transitions are taken into account. The radiative processes and relevant spectral information involved in the CR model are listed in table 10 in Appendix A, and their transition probabilities and radiation reabsorptions will be discussed in detail in § 3.
3. Stagnation line flow–radiation coupled model
3.1. Viscous shock layer equations
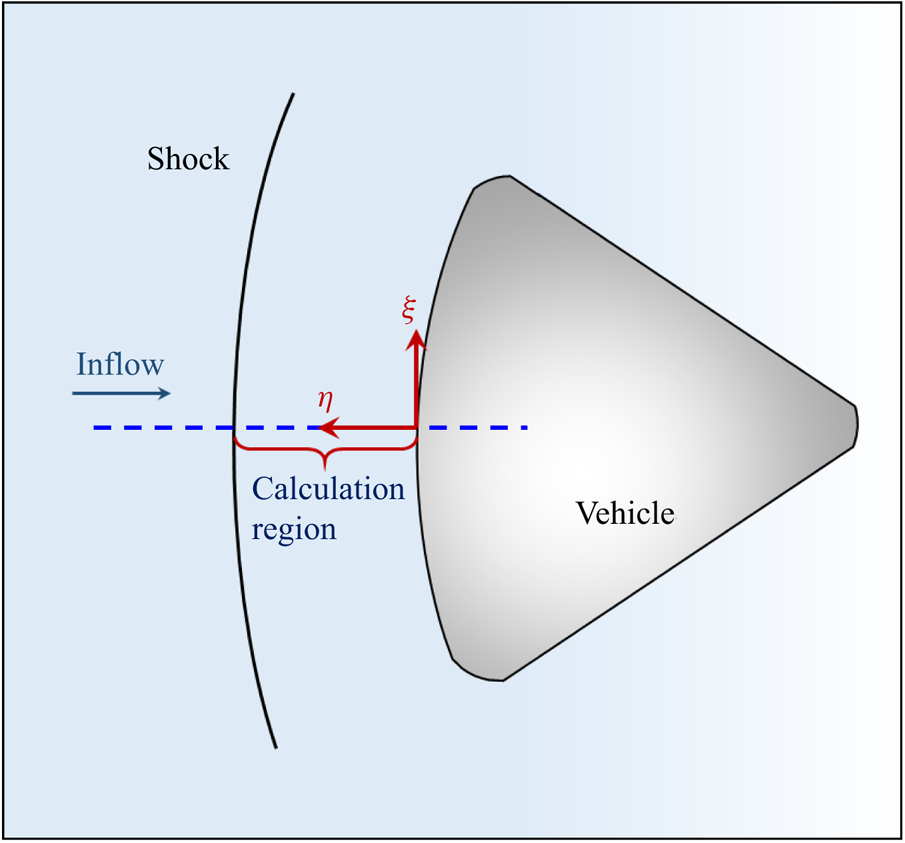
In this section the viscous shock layer (VSL) method (Davis Reference Davis1970; Gupta Reference Gupta1996) is employed to solve the governing equations of species density, flow velocity, translation–rotation energy and electron energy along the 1-D stagnation line, since it is impractical to include such a complex collisional–radiative model into the multi-dimensional computation domain. The VSL method is derived from the full Navier–Stokes equations, and valid for the continuum flow regime (for the FIRE II capsule, the flight height is limited to 85 km). The VSL method has been successfully applied in recent research to investigate the re-entry problems of hypersonic vehicles due to its lower computational cost (Noori, Ghasemloo & Mani Reference Noori, Ghasemloo and Mani2017; Jo et al. Reference Jo, Kwon and Kim2020). The VSL equations are written in a body-oriented coordinate system, as shown in figure 2, and the 1-D stagnation line computation domain is also given.
The schematic diagram of the coordinate system and 1-D stagnation line computation domain.

The VSL equations along the 1-D stagnation line are presented below.
The mass continuity equations for the species i
 \begin{equation}\rho v\frac{{\partial {c_i}}}{{\partial \eta }} ={-} \left( {\frac{{\partial {J_i}}}{{\partial \eta }} + \frac{2}{{{R_{nose}} + \eta }}{J_i}} \right) + {w_{c,i}} + {w_{r,i}},\end{equation}
where  $\rho $ is the gas density, v is the velocity normal to the body surface, ci is the mass fraction of the species i,
 $\eta $ is the coordinate normal to the body, Rnose is the body nose radius, Ji is the diffusion mass flux of the species i, calculated by the bifurcation diffusion model (Park, Jaffe & Partridge Reference Park, Jaffe and Partridge2001; Wang et al. Reference Wei, Wang, Murphy, Sun and Liu2017a) and wc,i and wr,i are respectively the collisional source term and radiative source term representing the net production rate of species i. Combined with the collisional–radiative model discussed in § 2, 249 mass continuity equations are considered in the model.
Due to the fact that the translational–rotational relaxation processes of molecules are very rapid, it is generally assumed that the rotational temperature of molecules is consistent with the translational temperature. Therefore, the translational–rotational temperature Ttr can be obtained by solving the translational–rotational energy equation of heavy particles
 \begin{align}
\rho {C_{p,tr}}v\dfrac{{\partial {T_{tr}}}}{{\partial \eta
}} - v\dfrac{{\partial p}}{{\partial \eta }} & ={-}
\dfrac{{{p_e}}}{\rho }v\dfrac{{\partial \rho }}{{\partial
\eta }} + \left\{ {\dfrac{\partial }{{\partial \eta
}}\left[ {{K_{tr}}\dfrac{{\partial {T_{tr}}}}{{\partial
\eta }}} \right] + \dfrac{2}{{{R_{nose}} + \eta
}}{K_{tr}}\dfrac{{\partial {T_{tr}}}}{{\partial \eta }}} \right\}\nonumber\\ & \quad - \sum\limits_{i\!{\ne} e}^{{N_S}}
{{J_i}C_{p,tr}^i\dfrac{{\partial {T_{tr}}}}{{\partial \eta
}}} - \sum\limits_{i\!{\ne} e}^{{N_S}} {{w_i}h_{tr}^i} +
{Q_{elas}} + {Q_{tr,inelas}},
\end{align}
where Cp,tr is the translational–rotational specific heat of mixture gas at constant pressure, p is the pressure, equal to the sum of the electron pressure pe and heavy-particle pressure ph, Ktr is the translational–rotational thermal conductivity of mixture gas,  $C_{p,tr}^i$ is the translational–rotational specific heat of the individual species i at constant pressure and
 $h_{tr}^i$ is the translational-rotational specific enthalpy of the individual species i. The specific heat and specific enthalpy of individual species and mixture gas are calculated by the statistical thermodynamic method. And the transport properties, including the thermal conductivity and viscosity, are derived from the curved-fitted collision integrals (Gupta Reference Gupta1996; Wei et al. Reference Wei, Wang, Murphy, Sun and Liu2013). Here, Qelas is the energy source term due to the elastic collisions between electrons and heavy particles, and Qtr,inelas is the heavy-particle translational–rotational energy source term caused by the inelastic collisions.
The electron temperature Te is obtained by solving the electron energy equation
 \begin{align}
\rho {C_{p,e}}v\dfrac{{\partial {T_e}}}{{\partial \eta }} &
= \dfrac{{{p_e}}}{\rho }v\dfrac{{\partial \rho }}{{\partial
\eta }} + \left\{ {\dfrac{\partial }{{\partial \eta
}}\left[ {{K_e}\dfrac{{\partial {T_e}}}{{\partial \eta }}}
\right] + \dfrac{2}{{{R_{nose}} + \eta
}}{K_e}\dfrac{{\partial {T_e}}}{{\partial \eta }}} \right\}\nonumber\\ & \quad - {J_{i = e}}C_{p,e}^{i =
e}\dfrac{{\partial {T_e}}}{{\partial \eta }} - {w_{i =
e}}h_e^{i = e} - {Q_{elas}} + {Q_{e,inelas}} -
Q_{rad}^{ff},
\end{align}
where Cp,e is the electron specific heat of mixture gas at constant pressure, Ke is the electron thermal conductivity of mixture gas, Qe,inelas is the electron energy source term resulting from inelastic collisions and  $Q_{rad}^{ff}$ is the radiative energy source term due to the free–free transitions.
The equation of state
 \begin{gather}p = {p_h} + {p_e},\end{gather}
 \begin{gather}{p_h} = \rho {T_{tr}}\left( {\sum\limits_{i\!{\ne} e}^{{N_S}} {{c_i}\frac{{{R_{univ}}}}{{{m_i}}}} } \right),\quad {p_e} = \rho {T_e}\left( {{c_e}\frac{{{R_{univ}}}}{{{m_e}}}} \right),\end{gather}
where Runiv is the universal gas constant.
It should be noted that the energy equations of the vibrational and electronic excitation modes of heavy particles do not require separate calculations because the collisional–radiative model treats each vibrationally and electronically excited state as an individual species. In addition to above equations, the global continuity equation, the conservation equations of normal momentum and tangent momentum and the calculation of shock stand-off distance are also involved in the present model, as given in the work of Gupta (Reference Gupta1996). The Rankine–Hugoniot equations are employed to determine the shock conditions, and a no-slip and fully catalytic wall boundary condition is applied in the present calculation. A spatial-marching and finite difference technique is used to solve the above equations, and a non-uniform grid, which is refined at the wall and shock boundary, is built for the calculation. The specific grid information and grid independence verification will be discussed in detail in § 4.
3.2. Radiative transfer model
In order to predict the radiation characteristics of the high-temperature flow field, a spatially and spectrally resolved radiative transfer (RTE) model is established in the present work. The high spectral resolution approach, line-by-line method, is adopted to calculate the spectral emission and absorption in the spectral range from the vacuum ultraviolet (VUV) to the infrared (IR) region. The present model includes the bound–bound, bound–free and free–free radiative transitions of N and O atomic species, as well as bound–bound and bound–free transitions of the N2, NO, O2, and  ${\textrm{N}_\textrm{2}}^ +$ molecules.
For the atomic bound–bound transitions, the exhaustive atomic line data such as line strengths and line positions are taken from the NIST atomic line database (Kramida, Ralchenko & Reader Reference Kramida, Ralchenko and Reader2018), and contain 1309 individual spectral lines among 261 energy levels for N and 910 lines among 234 energy levels for O. The wavelength-dependent emission coefficient for an atomic bound-bound transition from an upper state u to a lower state l is written as
 \begin{equation}\varepsilon _{\lambda ,ul}^{bb} = \frac{{{n_u}{A_{ul}}hc}}{{4{\rm \pi}{\lambda _{ul}}}}V(\lambda ),\end{equation}
where nu is the number density of upper state u, Aul is the radiative transition probability, h is the Planck constant, c is the speed of light, hc/λul is the energy difference in the transition and V(λ) is the line shape function. The absorption coefficients of the atomic bound–bound transitions are obtained by the Kirchoff law.
The line broadening of a spectral line is described by the line shape function V(λ), which combines the various broadening mechanisms, including the Doppler broadening, the natural broadening, the Stark broadening (Arnold et al. Reference Arnold, Cooper, Park and Prakash1979), the resonance broadening and the Van der Waals broadening. In the present work, the line shape function V(λ) is defined by the Voigt profile, which is the convolution of Gaussian and Lorentz line profiles (Park Reference Park1985b).
The atomic bound–free transitions occur when bound state atoms absorb high-energy photons and then ionize into ions and electrons, also known as photoionization
 \begin{equation}{\textrm{N}_i} + hv \to {\textrm{N}^ + } + e,\quad {\textrm{O}_i} + hv \to {\textrm{O}^ + } + e.\end{equation}
Only when the photon frequency is larger than the frequency corresponding to the ionization energy of the ith excited state atom does photoionization occur. The absorption cross-section  ${\sigma _{\lambda ,i}}$ is taken from the TOPbase data (Cunto et al. Reference Cunto, Mendoza, Ochsenbein and Zeippen1993; Johnston Reference Johnston2006), thus the absorption coefficient including the effect of induced emission can be written as
 \begin{equation}\kappa _{\lambda ,i}^{bf} = {\sigma _{\lambda ,i}}\left[ {{n_i} - {n_ + }{n_e}\frac{{{g_i}}}{{2{Q_ + }}}{{\left( {\frac{{{h^2}}}{{2{\rm \pi}{m_e}{k_B}{T_e}}}} \right)}^{1.5}}\,\textrm{exp}\left( {\frac{{hc{E_{ion,i}} - hc/\lambda }}{{{k_B}{T_e}}}} \right)} \right],\end{equation}
where ni, n+ and ne are the number densities of the ith excited state atom, ions and electrons, respectively, Q+ is the partition function of ions and Eion,i is the ionization energy of the ith excited state atom. The emission coefficient can be derived from the Kirchoff law.
For the atomic free–free transitions, the absorption cross-section proposed by Peach (Reference Peach1962) is employed to calculate the absorption coefficient
 \begin{equation}\kappa _{\lambda ,i}^{ff} = 1.368 \times {10^{ - 23}}{n_ + }{n_e}(1 + \xi ){\lambda ^3}T^{ - 0.5}_e.\end{equation}
The correction factor  $\xi $ is taken from the works of Peach (Reference Peach1962) as a function of photon energy and electron temperature. The emission coefficient of free–free transition is also derived from the Kirchoff law.
Diatomic bound–bound transitions are more complicated because there are many vibrational and rotational energy levels for each electronically excited state. The emission coefficient expression of a diatomic bound–bound transition is given below
 \begin{equation}\varepsilon _{\lambda ,ul}^{bb} = \frac{{{n_u}{A_{ul}}hc}}{{4{\rm \pi}{\lambda _{ul}}}}V(\lambda ).\end{equation}
The number density of the upper state nu is obtained based on the rotational and vibrational Boltzmann distribution for an electronically excited state. The position of central line is determined by
 \begin{equation}{\lambda _{ul}} = \frac{{hc}}{{(\mathrm{\Delta }{E_{elec,ul}} + \mathrm{\Delta }{E_{vib,ul}} + \mathrm{\Delta }{E_{rot,ul}})}},\end{equation}
where  $\mathrm{\Delta }{E_{elec,ul}}$,
 $\mathrm{\Delta }{E_{vib,ul}}$ and
 $\mathrm{\Delta }{E_{rot,ul}}$ are the energy difference of electronical, vibrational and rotational energy modes, respectively.
The radiative transition probability Aul of a single rotational line is expressed as
 \begin{equation}{A_{ul}} = \frac{{64{{\rm \pi}^4}}}{{3h{\lambda ^3}}}{(R_e^{v^{\prime}v^{\prime\prime}})^2}\frac{{S_{J^{\prime\prime}\varLambda ^{\prime\prime}}^{J^{\prime}\varLambda ^{\prime}}}}{{2J^{\prime} + 1}}.\end{equation}
Here,  $R_e^{v^{\prime}v^{\prime\prime}}$ is the electronic–vibrational transition moment, i.e. Frank–Condon factor. The values of
 $R_e^{v^{\prime}v^{\prime\prime}}$ are taken from the literature (Laux & Kruger Reference Laux and Kruger1992; Chauveau et al. Reference Chauveau, Perrin, Rivière and Soufiani2002). Also,
 $S_{J^{\prime\prime}\varLambda ^{\prime\prime}}^{J^{\prime}\varLambda ^{\prime}}$ is the rotational line strength function, and is calculated by the formulas in Earls (Reference Earls1935) and Kovacs (Reference Kovacs1972).
Diatomic bound–free continuum transitions considered in the present model are listed in table 10, which mainly produce the vacuum ultraviolet continuum spectroscopy. The related absorption cross-sections  ${\sigma _\lambda }$ are taken from Evans (Reference Evans1959) and (Kirby et al. Reference Kirby, Constantinides, Babeu, Oppenheimer and Victor1979).
After obtaining the absorption and emission coefficients, the spectral intensity  ${I_\lambda }$ is determined by solving the radiative transfer equation
 \begin{equation}\frac{{\textrm{d}{I_\lambda }}}{{\textrm{d}s}} = {\varepsilon _\lambda } - {\kappa _\lambda }{I_\lambda },\end{equation}
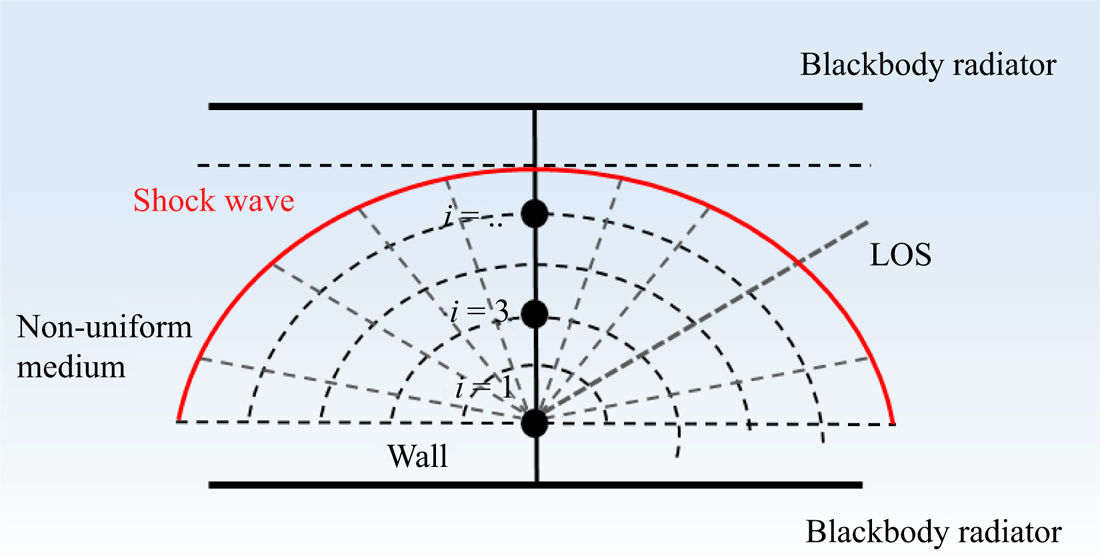
where s is the optical path along a line of sight. The RTE calculation involves a wide wavelength range, from 70 to 6200 nm, which is discretized into 613 001 wavelength points. A spherical cap model is adopted to calculate the radiative transfer equation along the stagnation line, as shown in figure 3. The radiative medium is considered non-uniform in the direction normal to the wall, and uniform in the tangential direction. Both sides of the medium are considered as black-body radiators. The spherical solid angle is discretized by  ${\rm \pi}$/18 rad elements, and the spatial discretization is consistent with the flow-field mesh.
The spherical cap model and spatial discretization for the calculation of the radiative transfer equation.

3.3. Flow–radiation coupling
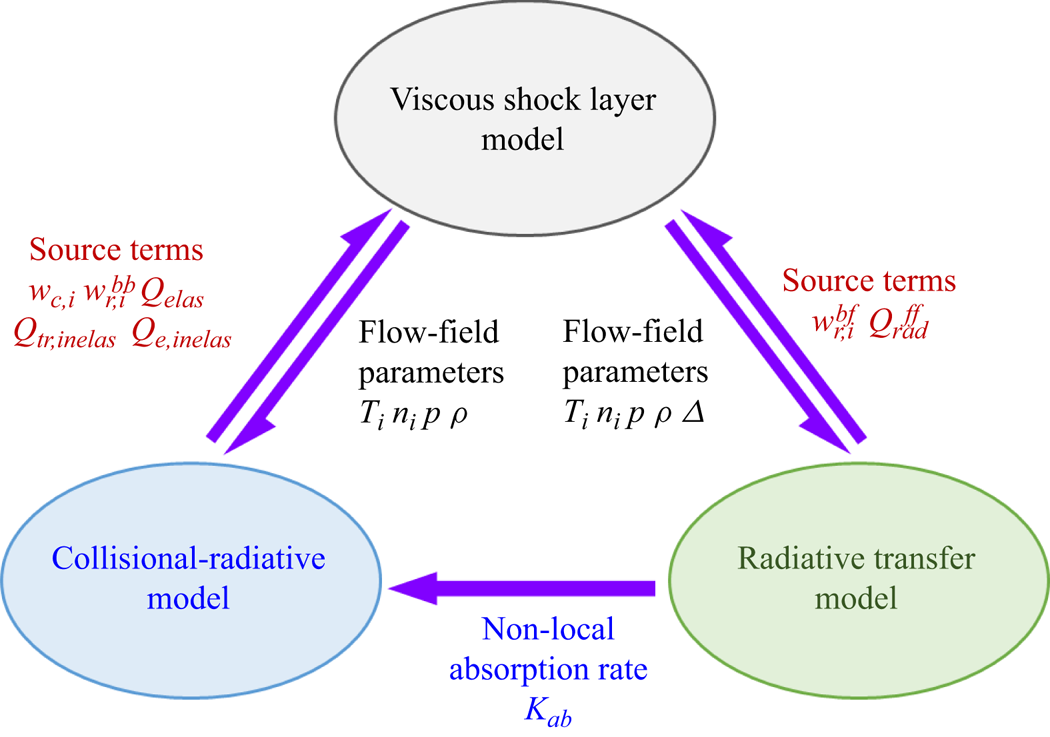
Figure 4 shows a schematic diagram of the flow–radiation coupled procedure between the VSL model, the collisional–radiative model and the radiative transfer model. In the present work, the flow-field parameters, including temperatures, number densities, pressure, etc., are obtained by solving the VSL model, and applied to the CR model and RTE model as the input parameters. Then, the mass source terms and energy source terms in (3.1)–(3.3) can be obtained by solving the CR model and RTE model, and transferred to the VSL model. The collisional mass source term of species i is expressed as
 \begin{equation}{w_{c,i}} = \sum\limits_{j = 1}^{{N_R}} {{\alpha _i}{R_j}} ,\end{equation}
where NR is the number of collisional processes,  ${\alpha _i}$ is the stoichiometric coefficient of species i in the jth process and Rj is the rate of the jth collisional process.
The coupling relation of the VSL model, CR model and RTE model.

The radiative mass source terms of species i caused by the bound–bound and bound–free transitions can be obtained by the following formulas respectively:
 \begin{gather}w_{_{r,i}}^{bb} = \sum\limits_{j = 1}^{i - 1} {\{ {K_{ab}}(j,i) - {A_{ij}}{n_i}\} } - \sum\limits_{j = i + 1}^m {\{ {K_{ab}}(i,j) - {A_{ji}}{n_j}\} } ,\end{gather}
 \begin{gather}w_{_{r,i}}^{bf} = \int_{{\lambda _{min}}}^{{\lambda _{max}}} {\left( {4{\rm \pi}\varepsilon_{\lambda ,i}^{bf} - \int_{4{\rm \pi}} {\kappa_{\lambda ,i}^{bf}{I_\lambda }\,\textrm{d}\varOmega } } \right)\frac{\lambda }{{hc}}\,\textrm{d}\lambda } .\end{gather}
Here, Kab(i, j) is the non-local absorption rate
 \begin{equation}{K_{ab}}(i,j) = \int_{{\lambda _{min}}}^{{\lambda _{max}}} {\left( {\kappa_{\lambda ,ij}^{bb}\int_{4{\rm \pi}} {{I_\lambda }\,\textrm{d}\varOmega } } \right)\frac{\lambda }{{hc}}\,\textrm{d}\lambda } .\end{equation}
In (3.14)–(3.16),  $\textrm{d}\varOmega $ represents an infinitesimal element of the solid angle.
The elastic collisional energy source term is expressed by
 \begin{equation}{Q_{elas}} = \sum\limits_{i\!{\ne} e} {3\frac{{{m_e}}}{{{m_i}}}{k_B}({T_e} - {T_{tr}}){n_e}{n_i}{{\left( {\frac{{8{k_B}{T_e}}}{{{\rm \pi} {m_e}}}} \right)}^{0.5}}{\sigma _{ei}}} ,\end{equation}
where  ${\sigma _{ei}}$ is the elastic collision section between the electron and the species i.
Depending on whether the electrons are involved in the collisional process, the inelastic collisional energy source term can be divided into Qtr,inelas and Qe,inelas, which are expressed as
 \begin{gather}{Q_{tr,inelas}} = \sum\limits_{j = 1}^{{N_R}} {{\psi _j}{R_j}} ,\quad \textrm{electrons}\;\textrm{not}\;\textrm{involved}\;\textrm{in}\;\textrm{the}\;j\textrm{th}\;\textrm{process,}\end{gather}
 \begin{gather}{Q_{e,inelas}} = \sum\limits_{j = 1}^{{N_R}} {{\psi _j}{R_j}} ,\quad \textrm{electrons}\;\textrm{involved}\;\textrm{in}\;\textrm{the}\;j\textrm{th}\;\textrm{process,}\end{gather}
where  ${\psi _j}$ represents the enthalpy change of the jth process.
It should be noted that the radiative energy loss due to the bound–bound and bound–free transitions is reflected in the number density changes of the electronically excited states of atoms, ions and electrons, thus the electronic excitation energy equation is not solved as a separate equation in the VSL model. Therefore, the radiative energy source term only involves the free–free transitions, which are added to the electron energy equation and expressed by
 \begin{equation}Q_{rad}^{ff} = \sum\limits_{i = N,O} {\left\{ {\int_{{\lambda_{min}}}^{{\lambda_{max}}} {\left( {4{\rm \pi}\varepsilon_{\lambda ,i}^{ff} - \int_{4{\rm \pi}} {\kappa_{\lambda ,i}^{ff}{I_\lambda }\,\textrm{d}\varOmega } } \right)\textrm{d}\lambda } } \right\}} .\end{equation}
These three models are coupled tightly and solved using the under-relaxation iteration method until this procedure converges.
The fully coupled model is applied to investigate FIRE II vehicle, a well-known flight experiment from the 1960s, whose primary objective is to define the radiative heating environment associated with the re-entry of a large-scaled Apollo vehicle at a velocity of 11.4 km s−1. For the FIRE II vehicle, when the flight Mach number is limited to 25–50 and the flight height is limited to 40–85 km, the flow is in a thermochemical non-equilibrium state (Du et al. Reference Du, Sun, Tan, Zhou, Chen, Meng and Wang2022). Thus, the non-equilibrium coupling model is applicable to the three typical trajectory points listed in table 2 of the present study.
Flight parameters of FIRE II trajectory points.

4. Model validation and grid independence check
In this section, the CR model, VSL model and RTE model are respectively validated by comparing with the experimental data or previous calculation results.
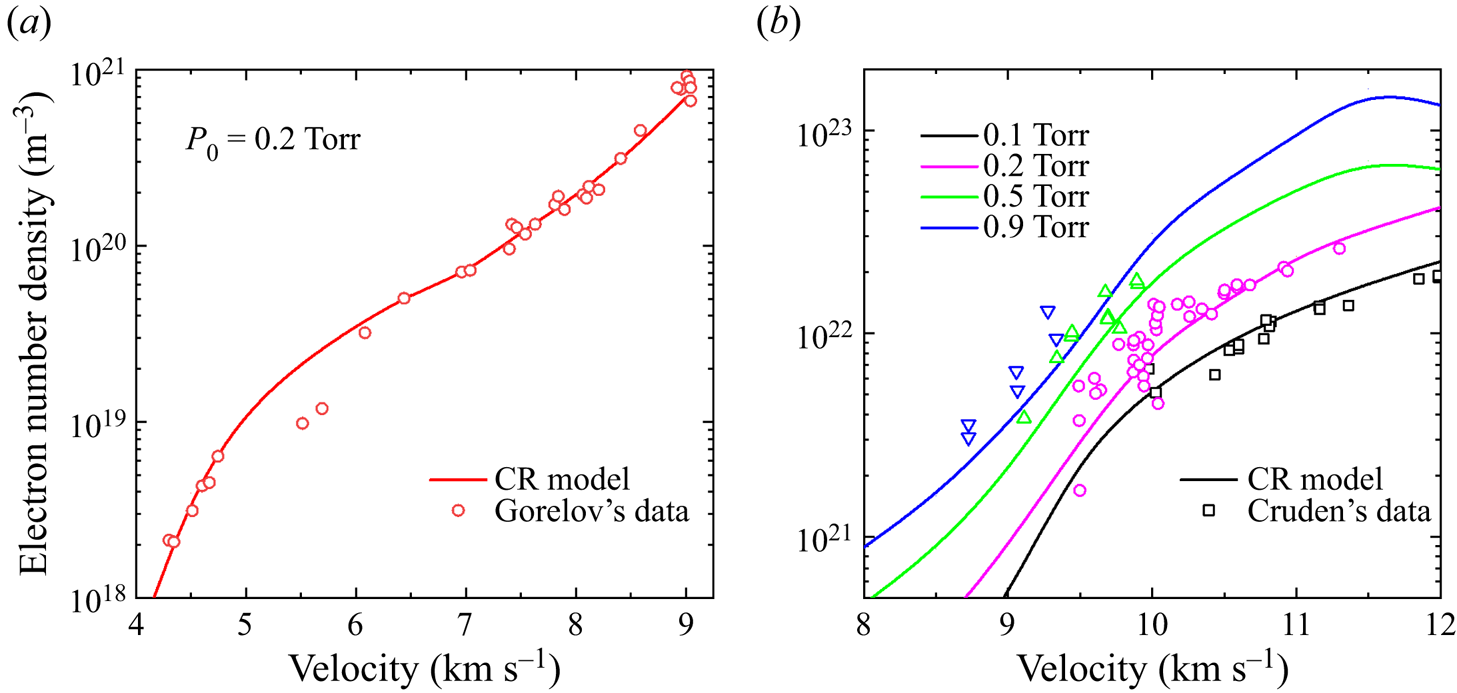
First, figure 5 presents a comparison of our calculation results with the measured electron number density of Gorelov (Reference Gorelov1981) and Cruden (Reference Cruden2012) in their air shock-tube experiments to validate our CR model. As shown in figure 5(a), reasonable agreement is reached in the shock wave velocity range from 4 to 9 km s−1 at P 0 = 26.7 Pa, T 0 = 300 K. In figure 5(b), the post-shock electron density is measured by a high-resolution spectrometer, with the shock wave velocity ranging from 8 to 12 km s−1 at pressures of 0.1, 0.2, 0.5, 0.9 Torr. The calculated results and measured values agree well in the shock wave velocity range from 4 to 12 km s−1 and pressure from 0.1 to 0.9 Torr. Therefore, this comparison validates the reasonableness of our CR model.
Comparison of the calculated results (lines) obtained by the CR model with measured electron density (symbols) behind the shock front.

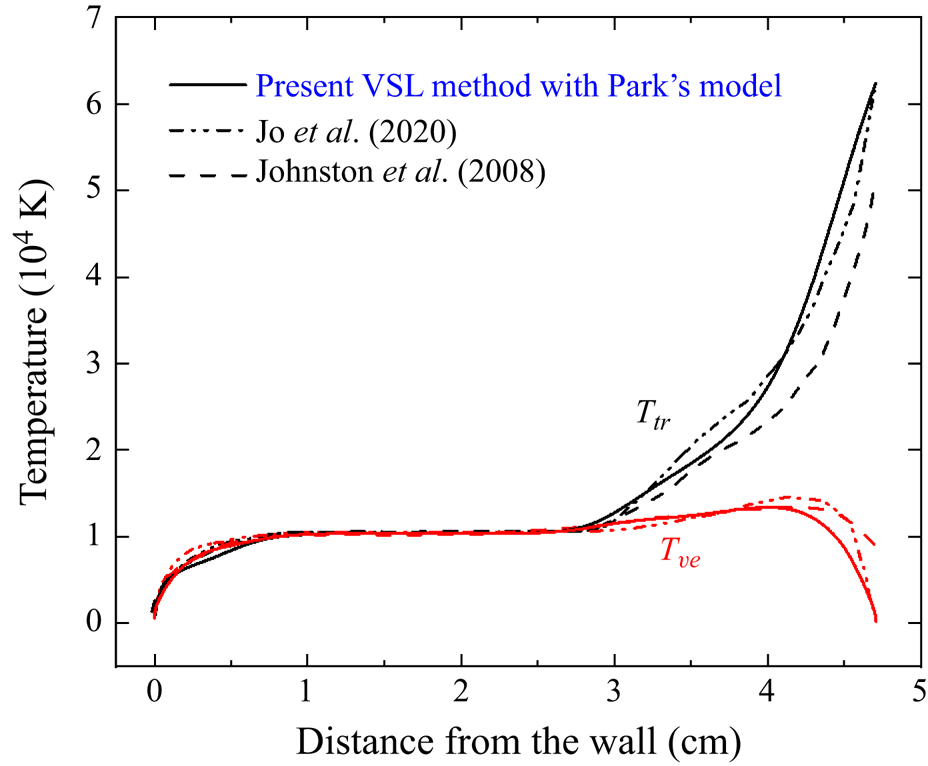
Then, the validation of VSL model is performed by comparing with the calculation results of Johnston, Hollis & Sutton (Reference Johnston, Hollis and Sutton2008) and Jo et al. (Reference Jo, Kwon and Kim2020). In order to be consistent with the model used in Johnston et al. (Reference Johnston, Hollis and Sutton2008), Jo et al. (Reference Jo, Kwon and Kim2020), Park's (Reference Park1993) thermochemical model is coupled with the VSL model in this comparison. Figure 6 exhibits the comparison of translational–rotational and vibrational-electron temperature evolution along the stagnation line for the 1634 s case. As shown in figure 6, the characteristic temperatures along the stagnation line are basically consistent with the results of Jo et al. (Reference Jo, Kwon and Kim2020) in both equilibrium and non-equilibrium regions. However, there exists a discrepancy between our results and Johnston's results in the non-equilibrium region, which is due to the shock-slip boundary condition used in their model. This comparison demonstrates that the VSL model established in this paper has the ability to predict the energy relaxation processes and flow characteristics along the stagnation line.
Comparison of calculated temperature profiles (solid line) with the results of Jo et al. (dot dash line) and Johnston et al. (dash line) along the stagnation line for the 1634 s case.

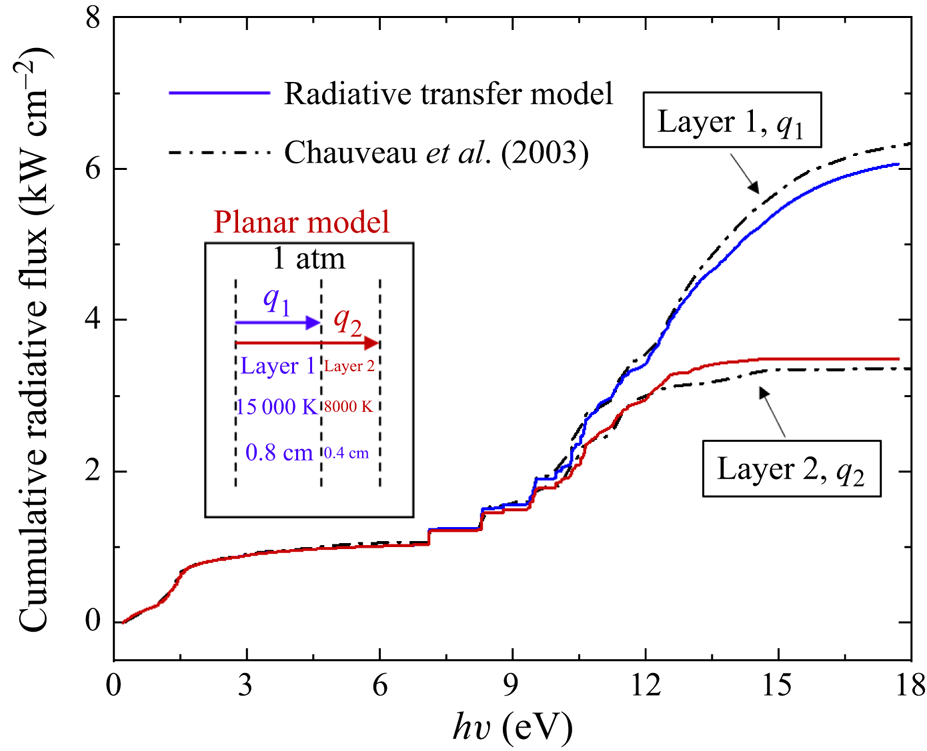
Finally, a radiation calculation is performed for a planar benchmark model to validate the radiative transfer model. As shown in figure 7, the planar model includes two layers of equilibrium air with temperatures of 15 000 and 8000 K, which approximately represent the inviscid region and the boundary layer around the vehicle during the earth re-entry, respectively. Figure 7 compares the distributions of cumulative radiative fluxes from the different layers with the results of Chauveau et al. (Reference Chauveau, Deron, Perrin, Rivière and Soufiani2003). The relatively low-temperature layer 2 at 8000 K strongly absorbs the radiative emission between 10 and 18 eV from the layer 1, thus the radiative flux q 2 at the exit of layer 2 is lower than q 1. A good agreement is found between our results and the data of Chauveau et al. (Reference Chauveau, Deron, Perrin, Rivière and Soufiani2003) in the whole spectral range, demonstrating that the radiative transfer model can reasonably calculate the radiative properties and radiative transfer of high-temperature air.
Comparison of cumulative radiative flux from the different layers with Chauveau's data for a planar benchmark model.

The grid independence is checked to exclude the impact of the mesh on the calculation results, especially the mesh close to the wall, which requires careful treatment. The wall mesh Reynolds number based on local parameters next to the wall is defined as
 \begin{equation}R{e_{cell}} = \frac{{{\rho _w}{c_w}\mathrm{\Delta }x}}{{{\mu _w}}},\end{equation}
where  ${\rho _w}$, cw and
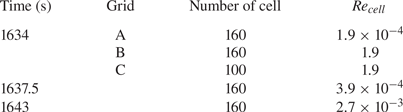
 ${\mu _w}$ respectively represent the density, speed of sound and viscosity of gas near the wall and Δx denotes the normal size of the first cell next to the wall. Table 3 lists the grid information for three cases of 1634, 1637.5 and 1643 s. In this table, the wall mesh Reynolds number Recell in all cases is less than 2. According to Men'shov & Nakamura (Reference Men'shov and Nakamura2000), when the value of Recell is less than 3, the accuracy of heat flux calculation can be guaranteed.
Grid information used for three FIRE II flight trajectory points.

Three different kinds of grids are chosen to perform grid independence study for the 1634 s case. Grid A has 160 grid cells with the finest wall mesh Δx = 5 × 10⁻¹⁰ m. Grid B also has160 grid cells and a relatively rough wall mesh Δx = 5 × 10⁻⁶ m. Grid C has 100 grid cells and a relatively rough wall mesh Δx = 5 × 10⁻⁶ m. The difference on the flow-field parameter distributions between different grids is insignificant, thus, for the 1634 s case, the results calculated with grid A are used for the later analysis. The grid independence studies for the other two cases are also implemented and the selected mesh is given in table 3.
5. Results and discussions
In this section, the non-equilibrium characteristics of the flow field are first analysed and discussed through the fully coupled simulation. Then, the heat-transfer process contributing to aerodynamic heating on vehicle surface is investigated, and decomposed and explained from the perspective of different physical mechanisms. Meanwhile, the radiative properties of gas and the radiative transfer inside flow field is discussed in detail. Finally, the flow–radiation coupling effects in the non-equilibrium flow field are analysed by comparing with the uncoupled and local coupled approach, indicating the significance of a non-local coupled calculation of the non-equilibrium flow and radiation.
5.1. Non-equilibrium characteristics of flow field
For the hypersonic flight of FIRE II, the flow field exhibits obvious non-equilibrium characteristics, including the thermal non-equilibrium, chemical non-equilibrium and energy level non-equilibrium, which are critical for the parameter distributions of the flow filed, wall heat flux and radiation process.
Figure 8(a) presents the distributions of different temperatures along the stagnation line for the 1634, 1637.5 and 1643 s cases in order to clearly see the thermal non-equilibrium effect existing in the flow field. Figure 8(b) exhibits the number density distributions of chemical species along the stagnation line for the 1634 s case, in which the results calculated by Saha equations are also shown to clearly see the chemical non-equilibrium effect existing in the flow field. The Saha equations (Colombo, Ghedini & Sanibondi Reference Colombo, Ghedini and Sanibondi2008) for obtaining the chemical equilibrium components are shown in Appendix B. For the convenient comparison of temperature evolutions at different trajectory points, the x-axis is set as a dimensionless number, which is defined as the ratio of the normal distance to the wall x and the calculated shock detachment distance  $\varDelta $, and the values of
 $\varDelta $ are listed in table 4. The vibrational temperature of molecules is derived from the populations of vibrational states based on the following expression:
 \begin{equation}{T_{{N_2},vib}} ={-} {{1.0}\Bigg/{\left\{ {{k_B}{{\left[ {\frac{\textrm{d}}{{\textrm{d}{E_{vib,v}}}}{n_{{N_2}(X,v)}}} \right]}_{lsl,v = 0{-}15}}} \right\}}},\end{equation}
where E vib,v is the vibrational energy of N2(X, v), and lsl means that the derivative is the slope of the least square line.
Distributions of different characteristic temperatures (a) and chemical species number density (b) along the stagnation line.

Shock detachment distance at different cases.

From the results for the 1634 s case, a rapid drop of translational–rotational temperature can be observed behind the shock front due to the vibrational excitation processes under impact of heavy particles, which transfer the translational–rotational energy into the vibrational mode. Therefore, the increase of vibrational temperature can be observed simultaneously in this stage. The electron temperature increases with a slower rate, caused by the vibrational deexcitation processes under impact of electrons, which transfer the energy to electrons. After this, because the rapid dissociation processes of molecular vibrational states result in the loss of translational and vibrational energies, their temperatures decrease and the number densities of N and O atoms rapidly increase. And then, at the high electron temperature, the electronic ground and excited states of N and O atoms ionize and produce the N+, O+ and electrons. The obvious difference between the number densities of species obtained by the fully coupled model and Saha equations can be seen in this stage, indicating that the chemical non-equilibrium effect exists in the flow field because the time of chemical reaction is equivalent to the flow time. After enough collisions, the thermal and chemical equilibrium states are reached. In the near-wall region, the temperatures gradually decrease to the wall temperature, and the number densities of charged species and atoms also drop due to the recombination processes. As shown in figure 8(a), the thermal non-equilibrium region behind the shock front covers 45 % of the whole flow field for the 1634 s case. By contrast, the thermal non-equilibrium relaxation processes are faster for the 1637.5 and 1643 s cases, and the thermal equilibrium is reached at  $x/\varDelta $ of 0.85 and 0.97, respectively. This is because the atmospheric density is higher, leading to more frequent collisions and faster energy relaxation for the 1637.5 and 1643 s cases. The results of different flight conditions indicate that the thermal non-equilibrium effect is significant for high altitude and high Mach number, whereas it is weak for low altitude and low Mach conditions.
The thermal non-equilibrium degree of the flow field can be represented by the ratio of vibrational relaxation time to the flow characteristic time (Teng et al. Reference Teng, Wang, Li and Chen2021; Passiatore et al. Reference Passiatore, Sciacovelli, Cinnella and Pascazio2022). Thus, the following Damköhler number is defined:
 \begin{equation}Da = \frac{{{t_{flow}}}}{{{t_{relax}}}},\end{equation}
where  $Da \ll 1$ denotes severe under-relaxation or even freezing, and
 $Da \gg 1$ indicates the equilibrium state.
The flow characteristic time tflow is determined by
 \begin{equation}{t_{flow}} = \frac{\varDelta }{{{u_S}}},\end{equation}
where us is the shock velocity.
Typical characteristic times of vibrational relaxation are respectively obtained by considering the nitrogen and oxygen vibrational relaxation processes (Xu, Wang & Chen Reference Xu, Wang and Chen2022)
 \begin{equation}{t_{v,{N_2}}} = {{1.0} \Bigg/ {\sum\limits_{\scriptstyle j = 1 \atop \scriptstyle j \!{\ne} e }^{{N_S}} {{R_{{N_2}({v_0} \to {v_1})}}{n_j}} }},\quad {t_{v,{O_2}}} = {{1.0} \Bigg/ {\sum\limits_{\scriptstyle j = 1 \atop \scriptstyle j \!{\ne} e}^{{N_S}} {{R_{{O_2}({v_0} \to {v_1})}}{n_j}} }},\end{equation}
where  ${R_{{N_2}({v_0} \to {v_1})}}$ is the rate coefficient of the vibrational–translational relaxation processes from the vibrational ground state to the first excited state under the impact of species j.
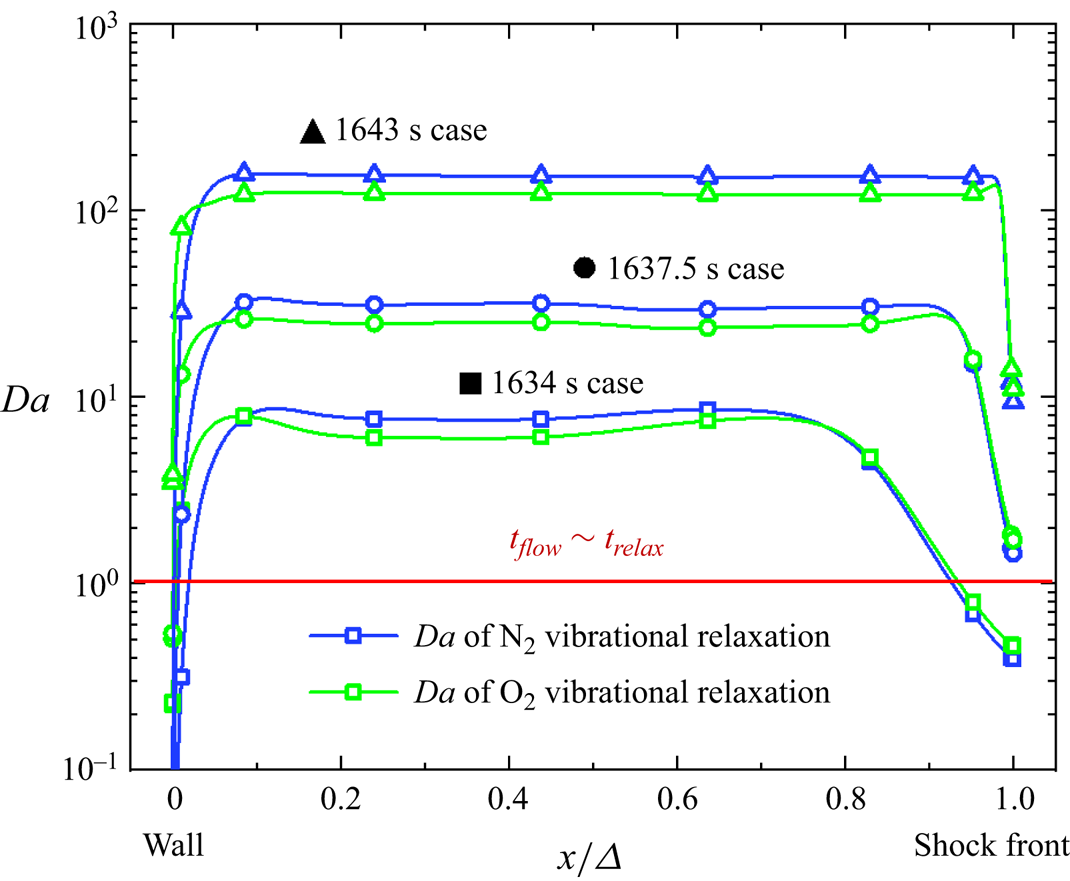
Figure 9 shows the spatial evolution of Damköhler numbers of the N2 and O2 vibrational relaxation processes along the stagnation line. As shown in figure 9, the evolution of  $D{a_{v,{N_2}}}$ and
 $D{a_{v,{O_2}}}$ exhibits a similar trend. Close to the shock wave and wall, the values of
 $D{a_{v,{N_2}}}$ and
 $D{a_{v,{O_2}}}$ are far less than one, meaning that there exist strong vibrational under-relaxation and non-equilibrium. Moreover, the value of
 $D{a_{v,{O_2}}}$ is greater than
 $D{a_{v,{N_2}}}$ near the shock wave and wall. This is because the lowest vibrational energy of O2 (0.19 eV) is lower than that of N2 (0.29 eV), the vibrational excitation of O2 is more likely to occur. With the development of flow, the value of
 $D{a_{v,{N_2}}}$ gradually increases, reflecting the weakening of the non-equilibrium effect of the flow field. Nevertheless, the value of
 $D{a_{v,{N_2}}}$ is relatively low, less than 10, indicating that the non-equilibrium effect on the flow field remains considerable. A sharp drop of
 $D{a_{v,{N_2}}}$ and
 $D{a_{v,{O_2}}}$ occurs near the wall because the low temperature causes the vibrational relaxation to almost freeze. Comparing with the 1634 s case,
 $D{a_{v,{N_2}}}$ and
 $D{a_{v,{O_2}}}$ for the 1637.5 and 1643 s cases are larger than 1 throughout the whole flow field, except at the position of wall, which explains the weaker non-equilibrium effect for the 1637.5 and 1643 s cases.
The spatial evolution of the Damköhler numbers of N2 and O2 vibrational relaxations along the stagnation line.

Besides thermodynamic and chemical non-equilibrium, there also exists obvious non-equilibrium in the internal energy levels of the particles, including the vibrationally and electronically excited energy levels. Figure 10 shows the populations of N2 vibrational energy levels and N atom electronic energy levels at different positions (symbols) and the corresponding Boltzmann distribution based on local temperature (solid lines) for the 1634 s case. For the N2 vibrational energy levels, the Boltzmann distribution is considered as
 \begin{equation}n_{{N_2},v = j}^{Blotz} = {n_{{N_2},v = 0}}\,\textrm{exp}\left( { - \frac{{{E_{vib,v = j}} - {E_{vib,v = 0}}}}{{{k_B}{T_{{N_2},vib}}}}} \right).\end{equation}
Similarly, the Boltzmann distribution for the N electronically excited energy levels is determined by
 \begin{equation}\frac{{n_{N,el = j}^{Blotz}}}{{{g_{N,el = j}}}} = \frac{{{n_{N,el = 1}}}}{{{g_{N,el = 1}}}}\,\textrm{exp}\left( { - \frac{{{E_{elec,el = j}} - {E_{elec,el = 1}}}}{{{k_B}{T_{N,elec}}}}} \right),\end{equation}
where  ${T_{N,elec}}$ is the local electronic excitation temperature calculated by the following formula:
 \begin{equation}{T_{N,elec}} ={-} {{1.0} \Bigg/ {\left\{ {{k_B}{{\left[ {\frac{\textrm{d}}{{\textrm{d}{E_{elec,el}}}}\left( {\frac{{{n_{N,el}}}}{{{g_{N,el}}}}} \right)} \right]}_{lsl,el = 1\sim 3}}} \right\}}}.\end{equation}
According to figure 10(a), near the shock front, i.e.  $x/\varDelta = 0.9$, the populations of both high vibrationally (Evib > 7 eV) and electronically excited energy levels (Eelec > 10 eV) are obviously lower than the Boltzmann distribution. At this position, the under-population of high vibrationally excited states is mainly caused by the high vibrational-induced dissociation rate. But the under-population of high-lying electronic states is related to the inadequate excitation. At the position
 $x/\varDelta = 0.7$, deviation from a Boltzmann distribution still occurs, which is due to the dissociation and ionization reactions of high vibrationally and electronically excited energy levels. When moving to the position of
 $x/\varDelta = 0.5$, there still exists small under-populations of high vibrationally and electronically excited energy levels. At the thermochemical equilibrium region, i.e.
 $x/\varDelta = 0.3$, the populations of both vibrationally and electronically excited energy levels completely follow the Boltzmann distribution. Approaching the wall, i.e.
 $x/\varDelta = 0.02$, due to the wall catalytic effect, both the high vibrationally and electronically excited energy levels are de-excited to the lower levels, resulting in their depletion.
Comparison of the populations of N2 vibrational energy levels (a) and N electronic energy levels (b) with the corresponding Boltzmann distribution (solid lines) at different positions for the 1634 s case.

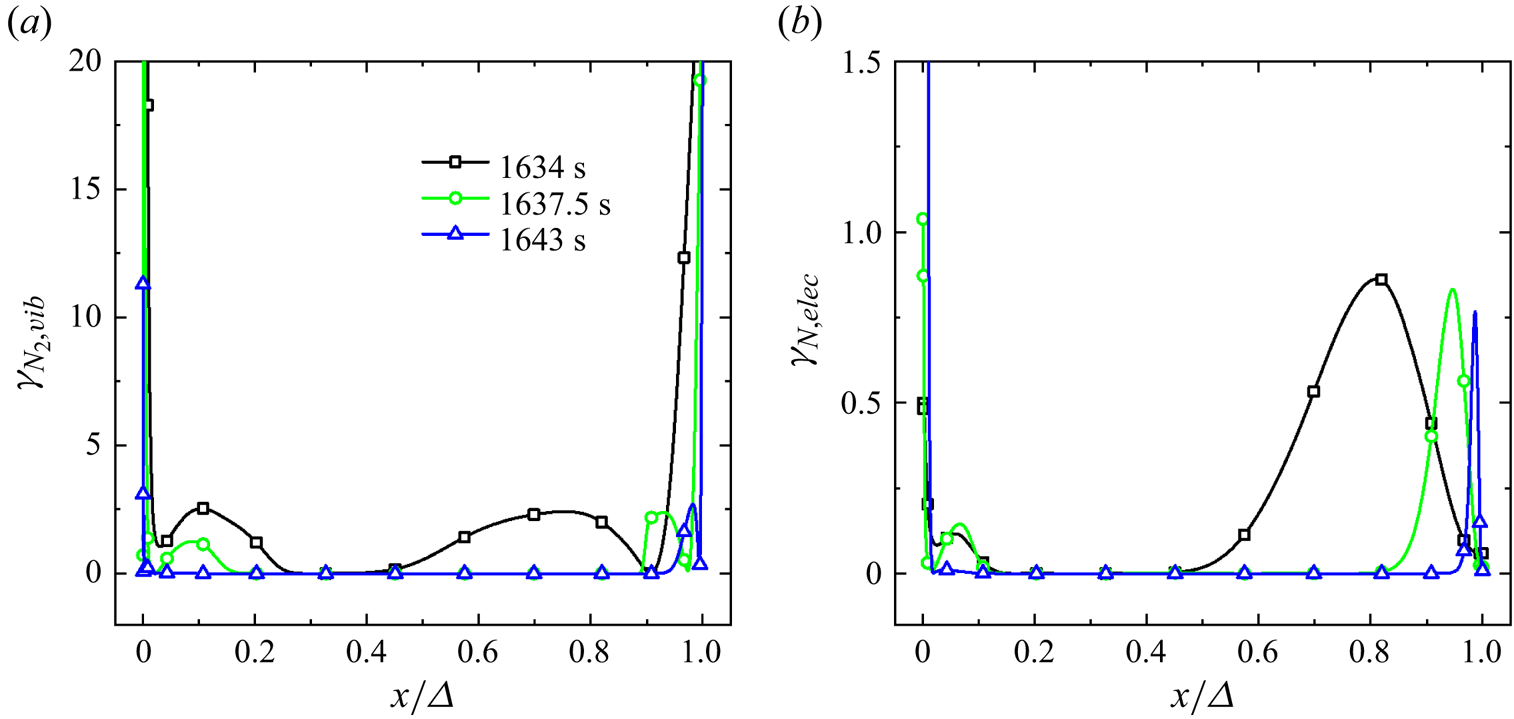
In order to better see the non-equilibrium evolution of internal energy levels, the deviation value γ between the actual excited energy level distribution and the Boltzmann distribution is defined as
 \begin{gather}{\gamma _{vib}} = \frac{{\displaystyle\sum\limits_{j = 0}^{{N_v}} {{{(\textrm{ln}({n_{v = j}}) - \textrm{ln}(n_{v = j}^{Boltz}))}^2}} }}{{{N_v}}},\end{gather}
 \begin{gather}{\gamma _{elec}} = \frac{{\displaystyle\sum\limits_{j = 1}^{{N_{el}}} {{{(\textrm{ln}({{{n_{el = j}}} / {{g_{el = j}}}}) - \textrm{ln}({{n_{el = j}^{Boltz}} / {{g_{el = j}}}}))}^2}} }}{{{N_{el}}}},\end{gather}
where Nv and Nel represent the number of energy states.
Figure 11 illustrates the spatial evolution of  ${\gamma _{{N_2},vib}}$ and
 ${\gamma _{N,elec}}$ along the stagnation line for three different cases. As shown in figure 11(a), at t = 1634 s, the vibrational energy level non-equilibrium degree
 ${\gamma _{{N_2},vib}}$ stays close to zero from
 $x/\varDelta = 0.25$ to 0.43. This indicates that the detailed balance between the dissociation and atomic recombination processes, vibrational excitation and de-excitation processes promotes the equilibrium of vibrational energy levels. However, in other regions, the value of
 ${\gamma _{{N_2},vib}}$ is obviously larger than zero, thus the vibrational energy level non-equilibrium exists. From the shock front to
 $x/\varDelta = 0.9$,
 ${\gamma _{{N_2},vib}}$ decreases from a large value to zero. This phenomenon is because the vibrational excitation processes lead to the accumulation of vibrational states, and the vibrational energy exchange processes (VV) promote the equilibrium distribution of vibrational energy levels. From
 $x/\varDelta = 0.9$ to 0.43, the vibrational non-equilibrium degree
 ${\gamma _{{N_2},vib}}$ rises again, which is due to the vibrational dissociation processes, leading to the depletion of high vibrationally excited states, as shown in figure 10(a). Near the wall, due to the dominant roles of atomic recombination and vibrational de-excitation processes, the evolution trend of
 ${\gamma _{{N_2},vib}}$ is opposite to that near the shock front. With the increase of flight time, the evolutions of
 ${\gamma _{{N_2},vib}}$ for cases 1637.5 and 1643 s present a similar trend as that at t = 1634 s, but the vibrational non-equilibrium region obviously decreases, thus the non-equilibrium effect of vibrational energy levels is weakened with the decrease of flight altitude and Mach number. For the electronic energy level non-equilibrium degree presented in figure 11(b), it is found that the non-equilibrium distribution of electronically excited energy levels mainly exists near the shock front and surface. Moreover, from the 1637.5 and 1643 s trajectory points, the non-equilibrium region on the electronic energy levels decreases as the increase of flight time.
The spatial evolution of  ${\gamma _{{N_2},vib}}$ (a) and
 ${\gamma _{N,elec}}$ (b) along the stagnation line.

These results in figures 10 and 11 clearly show that there exists a strong non-equilibrium effect of vibrational and electronic energy levels near the shock front and the wall at the high altitude and high Mach number conditions. According to the results in Du et al. (Reference Du, Sun, Tan, Zhou, Chen, Meng and Wang2022), the reaction processes related to vibrational states play an important role on the evolutions of the flow-field characteristics and heat transfer. Thus, it is essential to accurately model the non-equilibrium distribution of vibrational energy levels. Since the atomic species near the shock front and the wall has strong radiative emission and absorption capacities, the accurate modelling of non-equilibrium electronic energy levels has an important significance for radiation characteristics’ prediction of the flow field.
5.2. Analysis of heat flux and its components
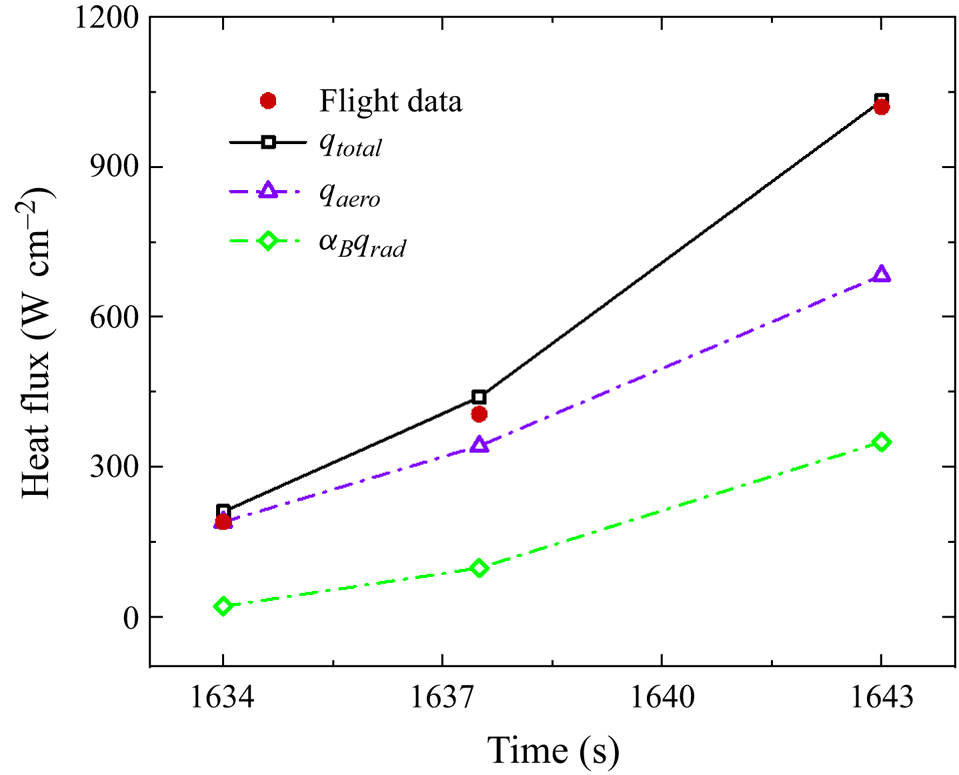
Besides the non-equilibrium characteristics of the flow field, the aerodynamic heating and its components, which are the most serious at the stagnation point, also can be obtained based on the fully coupled model. Figure 12 presents the variations of stagnation heat flux with the flight time. The total stagnation heat flux is composed of the following two parts:
 \begin{equation}{q_{total}} = {q_{aero}} + {\alpha _B}{q_{rad}},\end{equation}
where qaero, qrad and  ${\alpha _B}$ are the aerodynamic heat flux, radiative heat flux and the spectral absorptance of the beryllium calorimeter (Cauchon Reference Cauchon1967), respectively.
Variations of stagnation-point heat flux with the flight time.

As shown in figure 12, the calculated total heat flux shows good consistency with the flight data, the maximum error is not more than 10 %. Meanwhile, the present results are slightly higher than the flight data due to the implementation of fully catalytic wall conditions in the calculation, which may lead to an overestimation of component diffusion heat flux. Moreover, figure 12 shows that the total heat flux, the aerodynamic heat flux and the radiative heat flux increase as the flight time increases from 1634 to 1643 s. According to the inflow parameters given in table 2, there is a sharp increase in inflow density with a small decrease in flight velocity, so that the kinetic energy of the inflow gas is higher and the total heat flux transferred to the wall is larger.
In order to further clarify the heat-transfer process in the thermal boundary layer of hypersonic vehicle and understand the different heat-transfer mechanisms, the aerodynamic heat flux is transformed into the following Stanton number (Ren et al. Reference Ren, Yuan, He, Zhang and Cai2019) (the radiative heat flux will be discussed in § 5.3):
 \begin{equation}C{h_{aero}} = \frac{{{q_{aero}}}}{{{\textstyle{1 \over 2}}{\rho _\infty }V_\infty ^3}},\end{equation}
where  ${\rho _\infty }$ and
 ${V_\infty }$ are the density and velocity of inflow, respectively.
According to the different physical and chemical processes, this dimensionless number can be divided into the following several components:
 \begin{align}
C{h_{aero}} & = C{h_{conv,tr}} +
\overbrace{{C{h_{conv,vib}} + C{h_{conv,exc}} +
C{h_{conv,electron}}}}^{{C{h_{conv,vee}}}}\nonumber\\ & \quad + \underbrace{{C{h_{dif,tr}} + C{h_{dif,vib}} +
C{h_{dif,exc}} + C{h_{dif,elecron}}}}_{{C{h_{dif,int}}}}\,+\,C{h_{dif,dis}} + C{h_{dif,ion}},
\end{align}
where
 \begin{gather}C{h_{conv,j}} = \frac{1}{{{\textstyle{1 \over 2}}{\rho _\infty }V_\infty ^3}}{k_j}\frac{{\partial {T_j}}}{{\partial \eta }},\quad j = \textrm{tr},\;\textrm{vib},\;\textrm{exc},\;\textrm{electron,}\end{gather}
 \begin{gather}C{h_{dif,k}} = \frac{1}{{{\textstyle{1 \over 2}}{\rho _\infty }V_\infty ^3}}\sum\limits_{i = 1}^{{N_S}} {\rho {D_i}{h_{k,i}}\frac{{\partial {c_i}}}{{\partial \eta }}} ,\quad k = \textrm{tr},\;\textrm{vib},\;\textrm{exc},\;\textrm{electron,}\end{gather}
 \begin{gather}C{h_{dif,dis}} = \frac{1}{{{\textstyle{1 \over 2}}{\rho _\infty }V_\infty ^3}}\left[ \begin{array}{@{}l@{}} \sum\limits_{i = N,{N^ + }.} {\rho {D_i}\dfrac{{\partial {c_i}}}{{\partial \eta }}\dfrac{{{D_{{N_2}}}}}{2}} + \sum\limits_{i = O,{O^ + }.} {\rho {D_i}\dfrac{{\partial {c_i}}}{{\partial \eta }}\dfrac{{{D_{{O_2}}}}}{2}} \\ \quad + \sum\limits_{i = NO,N{O^ + }.} {\rho {D_i}\dfrac{{\partial {c_i}}}{{\partial \eta }}\left( {\dfrac{{{D_{{N_2}}}}}{2} + \dfrac{{{D_{{O_2}}}}}{2} - {D_{NO}}} \right)} \end{array} \right],\end{gather}
 \begin{gather}C{h_{dif,ion}} = \frac{1}{{{\textstyle{1 \over 2}}{\rho _\infty }V_\infty ^3}}\sum\limits_{i = ions.} {\rho {D_i}\frac{{\partial {c_i}}}{{\partial \eta }}{I_i}} .\end{gather}
Here, Chconv,tr, Chconv,vib, Chconv,exc and Chconv,electron are the convective terms caused by the gradients of translational–rotational energy, vibrational energy, electronic excitation energy and electron energy, respectively; Chdif,tr, Chdif,vib, Chdif,exc and Chdif,electron are the corresponding component diffusive terms; Chdif,dis and Chdif,ion are the dissociation diffusive term and ionization diffusive term, respectively.
Figure 13 displays the evolution of the aerodynamic heating Stanton number and its five different components along the stagnation line (near the wall) under different flight conditions. It is shown that Chaero increases as the distance from the wall decreases, indicating the enhancement of the heat-transfer process. Among the several components, Chconv,tr and Chdif,dis play dominant roles in the wall heat transfer; Chconv,tr presents a significant increase near the wall due to the steep gradient of translational-rotational temperature and Chdif,dis first rises with the decrease of the distance from the wall due to the increase of atomic species, which relates to electron–ion recombination and gas compression, and then declines close to the wall because the atoms are recombined into molecules. The contribution of Chdif,ion to wall heat transfer is insignificant, while it shows an obvious peak in the region that  $x/\varDelta $ greater than 0.1, where the number densities of ions are still large, especially for the 1634 s case. However, from figure 13(b,c), it is found that the contribution of Chdif,ion is reduced with the increase of flight time, since the ionization reactions become weak at low flight altitudes and Mach numbers. The contributions of Chconv,vee and Chdif,int are relatively low in our study. As presented in figure 13(d), the value of the Stanton number significantly drops with the flight time, indicating that a lower percentage of energy is transfered to the vehicle surface. Meanwhile, for the 1637.5 and 1643 s cases, the rise of the Stanton number occurs much closer to the vehicle surface.
Evolution of different Ch numbers along the stagnation line for the cases of 1634 s (a), 1637.5 s (b), 1643 s (c) and comparison of Ch numbers for the different cases (d).

5.3. Radiative property and radiative transfer
Accurate prediction of radiation characteristics of the flow field is very important for the thermal protection system, stealth design and target tracking in hypersonic vehicles. In this section, the radiative property and radiative transfer of the flow field is determined by fully coupled calculation and in-depth analysis is carried out.
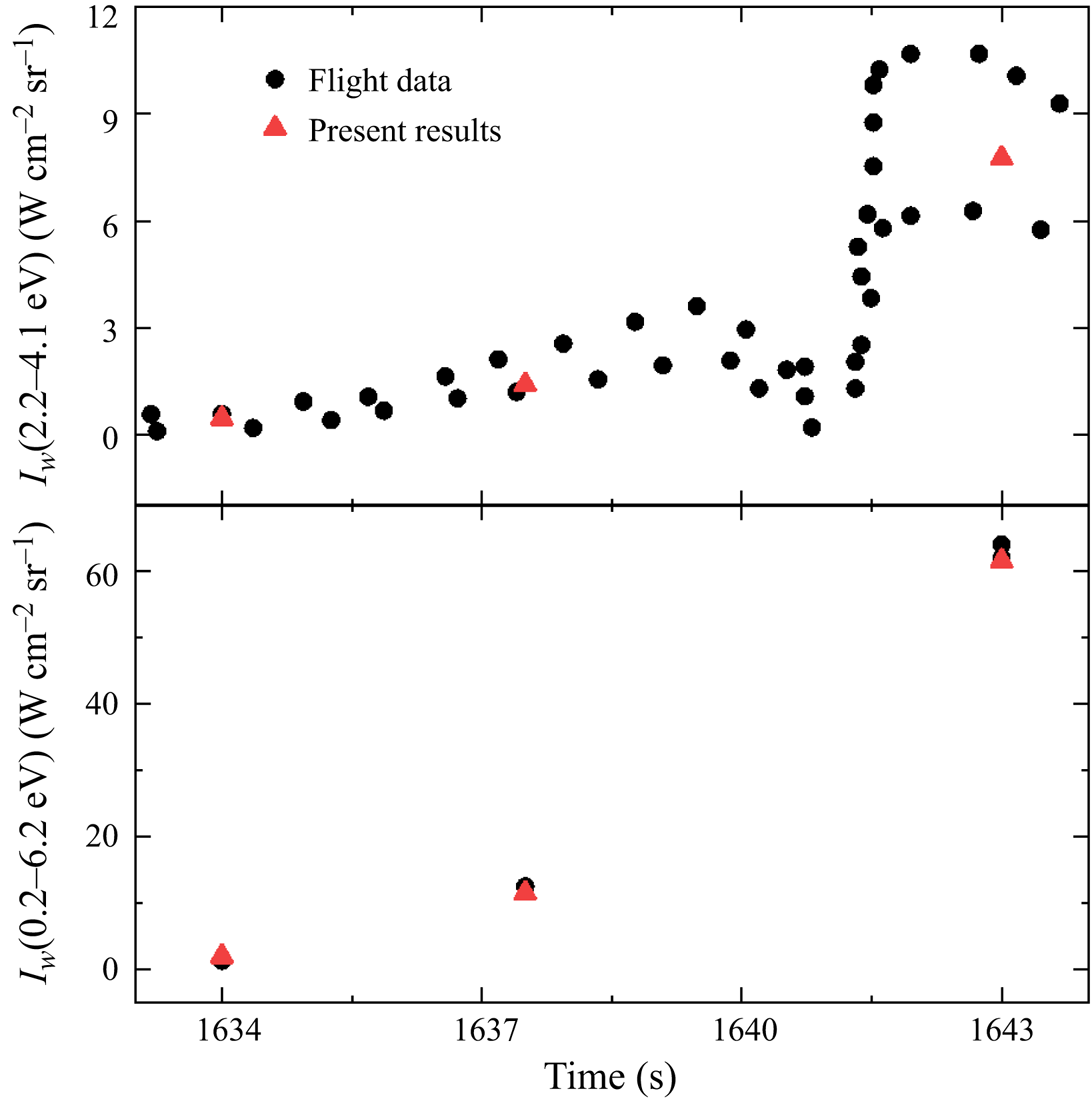
Figure 14 compares the calculated wall radiative intensity with the flight data in the spectral ranges of 2.2–4.1 and 0.2–6.2 eV, which are measured by two spectral radiometers installed at the stagnation position of the FIRE II vehicle (Cornette Reference Cornette1966; Cauchon Reference Cauchon1967). In the 2.2–4.1 eV range, the measured radiative intensity includes the upper and lower limits of experimental results. It can be seen that the wall radiative intensity gradually rises with the increase of flight time, except for the decrease at t = 1640.5 s due to the separation of the outermost beryllium heat shield. The calculated wall radiative intensity in the spectral range of 2.2–4.1 eV locates between the upper and lower limits of the experimental data. In the 0.2–6.2 eV range, the calculated results are in reasonable agreement with the flight data. Therefore, the comparisons presented in figure 14 indicate that the fully coupled model can reasonably predict the stagnation-point radiative intensity.
Comparison of the calculated wall radiative intensity with the flight data.

Figure 15 shows the calculated emission and absorption coefficients over a wide spectral range with different radiative mechanisms. As shown in figure 15, the atomic bound–bound lines can be divided into two groups. One is located in the IR and visible (Vis) ranges, in which the emission coefficients are below 103, and is mainly related to the transitions between high-lying states (electronic excitation energy above 10 eV). The second group of atomic lines lies in the VUV range, in which the emission coefficients are basically larger than 103, and even reach up to 106 for individual lines. These atomic bound–bound lines are mainly related to the transitions from high-lying states to the electronically ground and metastable states. For the atomic photoionization radiation, the low-lying states of the N and O atoms are the main radiators and relevant transitions are located in the VUV range, with emission coefficients in the range from 1 to 103. The atomic free–free transitions are mainly located in the low-energy IR range. Compared with the radiative coefficients of the atomic transitions, the emission and absorption capacities of molecular bands are relatively weak, and the first positive and second positive bands of N2, the first negative band of  ${\textrm{N}_\textrm{2}}^ +$ and N2 molecular band in the VUV range make a relatively large contribution to the emission coefficients of the molecular system.
Distributions of emission and absorption coefficients at  $x/\varDelta = 0.5$ for the 1634 s case.

Figure 16 presents the spectrally resolved radiative intensity profile along the stagnation line for the 1634 s case. It is found that significant differences exist in the spatial evolution of the radiative intensity at different photon frequencies. For the transitions with photon energy below 6.2 eV, the radiative intensity increases rapidly in the post-shock non-equilibrium region, then remains almost constant in the subsequent region. Its absorption effect is negligible in the whole flow field. The radiative intensity in the IR range is relatively high, reaching up to 103 W cm−2 μm−1 sr−1 for individual lines, which are associated with low-energy atomic spectral lines occurring between the high-lying states. For the VUV radiation, its intensity exhibits two strong absorption regions in the post-shock non-equilibrium region and the wall boundary layer, which are caused by the radiative absorption of high-energy atomic transitions, molecular VUV bands and photoionization processes. Moreover, the radiative intensity in the VUV range is very high and can even reach up to 104 W cm−2 μm−1 sr−1 for individual atomic lines.
Spectrally resolved radiative intensity profile along the stagnation line for the 1634 s case.

After obtaining the radiative intensity of the whole flow field, the radiative transfer flux can be calculated by the following formula:
 \begin{equation}{q_{rad}} = \int_{{\lambda _{min}}}^{{\lambda _{max}}} {{q_\lambda }\,\textrm{d}\lambda } = \int_{{\lambda _{min}}}^{{\lambda _{max}}} {\int_\varOmega {{I_\lambda }\,\textrm{cos}\,\theta \,\textrm{d}\varOmega \,\textrm{d}\lambda } } ,\end{equation}
where  ${q_\lambda }$ is the radiative flux at wavelength
 $\lambda $, calculated by integrating the radiative intensities along rays with a tilt angle of
 $\theta = 0{-}90^\circ$ relative to the normal. Figure 17 shows the spatial evolution of the radiative transfer flux and radiative transfer source terms along the stagnation line for the 1634 s case. The total radiative transfer source term Srad caused by different radiative processes is given as
 \begin{equation}{S_{rad}} = {S_{ABB}} + {S_{ABF}} + {S_{AFF}} + {S_{MBB}} + {S_{MBF}},\end{equation}
where SABB represents the atomic bound–bound transition source term, SABF is the atomic bound–free source term, SAFF is the atomic free–free source term, SMBB and SMBF are respectively the molecular bound–bound and the molecular bound–free source terms. The total radiative transfer source and atomic bound–bound source are respectively determined by
 \begin{gather}{S_{rad}} = \frac{{\textrm{d}{q_{rad}}}}{{\textrm{d}s}} = \int_{{\lambda _{min}}}^{{\lambda _{max}}} {\int_\varOmega {\textrm{cos}\,\theta \frac{{\textrm{d}{I_\lambda }}}{{\textrm{d}s}}\,\textrm{d}\varOmega } \,\textrm{d}\lambda } = \int_{{\lambda _{min}}}^{{\lambda _{max}}} {\int_\varOmega {\textrm{cos}\,\theta [{\varepsilon _\lambda } - {\kappa _\lambda }{I_\lambda }]\,\textrm{d}\varOmega } \,\textrm{d}\lambda ,}\end{gather}
 \begin{gather}{S_{ABB}} = \int_{{\lambda _{\textrm{min}}}}^{{\lambda _{max}}} {\int_\varOmega {\textrm{cos}\,\theta [\varepsilon _\lambda ^{ABB} - \kappa _\lambda ^{ABB}{I_\lambda }]\,\textrm{d}\varOmega } \,\textrm{d}\lambda } ,\end{gather}
where  $\varepsilon _\lambda ^{ABB}$ and
 $\kappa _\lambda ^{ABB}$ represent, respectively, the emission and absorption coefficients caused by the atomic bound–bound transitions.
The spatial evolution of wall directed radiative transfer flux (a) and the radiative transfer sources (b) for the 1634 s case.

From figure 17(a), the evolution of the total radiative flux can be clearly divided into four stages. The first stage corresponds to the region from the shock position to  $x/\varDelta = 0.86$, where the total radiative flux increases rapidly to 28.8 W cm−2. The main increase occurs in the VUV range, and the radiative fluxes in the UV and IR ranges slightly increase. The corresponding total radiative transfer source in this region as shown in figure 17(b) has a maximum peak of 38 W cm−3. It can be seen that the N atomic lines make a dominant contribution to the increase of the radiative flux, and the O atomic lines and molecular transitions also slightly contribute to the rise of radiative flux. The electronic excitation processes under the impact of heavy particles play a key role in this range, leading to the formation of high-lying states of molecules and atoms, which exhibit extremely strong radiative emission ability. After the rapid rise, the total wall directed radiative flux show an obvious fall trend in the region from
 $x/\varDelta = 0.86$ to 0.62, which is caused by the decrease in the VUV range. Meanwhile, the radiative flux in the IR, Vis and UV ranges in this stage slightly increases. This phenomenon can be explained from the radiative transfer source term in figure 17(b). In this region the total radiative transfer source term becomes negative due to the strong radiative absorption of the VUV spectrum by the N and O atomic lines. The molecular bound–bound transitions present positive values in this region, responsible for the slight rise of radiative flux in the IR and Vis ranges. The third stage corresponds to the region from
 $x/\varDelta = 0.62$ to 0.18, where the total wall directed radiative flux steadily increases to 36.8 W cm−2, which is mainly caused by the increase of radiative flux in the VUV and IR ranges. As shown in figure 17(b), the increase of radiative flux is dominated by the emission of the N atomic lines and atomic bound–free transitions, and the contribution of molecular radiation is negligible. In the final region from
 $x/\varDelta = 0.18$ to the wall, the total radiative flux decreases to 27.9 W cm−2. From figure 17(b), in the region from
 $x/\varDelta = 0.18$ to 0.08, the radiative absorption of the VUV spectrum by N atomic lines is the key factor for this decrease, while in the region from
 $x/\varDelta = 0.08$ to the wall, the radiative absorption by the molecular band is the main reason for the fall off of radiative flux. The radiative flux reaching the wall is 27.9 W cm−2, in which the proportions in the VUV, IR, UV and Vis spectra are respectively 69.3 %, 18.3 %, 8.6 % and 3.8 %. Therefore, the reduction of wall radiative heat transfer can be achieved by using VUV-reflecting/scattering materials in the forehead of vehicle.
5.4. Coupling effect between flow field and radiation
In this section the coupling effect between the flow field and radiation is thoroughly evaluated based on the present coupled model. The fully coupled calculation of flow and radiation is difficult, as shown in (3.14)–(3.16), (3.20), and not only depends on the spatial- and frequency-dependent emission and absorption coefficients but also on the spectral intensity. So most previous studies used the uncoupled approach or simplified coupled methods, such as the local radiative absorption assumption, to describe the radiative coupling effects, such as the optical thin assumption, in which the radiation escape factor is set to 1, meaning that all emitted photons are not reabsorbed. These above uncoupled or local coupled assumptions cannot fully take into account the spatial and optical frequency dependence of radiative absorption. The present coupled model has the ability to evaluate the non-local real radiative absorptive effect, which varies with space and optical frequency, thus accurately evaluating the coupling effect between the flow field and radiation.
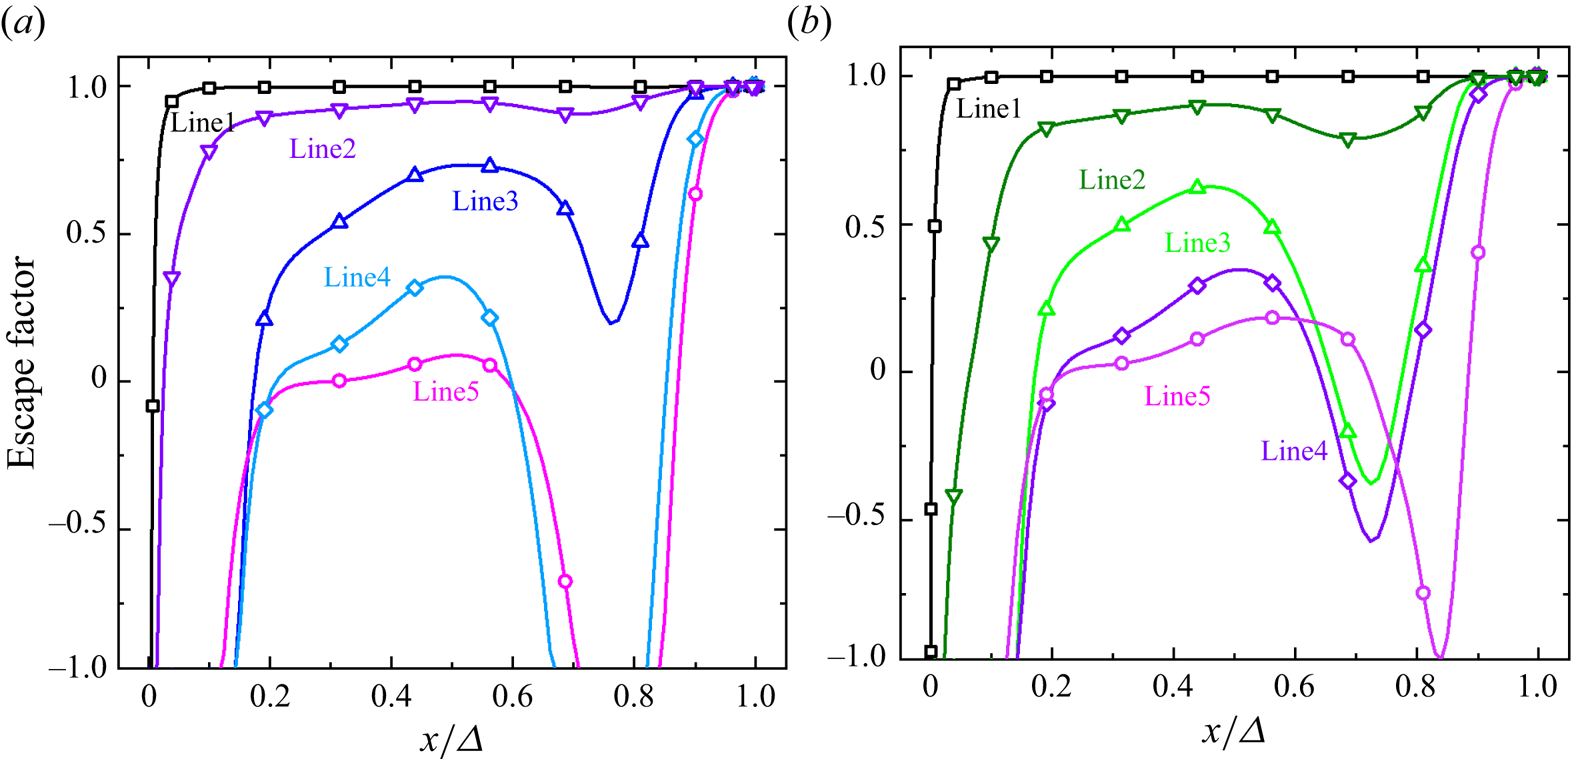
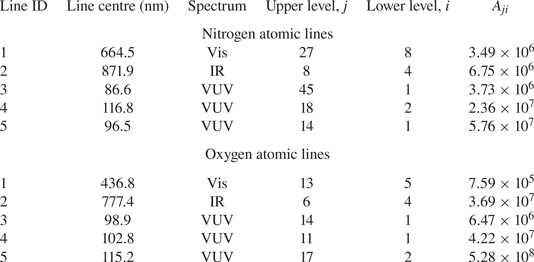
Figure 18 illustrates the escape factors  ${\varLambda _{ij}}$ considering non-local absorption for the spectral lines listed in table 5, which are obtained by the following formula:
 \begin{equation}{\varLambda _{ij}} = 1 - \frac{{{K_{ab}}(i,j)}}{{{A_{ji}}}}\frac{{{n_i}}}{{{n_j}}}.\end{equation}
The spatial evolution of escape factors considering non-local absorption for the nitrogen atomic lines (a) and oxygen atomic lines (b) listed in table 5.

Detailed information of selected atomic lines.

As shown in figure 18, different from the uncoupled or local coupled approaches, the actual escape factors change with spatial positions and vary from negative values to a maximum of 1. The negative escape factor indicates that the absorption of this spectral line exceeds its emission, which cannot be evaluated by the commonly adopted local absorption assumptions. Moreover, the non-local escape factors are closely related to the wavelength of the spectral lines. For the spectral lines located in the visible and infrared spectral ranges, their escape factors are close to 1 except for the near-wall region, where strong absorption occurs. The escape factors of the spectral lines in the VUV range are much lower than 1, and even below 0, indicating that these spectral lines have strong radiative absorptivity. The results in figure 18 show that the conventional local optical absorption assumptions fail to assess the non-local radiative absorption effects within the flow field.
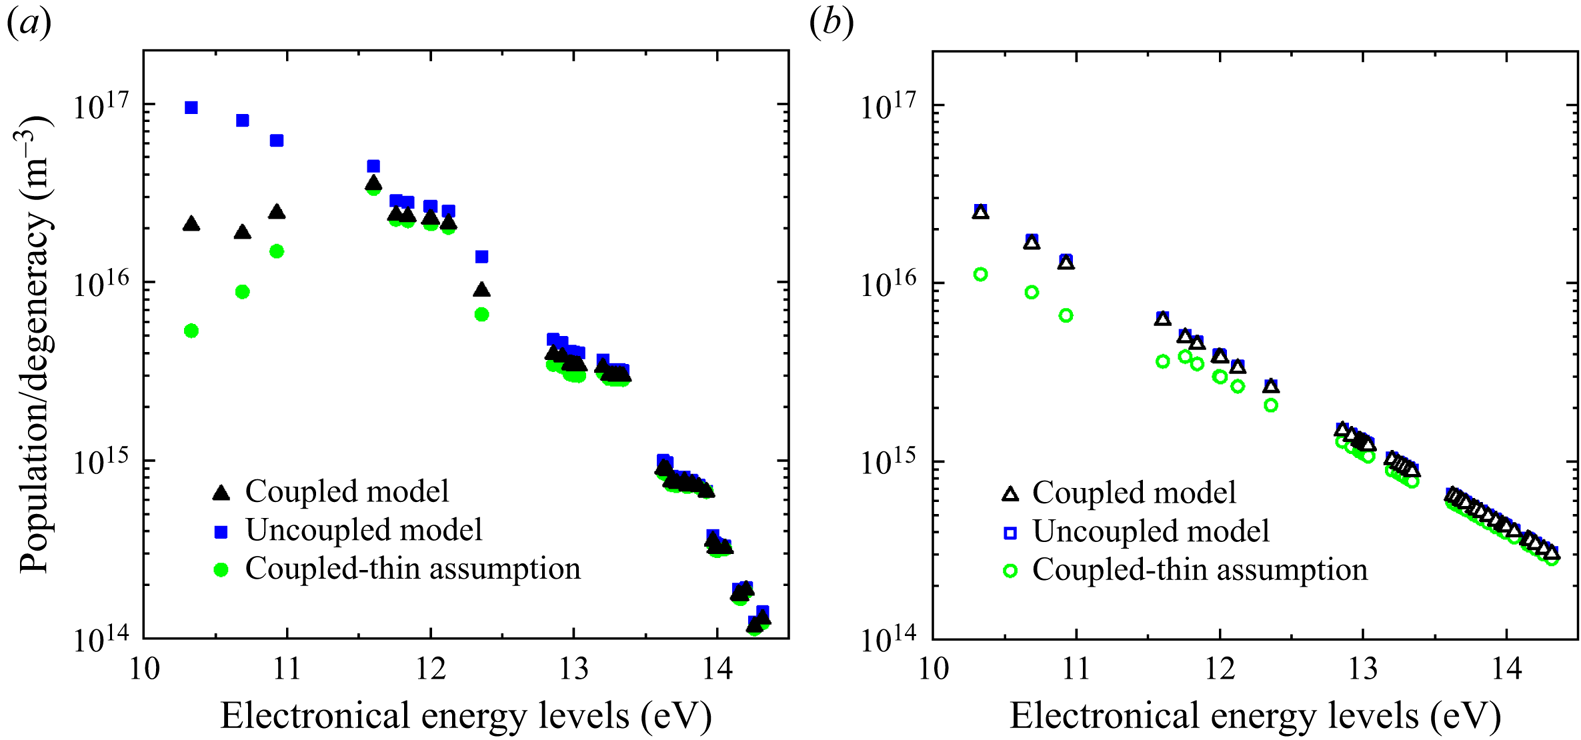
Figure 19 compares the distributions of high-lying electronically excited states for N atoms at  $x/\varDelta = 0.9$ and 0.5 predicted by the present non-local coupled model, uncoupled model and optically thin assumption. At
 $x/\varDelta = 0.9$, i.e. the strong non-equilibrium region after the shock wave, there exists large difference for the high-lying electronically excited states among the three different models. This phenomenon is because the uncoupled model ignores the decrease of high-lying states caused by radiative emission, while the optically thin assumption overestimates this drop. As seen from figure 19(b), the populations of electronically excited states at
 $x/\varDelta = 0.5$ predicted by the non-local absorption coupled model are almost identical to those calculated by the uncoupled approach, and slightly higher than those acquired with the optically thin assumption. This is because the frequent collisional processes can effectively fill in the changes in electronically excited energy levels caused by the radiation.
Distributions of electronically excited energy levels for N atoms at  $x/\varDelta = 0.9$ (a) and
 $x/\varDelta = 0.5$ (b).

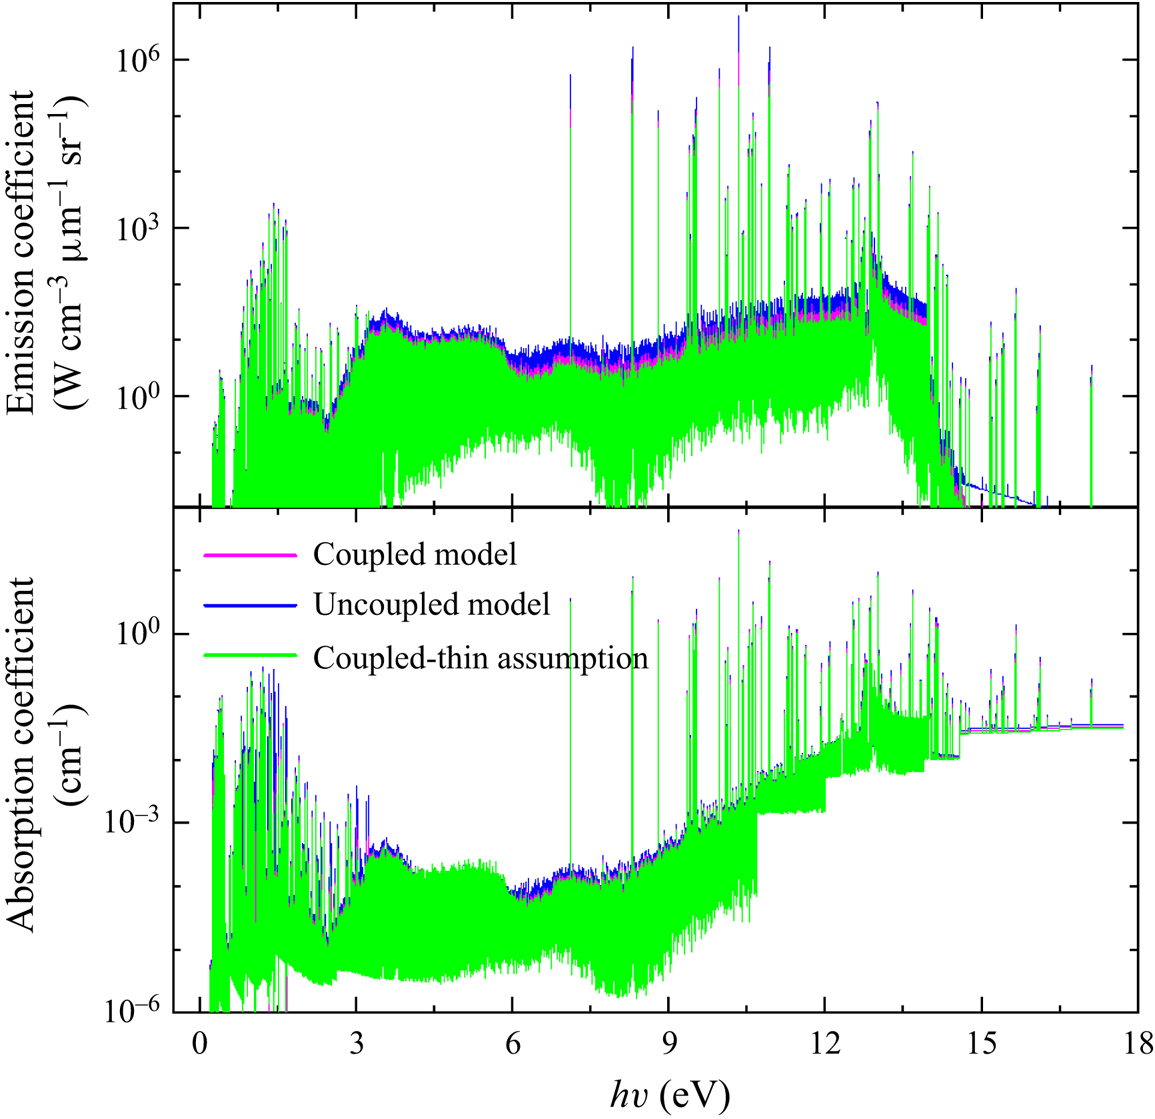
The above results suggest that the non-local absorption coupling effect has a significant influence on the distribution of electronically excited states, especially in the non-equilibrium flow-field region. Since the gas radiative properties and radiative transfer process strongly depend on the distribution of electronically excited states, the discrepancy caused by the radiative absorption effect could in turn have an influence on the radiative transfer. Figure 20 exhibits the gas radiative emission and absorption coefficients predicted by different approaches at  $x/\varDelta = 0.9$. It is found that the emission and absorption coefficients predicted by the uncoupled model are the highest in the whole spectral range, and the radiative coefficients predicted by the non-local absorption coupled model lie between the optically thin assumption and uncoupled model.
The emission and absorption coefficients of gas at  $x/\varDelta = 0.9$.

Figure 21 compares the wall directed radiative flux and the spectral intensity at the stagnation point predicted by the present non-local coupled model, uncoupled method and optically thin coupled model. In the non-equilibrium region behind the shock front, the uncoupled model predicts the highest peak of 59 W cm−2, which is almost twice that calculated by the non-local coupled model. Approaching the equilibrium region and wall, the difference of radiative flux among these three models decreases. As seen from figure 21(b), the difference of wall cumulative radiative intensity between the non-local coupled model and uncoupled model is 9.5 %, and the difference between the non-local coupled model and the optically thin coupled model is 9.2 %. This difference on wall radiative intensity is caused by the accumulation of the gas radiative transfer within the whole flow field.
The radiative transfer flux (a) and wall spectral intensity (b) predicted by the different approaches.

The above analysis shows that the flow-field characteristics and radiative transfer are tightly coupled, the flow-field characteristics can be reasonably predicted when considering the non-local adsorption coupling effect, which will in turn affect the gas radiative properties, and further change the radiative transfer, radiative intensity within the flow field and the wall radiative heat flux. Thus, although the computational cost of the fully coupled model is approximately 4–5 times slower than the other two models, it is still imperative to perform the non-local coupled calculations between the flow field and radiative transfer in order to accurately describe the flow field and radiation field characteristics. Moreover, we can effectively reduce the computational cost by simplifying the collisional–radiative model and radiative transfer model in future work.
6. Conclusion
This paper has established a self-consistent thermochemical non-equilibrium flow–radiative transfer coupled model, in which the VSL method is adopted to simulate the stagnation line flow field. A high-temperature air collisional–radiative model is developed to treat the chemical reactions, energy relaxation and the distribution of vibrationally and electronically excited energy levels and a high spectral resolution radiation calculation is performed by using a line-by-line method. The non-equilibrium flow, collisional–radiative reactions and radiative transfer are coupled tightly and first validated by comparison with the experimental data and literature results under the same calculation conditions. Then, the non-equilibrium flow-field characteristics, wall heat transfer and radiation are analysed in detail for three trajectory points of the FIRE II atmospheric re-entry vehicle.
The flow field exhibits obvious non-equilibrium characteristics, including thermal non-equilibrium, chemical non-equilibrium and excited energy level non-equilibrium. Moreover, the non-equilibrium degree is closely related to the flight conditions. The thermal non-equilibrium degree is assessed based on the vibrational relaxation Damköhler number. It is found that the thermal non-equilibrium flow region exists behind the shock front, which occupies 45 % of the entire flow region for the 1634 s case, and only 3 % for the 1643 s case. The distribution of chemical components shows a significant difference from the Saha distribution just behind the shock front and near the wall, illustrating that a strong chemical non-equilibrium effect occurs in these regions. For the excited energy level non-equilibrium, the deviation value between the actual energy level distribution and the Boltzmann distribution is defined to assess the non-equilibrium degree. The results show that, behind the shock front, the vibrationally induced dissociation of high vibrational energy levels, and the inadequate excitation and the ionization of electronically excited states, result in the under-population of highly excited energy levels. However, the non-equilibrium of the excited energy levels in the near-wall region is mainly caused by the de-excitation processes under the surface catalytic effect.
After accurately obtaining the non-equilibrium flow-field characteristics, the stagnation-point heating of the FIRE II vehicle is predicted by the fully coupled model. As the flight time increases from 1634 to 1643 s, the total heat flux, aerodynamic heating and radiative heat flux all increase. However, the calculation of the Stanton numbers shows a decreasing trend in the ratio of the wall heat flux to the inflow kinetic energy. The decomposition of the Stanton number along the stagnation line indicates that the convective term caused by the gradient of translational–rotational energy and the component diffusive term due to dissociation play key roles in the wall heat transfer. The contribution of the component diffusive term due to ionization is negligible, while it becomes important to the heat transfer in the boundary layer.
From the analysis of the spectrally resolved radiative intensity profile along the stagnation line, it is found that the atomic lines in the IR and VUV ranges have high radiative intensities, up to the order of 104 W cm−2 μm−1 sr−1. The radiative transfer from the shock to the wall can be divided into two emission-controlled and two absorption-dominant stages. The emission and absorption stages just behind the shock front are mainly caused by the radiative emission and absorption of the high-energy nitrogen atomic bound–bound transitions in the VUV range. Approaching the wall, the radiative flux exhibits an obvious decrease due to the absorption of N atomic spectral lines and molecular bands. The radiative flux reaching the wall is mainly composed of VUV and IR radiation, respectively accounting for 69.3 % and 18.3 % of the total wall radiative flux for the 1634 s case. Therefore, for practical applications, the reduction of wall radiative heat transfer may be realized by using VUV-reflecting/scattering materials at the forehead of the re-entry vehicle.
The non-local radiation absorption effect can be captured by the fully coupled model. Different from the conventional uncoupled or local coupled approaches, the non-local coupled model obtains the actual escape factor that varies from negative values to a maximum of 1 along the stagnation line. For the spectral lines located in the Vis and IR spectral ranges, their escape factors are close to 1. However, the escape factors of the spectral lines in the VUV range are much lower than 1, and even below 0. The non-local radiation absorption has a strong influence on the non-equilibrium distribution of electronically excited energy levels in the flow field, which can in turn affect the gas radiative properties, and further change the radiative transfer and radiative intensity distribution and the wall radiative heat flux. Compared with the uncoupled approach, the maximum difference in radiative intensity within the flow field can be up to 100 %, and there is also a difference of higher than 9 % in the wall radiative heat flux.
In conclusion, the self-consistent non-equilibrium flow–radiative transfer coupled model established by the present work provides an effective method to accurately obtain the non-equilibrium distribution of vibrationally and electronically excited energy levels, heat flux and radiation characteristics under atmospheric re-entry conditions. However, due to the huge computational cost of the collisional–radiative model and the radiative transfer model used in our paper, it is very difficult to implement the fully coupled model in 2-D or 3-D flow fields. Future work will focus on the simplified study of collisional–radiative and radiative transfer models, providing an effective tool for the prediction of the non-equilibrium flow field and radiation characteristics of a hypersonic re-entry vehicle in multi-dimensional simulation.
Funding
This work was supported by the National Natural Science Foundation of China (grant numbers 12375245, 12005010, 12175011) and the Fundamental Research Funds for the Central Universities (YWF-22-L-1243).
Declaration of interests
The authors report no conflicts of interest.
Appendix A. The collisional and radiative processes
The elementary collisional and radiative processes involved in the collisional–radiative model are listed in tables 6–10.
Vibrational processes involved in the collisional–radiative model.

Appendix B. The set of Saha equations
The chemical equilibrium components are obtained by solving the set of Saha equations, which is described as follows:
 \begin{gather}\frac{{{n_e}{n_i}}}{{{n_a}}} = 2{\left( {\frac{{2{\rm \pi}{m_e}k{T_e}}}{{{h^2}}}} \right)^{1.5}}\frac{{Q_i^{int}({T_e})}}{{Q_a^{int}({T_e})}}\,\textrm{exp}\left( { - \frac{{{E_{ion}}}}{{k{T_e}}}} \right),\end{gather}
 \begin{gather}\frac{{n_a^2}}{{{n_m}}} = \frac{{{{(Q_a^{tr}({T_{tr}}))}^2}}}{{Q_m^{tr}({T_{tr}})}}\frac{{{{(Q_a^{int}({T_e}))}^2}}}{{Q_m^{int}({T_{tr}},{T_{vib,}},{T_e})}}\,\textrm{exp}\left( { - \frac{{{E_{dis}}}}{{k{T_{tr}}}}} \right),\end{gather}
 \begin{gather}\sum\limits_i^{species} {{n_i}{Z_i}} = 0,\end{gather}
 \begin{gather}p = {n_e}k{T_e} + \sum\limits_i^{heavy} {{n_i}k{T_{tr}}} ,\end{gather}
where  $Q_i^{tr}$ and
 $Q_i^{int}$ are respectively the transitional and internal partition functions of species i; ni and Zi are the number density and charge of species i, respectively. A total of 11 chemical species, the same as in the CR model, are considered in the calculations of the above equations.
Dissociation processes involved in the collisional–radiative model. The symbol Y represents the electronic state of molecular species.

Electronic excitation and ionization processes involved in the collisional–radiative model. The symbol AB represents molecules N2, O2, NO, symbol AB+ represents molecular ions  ${\textrm{N}_2}^ +$,
 ${\textrm{O}_2}^ +$, NO+, symbol Y and Z represent the electronic state of molecular species.

Other collisional processes involved in the collisional–radiative model.

Radiative processes involved in the collisional–radiative model.