1 Introduction
The coupling of magnetic fields to thermal convection in electrically conducting fluids can result in profound changes of the flow patterns and transport properties. In nature, this fluid motion, which is termed magnetoconvection, prominently occurs in the interiors of stars or the liquid metal cores of planets, where convective flows and global magnetic fields create the complex dynamo effect (Davidson Reference Davidson2001; Moffatt & Dormy Reference Moffatt and Dormy2019). Technological applications include the flow control of hot metal melts by electromagnetic brakes in metallurgy or the influence of strong magnetic fields on liquid metal cooling systems proposed for fusion reactor blankets (Ihli et al. Reference Ihli, Basu, Giancarli, Konishi, Malang, Najmabadi, Nishio, Raffray, Rao and Sagara2008). A better understanding of these systems can be achieved by experimental studies in canonical configurations. Here, we investigate the case of Rayleigh–Bénard convection (RBC) with an imposed vertical static magnetic field  $B_{0}$, one of the elementary magnetoconvection configurations. RBC considers a horizontal fluid layer of height
 $H$, heated from below and cooled from above. It is governed by three dimensionless numbers which are the Rayleigh number
 $Ra$, the Prandtl number
 $Pr$ and the aspect ratio
 $\unicode[STIX]{x1D6E4}$. Magnetoconvection adds two more dimensionless parameters – the Hartmann number
 $Ha$ and the magnetic Prandtl number
 $Pm$. The aspect ratio
 $\unicode[STIX]{x1D6E4}$ is the horizontal extent of the fluid layer normalised by its height
 $H$. The remaining four parameters are given by
 $$\begin{eqnarray}Ha=B_{0}H\sqrt{\frac{\unicode[STIX]{x1D70E}}{\unicode[STIX]{x1D70C}\unicode[STIX]{x1D708}}},\quad Pm=\unicode[STIX]{x1D707}_{0}\unicode[STIX]{x1D70E}\unicode[STIX]{x1D708},\quad Pr=\frac{\unicode[STIX]{x1D708}}{\unicode[STIX]{x1D705}},\quad Ra=\frac{g\unicode[STIX]{x1D6FC}\unicode[STIX]{x0394}TH^{3}}{\unicode[STIX]{x1D708}\unicode[STIX]{x1D705}},\end{eqnarray}$$
with the electrical conductivity  $\unicode[STIX]{x1D70E}$, the permeability of free space
 $\unicode[STIX]{x1D707}_{0}$, the mass density
 $\unicode[STIX]{x1D70C}$, the kinematic viscosity
 $\unicode[STIX]{x1D708}$, the thermal diffusivity
 $\unicode[STIX]{x1D705}$, the acceleration due to gravity
 $g$, the thermal expansion coefficient
 $\unicode[STIX]{x1D6FC}$ and the temperature difference
 $\unicode[STIX]{x0394}T$ between the bottom and top boundaries of the fluid layer.
The effect of the external magnetic field on the convective flow depends on its strength, quantified by the Hartmann number, and its orientation towards gravity. Canonical configurations apply a static homogeneous magnetic field either in horizontal or in vertical direction. For a horizontal field – perpendicular to gravity – the induced Lorentz forces organise the convective flow in quasi-two-dimensional rolls which are aligned in the direction of the field (Yanagisawa et al. Reference Yanagisawa, Hamano, Miyagoshi, Yamagishi, Tasaka and Takeda2013). The number of rolls depends on the ratio  $Ra/Ha^{2}$. The flow experiences a multitude of dynamical phenomena during the transition between different roll configurations (Yanagisawa et al. Reference Yanagisawa, Yamagishi, Hamano, Tasaka and Takeda2011; Tasaka et al. Reference Tasaka, Igaki, Yanagisawa, Vogt, Zürner and Eckert2016) or when transitioning towards fully three-dimensional turbulence for lower
 $Ha$ (Vogt et al. Reference Vogt, Ishimi, Yanagisawa, Tasaka, Sakuraba and Eckert2018b). In contrast, vertical magnetic fields – parallel to gravity – are known to suppress the convective flow as shown in theory (Chandrasekhar Reference Chandrasekhar1961; Houchens, Witkowski & Walker Reference Houchens, Witkowski and Walker2002; Busse Reference Busse2008), direct numerical simulations (DNS) at high and low Prandtl numbers (Liu, Krasnov & Schumacher Reference Liu, Krasnov and Schumacher2018; Lim et al. Reference Lim, Chong, Ding and Xia2019; Yan et al. Reference Yan, Calkins, Maffei, Julien, Tobias and Marti2019) and experiments (Nakagawa Reference Nakagawa1955; Cioni, Chaumat & Sommeria Reference Cioni, Chaumat and Sommeria2000; Aurnou & Olson Reference Aurnou and Olson2001; Burr & Müller Reference Burr and Müller2001; King & Aurnou Reference King and Aurnou2015). For this case, the linear instability threshold of an infinitely extended magnetoconvection layer itself depends on the Hartmann number and has been determined by Chandrasekhar (Reference Chandrasekhar1961). At high
 $Ha$ it can be estimated by
 $Ra_{c}\approx \unicode[STIX]{x03C0}^{2}Ha^{2}$ or in turn, the magnetic field strength below which convective fluid motion is observed follows to
 $Ha_{c}\approx \sqrt{Ra}/\unicode[STIX]{x03C0}$. This approximation is often referred to as the Chandrasekhar limit (which should not be confused with the one for the maximum mass of a stable white dwarf star). Chandrasekhar (Reference Chandrasekhar1961) determined
 $Ha_{c}$ by a linear stability analysis in a horizontally unbounded fluid layer. As such,
 $Ha_{c}$ does not include the effect of sidewalls, which will be discussed in § 3.4.
Magnetoconvection experiments are generally conducted using liquid metals, which have a very low Prandtl number  $Pr\ll 1$ and a high electrical conductivity
 $\unicode[STIX]{x1D70E}\sim 10^{6}~\text{S}~\text{m}^{-1}$. Recently, magnetoconvection experiments at a higher Prandtl number
 $Pr=12$ were conducted using sulphuric acid (Aujogue et al. Reference Aujogue, Pothérat, Bates, Debray and Sreenivasan2016). While this set-up allows the use of optical flow measurement methods, very high magnetic fields of
 $B_{0}\sim 10$ T are necessary to reach the same parameters as in liquid metals.
Here, we report experimental investigations of liquid metal convection in a closed cylindrical container of unit aspect ratio in the presence of a uniform vertical magnetic field  $B_{0}$, an extension of our previous studies which were reported in Zürner et al. (Reference Zürner, Schindler, Vogt, Eckert and Schumacher2019). The application of multiple thermocouple probes for temperature measurement as well as multiple crossing ultrasound beam lines allows us to reconstruct various regimes of the large-scale circulation flow in dependence on the external magnetic field strength (i.e. the Hartmann number
 $Ha$) and the strength of thermal driving of the flow (i.e. the Rayleigh number
 $Ra$). Our work extends previous experimental studies (which are listed above) in several points. (i) We provide a systematic survey of the different flow regimes in the
 $(Ra,Ha)$ parameter plane which is impossible in DNS at low Prandtl numbers for longer time spans. (ii) We give an experimental evidence for the existence of wall modes in magnetoconvection, remnants of the convection rolls or cells that maintain a convective heat transfer across the vessel for Hartmann numbers above the linear instability threshold
 $Ha_{c}$ and thus confirm recent results of Liu et al. (Reference Liu, Krasnov and Schumacher2018). The appearance and structure of these modes has been predicted theoretically by Houchens et al. (Reference Houchens, Witkowski and Walker2002) and Busse (Reference Busse2008). (iii) The comprehensive usage of ultrasound velocimetry makes a direct determination of the momentum transfer in the flow possible for the first time which extends the analysis in previous experiments. Both, global heat and momentum transfer as a function of the Hartmann number can thus be monitored in detail and compared with existing data of experiments and DNS.
This article is structured as follows. The next section presents the experimental set-up and measurement techniques. Section 3 shows the changes in the flow structure with progressively larger magnetic field strength. The global transport properties of heat and momentum in the convective system are discussed in § 4 in light of the determined flow regimes. Finally, we summarise our findings in § 5 and give an outlook. The measurement results of selected quantities from the present article are also attached as supplementary material available online at https://doi.org/10.1017/jfm.2020.264.
2 Experimental set-up
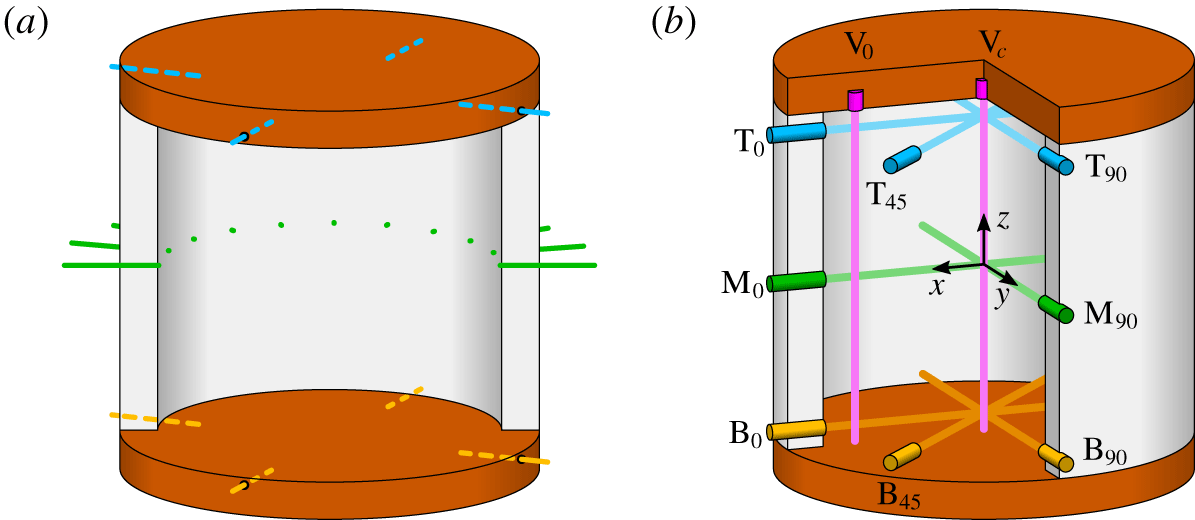
Positions of the measurement devices. (a) Thermocouples for the temperature measurement. Four sensors are mounted in the top plate (blue), four in the bottom plate (orange) and eleven sensors in form of an array at mid height (green). (b) Ultrasound Doppler velocimetry (UDV) sensors for the velocity measurement. Radial velocity components are taken near the top plate (label T, blue) at mid-height (label M, green) and near the bottom plate (label B, orange). The vertical velocity component (purple) is taken along the cylinder axis (label  $\text{V}_{c}$) and at a radial position of
 $r/R=0.8$ (label
 $\text{V}_{0}$). The label subscripts refer to the azimuthal position of the sensors in degree.

The set-up is the same as in the experiments by Zürner et al. (Reference Zürner, Schindler, Vogt, Eckert and Schumacher2019), extended by the magnetic field generation components. For completeness, we provide a compact description in the following. Measurements are conducted in a cylindrical cell of height  $H=180\,$mm and diameter
 $D=180~\text{mm}=2R$, giving an aspect ratio
 $\unicode[STIX]{x1D6E4}=D/H=1$ as shown in figure 1. The top and bottom plates are made of copper. Heat is supplied from below by an electrical heating pad. The top is cooled using water from a thermostat. The working fluid is the liquid metal alloy GaInSn with a melting temperature of
 $10.5\,^{\circ }\text{C}$. At
 $35\,^{\circ }\text{C}$ it has an electrical conductivity of
 $\unicode[STIX]{x1D70E}=3.2\times 10^{6}~\text{S}~\text{m}^{-1}$ (Plevachuk et al. Reference Plevachuk, Sklyarchuk, Eckert, Gerbeth and Novakovic2014), allowing for a large effect of magnetic fields on the flow. The relevant diffusivities of the alloy are the kinematic viscosity
 $\unicode[STIX]{x1D708}=3.2\times 10^{-7}~\text{m}^{2}~\text{s}^{-1}$, the thermal diffusivity
 $\unicode[STIX]{x1D705}=1.1\times 10^{-5}~\text{m}^{2}~\text{s}^{-1}$ and the magnetic diffusivity
 $\unicode[STIX]{x1D702}=(\unicode[STIX]{x1D707}_{0}\unicode[STIX]{x1D70E})^{-1}=0.25~\text{m}^{2}~\text{s}^{-1}$. These values yield a Prandtl number
 $Pr=0.029$ and a magnetic Prandtl number
 $Pm=1.36\times 10^{-6}$. The vertical magnetic field is generated by the MULTIMAG facility at the Helmholtz-Zentrum Dresden-Rossendorf (Pal et al. Reference Pal, Cramer, Gundrum and Gerbeth2009) with a maximum magnetic flux density of
 $B_{0}=0.14$ T. With this set-up, a Rayleigh number range of
 $10^{6}\leqslant Ra\leqslant 6\times 10^{7}$ and a Hartmann number range of
 $0\leqslant Ha\leqslant 1000$ is achieved.
The temperatures  $T_{top}$ of the top plate and
 $T_{bot}$ of the bottom plate are measured using four thermocouples each, distributed evenly around the circumference and 4 mm from the liquid (figure 1a). These probes are used to determine the temperature difference between the plates
 $\unicode[STIX]{x0394}T=T_{bot}-T_{top}$ and the average fluid temperature
 $\bar{T}=(T_{top}+T_{bot})/2$. The temperature of the fluid at the sidewall is measured by a thermocouple array of eleven sensors at mid-height of the cell. They cover half the circumference and are used to detect hot up- and cold downwelling fluid. Finally, the temperature of the cooling water is measured at the in- and the outflow of the upper copper plate (
 $T_{in}$ and
 $T_{out}$). Together with the volume flux
 $\dot{V}$ of the water, the heat flux through the fluid is
 $\dot{Q}=\tilde{c}_{p}\tilde{\unicode[STIX]{x1D70C}}\dot{V}(T_{out}-T_{in})$. Here,
 $\tilde{c}_{p}$ is the isobaric heat capacity and
 $\tilde{\unicode[STIX]{x1D70C}}$ the mass density of water (Çengel Reference Çengel2008). Only measurements with
 $T_{out}-T_{in}>0.2~\text{K}$ are considered. The heat flux is additionally corrected by the heat loss through the sidewalls using three pairs of thermocouples which measure the radial temperature gradient in the sidewall. More details can be found in Zürner et al. (Reference Zürner, Schindler, Vogt, Eckert and Schumacher2019).
The flow field in the container is probed using ultrasound Doppler velocimetry. Ten sensors are distributed around the cell as depicted in figure 1(b). The radial velocity component is recorded at three vertical positions: 10 mm below the top plate, at mid-height and 10 mm above the bottom plate. Near the plates, three sensors are placed at azimuthal positions  $\unicode[STIX]{x1D719}=0^{\circ }$,
 $45^{\circ }$ and
 $90^{\circ }$ (sensors T0, T45 and T90 at the top and B0, B45 and B90 at the bottom). At mid height sensors M0 and M90 are positioned at
 $\unicode[STIX]{x1D719}=0^{\circ }$ and
 $90^{\circ }$, respectively. Additionally, the vertical velocity component is measured by two sensors along the central axis of the cell (
 $\text{V}_{c}$) and at radial position
 $r/R=0.8$ and azimuthal position
 $\unicode[STIX]{x1D719}=0^{\circ }$ (
 $V_{0}$).
The experiments are started by setting the temperature difference between the plates to  $\unicode[STIX]{x0394}T=0~\text{K}$ until no movement of the fluid can be detected. Next, the desired temperature difference is approached and held, until the flow has settled again. Finally, the magnetic field is applied. Once the top and bottom temperature and the flow have reached a steady state, the measurement is started. When changing to a new magnetic field strength, the experiment is reset to
 $B=0$ T first. The average fluid temperature is kept constant at
 $\bar{T}=35\,^{\circ }\text{C}$ except at the highest
 $Ra=6\times 10^{7}$, where it increases to
 $\bar{T}\sim 40\,^{\circ }\text{C}$ for
 $Ha<20$, resulting in
 $Pr=0.028$ and
 $Pm=1.34\times 10^{-6}$.
3 Hartmann number dependence of the large-scale flow
Without external magnetic field, the turbulent flow in our cell organises into a single convection roll, the so-called large-scale circulation (LSC) (Ahlers, Grossmann & Lohse Reference Ahlers, Grossmann and Lohse2009; Chillà & Schumacher Reference Chillà and Schumacher2012; Zürner et al. Reference Zürner, Schindler, Vogt, Eckert and Schumacher2019). This structure has been extensively investigated in water experiments (Funfschilling & Ahlers Reference Funfschilling and Ahlers2004; Sun, Xia & Tong Reference Sun, Xia and Tong2005; Brown & Ahlers Reference Brown and Ahlers2006; Xi et al. Reference Xi, Zhou, Zhou, Chan and Xia2009; Zhou et al. Reference Zhou, Xi, Zhou, Sun and Xia2009; Xie, Wei & Xia Reference Xie, Wei and Xia2013). The opaque nature of liquid metals makes it much more difficult to study their internal flow structure. Earlier experiments thus mainly focussed on temperature characteristics and velocity measurements using single UDV probes or local temperature correlations (Takeshita et al. Reference Takeshita, Segawa, Glazier and Sano1996; Cioni, Ciliberto & Sommeria Reference Cioni, Ciliberto and Sommeria1997; Glazier et al. Reference Glazier, Segawa, Naert and Sano1999; Tsuji et al. Reference Tsuji, Mizuno, Mashiko and Sano2005; King & Aurnou Reference King and Aurnou2013). Only recently has the global flow structure of liquid metal convection been studied in more detail (Khalilov et al. Reference Khalilov, Kolesnichenko, Pavlinov, Mamykin, Shestakov and Frick2018; Vogt et al. Reference Vogt, Horn, Grannan and Aurnou2018a; Zürner et al. Reference Zürner, Schindler, Vogt, Eckert and Schumacher2019). The LSC in turbulent convection at  $\unicode[STIX]{x1D6E4}=1$ exhibits a variety of dynamical properties. The torsion and sloshing modes refer to short-term regular oscillations (
 ${\sim}10\unicode[STIX]{x1D70F}_{ff}$ with the free-fall convective time unit
 $\unicode[STIX]{x1D70F}_{ff}=\sqrt{H/(g\unicode[STIX]{x1D6FC}\unicode[STIX]{x0394}T)}$), which deform the shape of the convection roll into a three-dimensional flow. Over longer time scales (
 ${\sim}100$ to
 $1000\unicode[STIX]{x1D70F}_{ff}$) the average azimuthal orientation of the LSC drifts due to the axisymmetry of the system. This meandering motion follows the physical laws of a diffusion process as shown by Brown & Ahlers (Reference Brown and Ahlers2006). Reversals and cessations of the LSC appear on even larger time scales (Brown & Ahlers Reference Brown and Ahlers2006). For a more detailed analysis of the classical RBC system in the present set-up we refer to our previous work (Zürner et al. Reference Zürner, Schindler, Vogt, Eckert and Schumacher2019). The following subsections describe how the large-scale flow structure of the convection system is altered by the external vertical magnetic field
 $B_{0}$ with a successively stronger magnitude. The boundaries between the different resulting flow regimes are summarised in § 3.4.
3.1 The large-scale one-roll regime
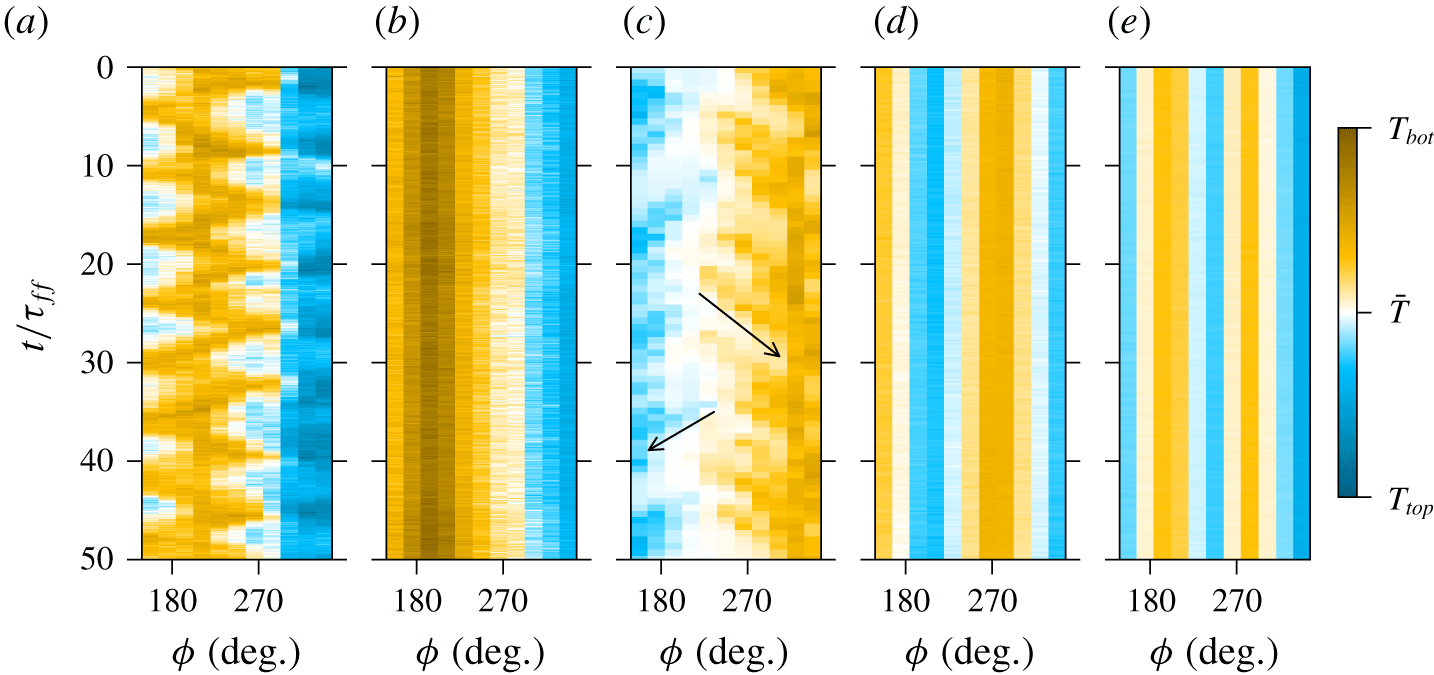
For small magnetic field amplitudes, the one-roll structure of the LSC remains intact. Figure 2 displays colour plots of the mid-height temperature over time. These space–time plots are reconstructed from the signals of the thermocouple array. At first, the regular oscillations of the sloshing mode are still visible, e.g. for  $Ha=13$ and
 $Ra=10^{6}$ in figure 2(a). An increase of the magnetic field strength to
 $Ha=131$ in figure 2(b) suppresses the oscillation modes and results in an establishment of a quasi-two-dimensional roll. UDV measurements show that the flow speed successively decreases for higher field strengths which is known from theory (Chandrasekhar Reference Chandrasekhar1961; Chakraborty Reference Chakraborty2008; Zürner et al. Reference Zürner, Liu, Krasnov and Schumacher2016) and previous experiments (Cioni et al. Reference Cioni, Ciliberto and Sommeria1997; King & Aurnou Reference King and Aurnou2015). This aspect is discussed in detail in § 4.
Sidewall temperature profiles for different vertical magnetic field strengths. The space–time plots at half-height of the RBC flow are reconstructed from the thermocouple array. The temperature is colour coded and plotted over the azimuthal position  $\unicode[STIX]{x1D719}$ and time
 $t$ in free-fall time units
 $\unicode[STIX]{x1D70F}_{ff}$. (a) LSC with regular oscillations (
 $Ra=10^{6}$,
 $Ha=13$,
 $\unicode[STIX]{x1D70F}_{ff}=17.2~\text{s}$). (b) LSC without oscillations (
 $Ra=10^{6}$,
 $Ha=131$,
 $\unicode[STIX]{x1D70F}_{ff}=17.2~\text{s}$). (c) LSC with plume entrainment (
 $Ra=6\times 10^{7}$,
 $Ha=263$,
 $\unicode[STIX]{x1D70F}_{ff}=2.3~\text{s}$). The arrows in this panel indicate the drift of secondary plume positions towards the main convection roll. (d) Cellular pattern (
 $Ra=4.2\times 10^{6}$,
 $Ha=592$,
 $\unicode[STIX]{x1D70F}_{ff}=8.6~\text{s}$). (e) Wall modes (
 $Ra=10^{7}$,
 $Ha=1052$,
 $\unicode[STIX]{x1D70F}_{ff}=5.4~\text{s}$).

For higher Rayleigh numbers  $Ra\gtrsim 3\times 10^{6}$ the flow exhibits a new large-scale roll pattern. Figure 2(c) at
 $Ra=6\times 10^{7}$ and
 $Ha=263$ shows a dominant LSC roll with a hot up- and cold downwelling flow at
 $\unicode[STIX]{x1D719}\sim 315^{\circ }$ and
 $135^{\circ }$, respectively. Additionally, hot or cold spots appear at the sidewall at
 $\unicode[STIX]{x1D719}\sim 225^{\circ }$. These indicate localised regions of secondary up- and downflows that are detached from the primary LSC roll. They likely consist of plumes which are not transported by the horizontal motion of the LSC at the plates. However, these secondary flows experience an azimuthal drift and after some time the plumes are again entrained back into the main path of the LSC. This plume entrainment is highlighted in figure 2(c) for two cases by arrows. These multiple regions of vertical flow are interpreted as a first sign of the breakdown of the coherent LSC roll structure which cannot be maintained anymore.
In summary, the effect of small external magnetic fields is thus the suppression of the regular oscillation modes of the LSC. In the following, we will refer to this regime as the LSC regime.
3.2 The cellular flow regime
As already indicated in the previous section, if the magnetic field magnitude  $B_{0}$ is strong enough, the one-roll LSC structure breaks down into multiple convection rolls or cells. This can be recognised in the data of the mid-height temperature array as multiple separate hotter and colder regions which correspond to up- and downflows, respectively, along the sidewall. For example, figure 2(d) shows two up- and two downflow regions over half the circumference for
 $Ha=592$ and
 $Ra=4.2\times 10^{6}$. A continuation of this pattern would result in three up- and downflow regions along the whole circumference, i.e. a threefold azimuthal symmetry.
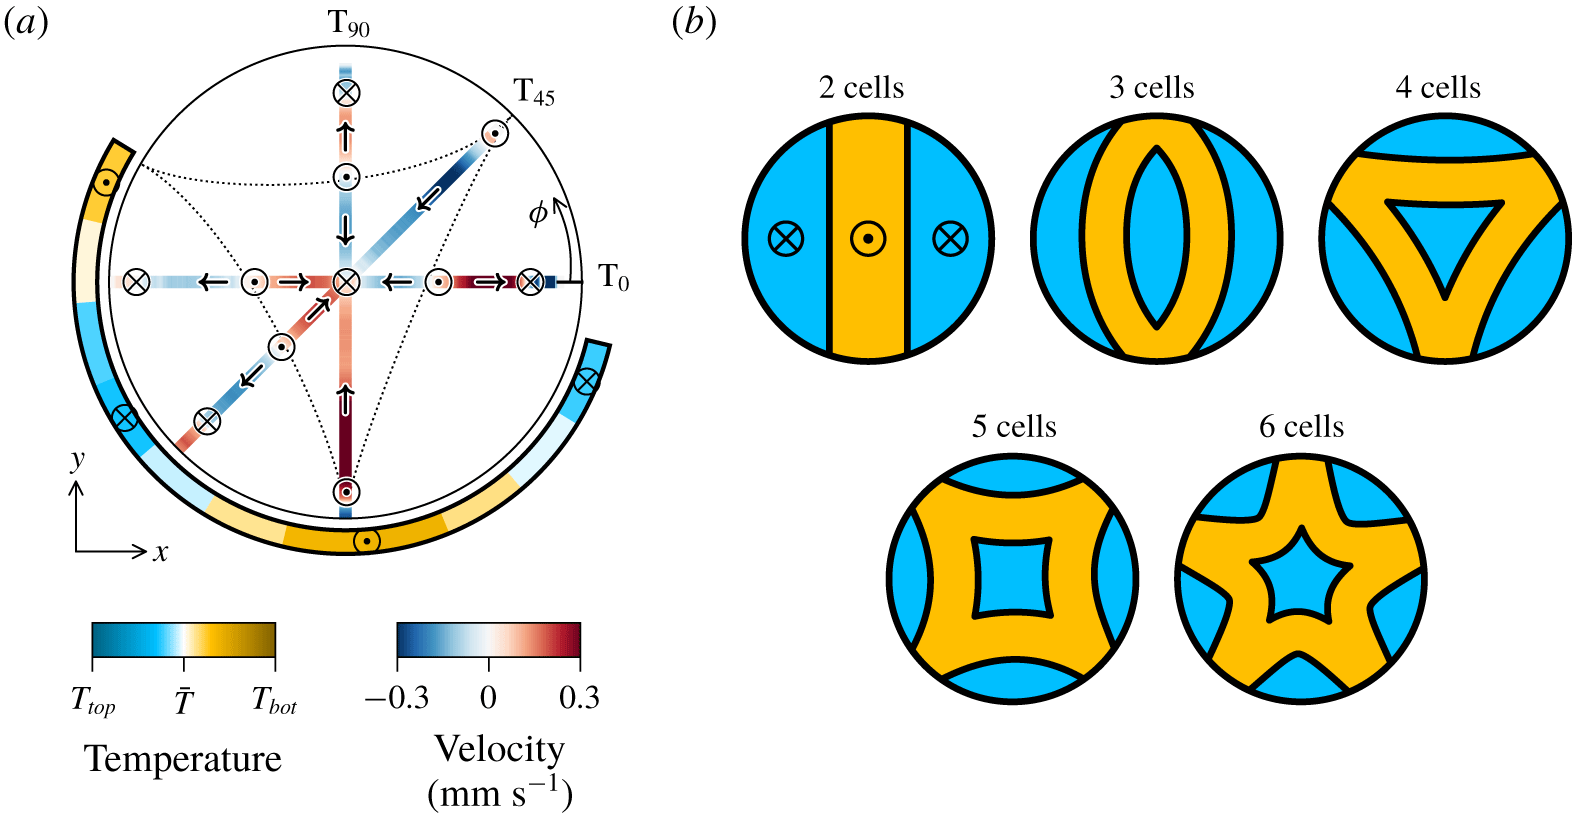
Identification of flow patterns in the cellular regime. (a) Radial velocity profiles near the top plate and temperature profile at mid-height for  $Ra=4.2\times 10^{6}$ and
 $Ha=592$, averaged over
 $50\unicode[STIX]{x1D70F}_{ff}$ (corresponding to figure 2d). Velocity and temperature are colour coded and shown at their position of measurement. Arrows indicate the direction of the flow. Positions of deduced up- and downflows are marked by
 $\odot$ and
 $\otimes$, respectively. The dotted line shows the connection of upwelling flows separating regions of downwelling fluid. (b) Schematic illustrations of the flow patterns in the cellular regime. The areas of up- and downflow (orange and blue, respectively) over the horizontal cross-section at mid-height are illustrated. The flow in (a) corresponds to the 4 cells pattern.

To deduce the structure of the inner flow, the UDV velocity data is analysed. Figure 3(a) displays the time-averaged temperature profile from figure 2(d) and the corresponding radial velocity data of UDV sensors T0, T45 and T90 near the top plate at their respective measurement positions. The directions of the flow are indicated by arrows. We assume the absence of a significant azimuthal flow due to the axisymmetry of the system which requires the presence of up- and downwelling fluid at the points of diverging and converging radial flows, respectively. This is most noticeable in the centre of the cell, where the velocities of all three sensors converge into a downflow along the central axis of the cell. The deduced vertical flows are marked by  $\otimes$ and
 $\odot$ in figure 3(a) and are consistent with the threefold symmetry from the temperature data at mid-height. Small reversals of the velocity direction near the sidewalls indicate corner vortices. It is noticeable, that the areas of downflow (three along the circumference and one in the centre) are always separated by upflows. Connecting the positions of these upwellings gives a triangular shape (dotted line in figure 3a). The flow structure thus consists of four convection cells with down-streaming fluid in their centre and up-streaming fluid at the boundaries. The velocity data of the other seven UDV sensors are consistent with this structure.
Using the above approach, five different flow patterns could be detected in the cellular regime consisting of two to six convection cells. Their basic structures are displayed in figure 3(b) by illustrating the vertical flow direction over the horizontal cross-section at mid-height. They exhibit twofold up to fivefold azimuthal symmetries. Patterns with inverted flow directions occurred as well, i.e. upflow in the centre of the convection cells and downflow at the boundaries in between. The pattern that is selected at a specific parameter combination  $(Ra,Ha)$ is likely to depend on the time history of the experiment such as the speed at which the temperature difference is increased or decreased. A similar observation in parameter regions of regime transitions was reported by Zhong, Ecke & Steinberg (Reference Zhong, Ecke and Steinberg1991) for rotating Rayleigh–Bénard convection. The classification of different patterns in the
 $(Ra,Ha)$ parameter space is detailed in § 3.4.
The transition boundary from the LSC to the cellular flow regime (in short cellular regime) is not sharply defined. At the cross-over between both regimes, the large-scale flow may be highly transient and switch between a one- and multiple-roll structures intermittently. In other instances, the flow could start in the cellular regime and return back into a one-roll LSC structure. This is another indicator for the dependence of the flow state on the particular pathway through the  $Ra$–
 $Ha$ parameter plane – a typical hysteresis effect.
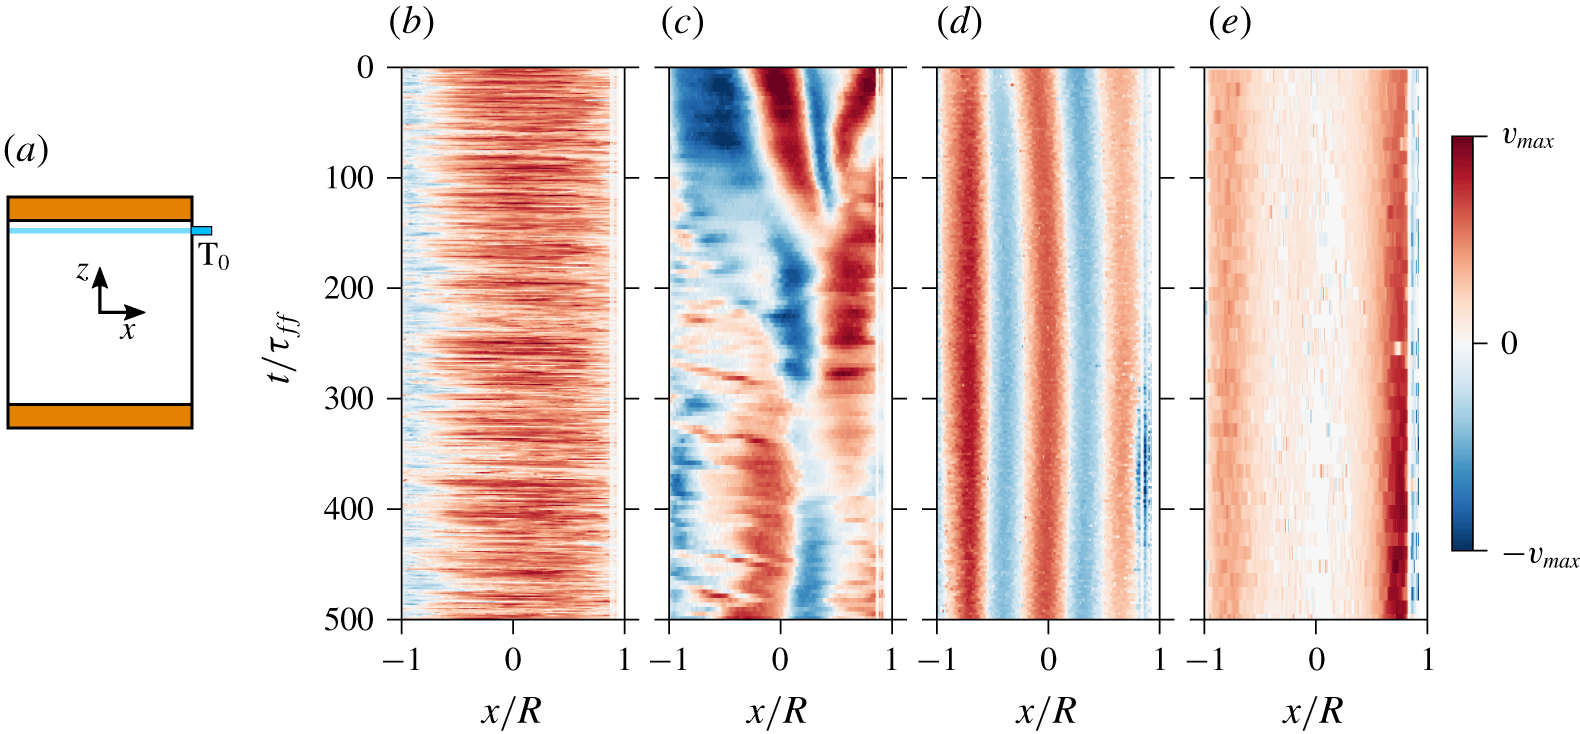
Velocity profiles  $v_{x}(x,t)$ of the UDV sensor T0 at
 $Ra=10^{7}$ (
 $\unicode[STIX]{x1D70F}_{ff}=5.4~\text{s}$) and different
 $Ha$. (a) Illustration of the sensor position and measurement line (see also figure 1b). (b) LSC regime at
 $Ha=66$ with
 $v_{max}=20~\text{mm}~\text{s}^{-1}$. (c) Transient cellular regime at
 $Ha=460$ with
 $v_{max}=2~\text{mm}~\text{s}^{-1}$. (d) Stable cellular regime at
 $Ha=855$ with
 $v_{max}=1~\text{mm}~\text{s}^{-1}$. (e) Wall mode regime at
 $Ha=1052$ with
 $v_{max}=0.3~\text{mm}~\text{s}^{-1}$.

This dynamic behaviour continues into the cellular regime. Figure 4 displays the velocity profiles  $v_{x}(x,t)$ of UDV sensor T0 near the top plate (figure 4a) for measurements at
 $Ra=10^{7}$ and different
 $Ha$. The artefacts of the data near
 $x/R=1$ are the result of an inaccessible zone close to the UDV sensor due to the ringing of its piezoelectric transducer. During the measurement at
 $Ha=66$ in figure 4(b) the system is in the LSC regime. The convection roll is mainly oriented in the
 $x$-
 $z$-plane; thus T0 detects a positive
 $x$-velocity over the whole cell diameter. Only a small area close to
 $x/R=-1$ shows negative velocities, indicating a recirculation vortex. For
 $Ha=460$ in figure 4(c), the flow structure has transformed into the cellular regime with multiple changes of the velocity directions along the measurement line. The flow displays a highly transient behaviour without a clearly defined cell pattern. These fluctuations are continually suppressed with increasing
 $Ha$. At
 $Ha=855$ (figure 4d), the flow pattern has stabilised and the velocity field is quasisteady. Any variation of the flow proceeds now on much larger time scales than in the transitional regime. Here, the free-fall time
 $\unicode[STIX]{x1D70F}_{ff}$ loses its relevance as a time scale due to the strong magnetic damping. These exemplary velocity data illustrate that the flow structures of the cellular regime can exhibit complex dynamical properties. Along with the history dependency of the pattern selection, a more detailed analysis of this behaviour has to be addressed in future experiments.
3.3 The wall mode regime
The final regime detected in the present experiments appears for the highest  $Ha$ and lowest
 $Ra$. The flow field in figure 4(e) at
 $Ra=10^{7}$ and
 $Ha=1052$ shows a distinctly different profile than at lower
 $Ha=855$ in figure 4(d). The velocity magnitude in the cell centre (
 $x/R=0$) is much smaller compared to the areas near the side wall (
 $x/R=\pm 1$). This change in the flow field cannot be detected by the thermocouple array at mid-height. Figure 2(e) shows the temperature profile corresponding to the first
 $50\unicode[STIX]{x1D70F}_{ff}$ of figure 4(e). It shows no significant difference towards the cellular regime (figure 2d).
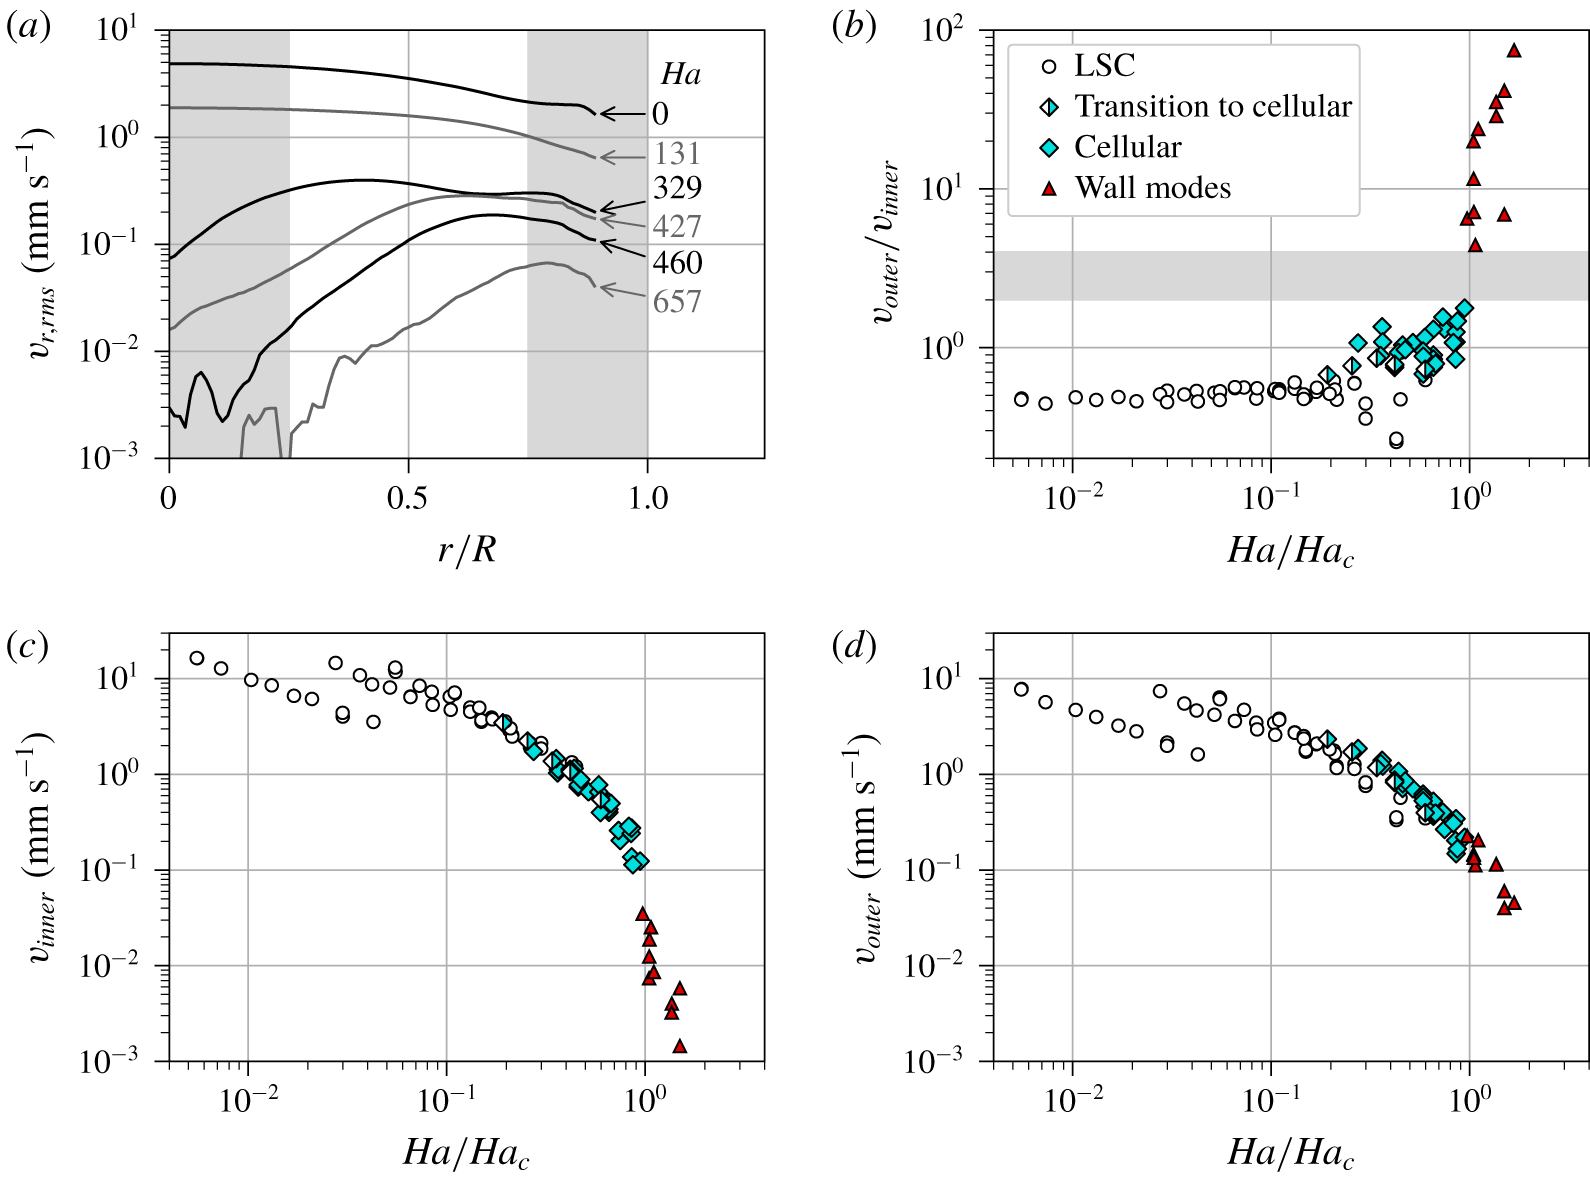
To identify this new regime, we consider the radial velocity profiles  $v_{r}(r,t)$ recorded by the UDV sensors T0, T45, T90, M0, M90, B0, B45 and B90. In order to eliminate noise, a median filter is applied to the raw velocity data with a size of 5 mm along the radial direction and over five consecutive profiles. Subsequently, the root mean square (r.m.s.) of these profiles is taken with respect to time and over all sensors to obtain a radial profile of the radial velocity intensity
 $v_{r,\mathit{rms}}(r)$. These profiles are plotted for
 $Ra=2.1\times 10^{6}$ and different
 $Ha$ in figure 5(a). The overall magnitude of the velocity decreases with increasing
 $Ha$, an observation which is expected. In the LSC regime at
 $Ha=0$ and 131, the r.m.s. velocity magnitude is largest in the centre of the cell (
 $r/R=0$) and decreases towards the sidewall (
 $r/R=1$). The profile in the cellular regime, e.g. at
 $Ha=329$, shows a more evenly distributed magnitude that decreases towards the centre. For higher magnetic fields at
 $Ha=427$, 460 or 657, the r.m.s. magnitude in the centre of the cylinder is drastically decreased compared to the near-wall region. This is the so-called wall mode regime. The variations of these profiles near the centre
 $r=0$ are due to noise and measurement artefacts, which appear at low velocity magnitudes of the order of
 $10^{-2}~\text{mm}~\text{s}^{-1}$ and below.
(a) Profiles of the radial root mean square velocity component  $v_{r,\mathit{rms}}$ with increasing
 $Ha$ and for
 $Ra=2.1\times 10^{6}$. The critical Hartmann number for the linear instability threshold is in this case
 $Ha_{c}=443$. The grey areas mark the intervals with respect to
 $r$ which have been used for calculating
 $v_{outer}$ and
 $v_{inner}$ which are defined by (3.1). (b) Ratio of the outer and inner velocity
 $v_{outer}/v_{inner}$. Flow regimes are indicated by different symbols. The grey area marks the gap between the cellular and wall mode regimes. (c,d) Replot of the inner and outer velocities for all Rayleigh and Hartmann numbers. Symbols correspond to (b). Jumps in the data are due to the different
 $Ra$ they are recorded at.

Averaging the  $v_{r,\mathit{rms}}$ profiles over the inner and outer 25 % of the radius defines typical inner and outer velocities, respectively. Both quantities are given by
 $$\begin{eqnarray}v_{inner}=\langle v_{r,\mathit{rms}}(r)\rangle _{r\leqslant 0.25R},\quad v_{outer}=\langle v_{r,\mathit{rms}}(r)\rangle _{r\geqslant 0.75R}.\end{eqnarray}$$
The ratio  $v_{outer}/v_{inner}$ is displayed in figure 5(b) over
 $Ha$ normalised by
 $Ha_{c}$ at the Rayleigh number of the respective measurement. The amplitudes of both velocities are shown in panels (c,d) of this figure. In the LSC regime the ratio is
 ${\sim}0.5$ and increases up to 2 in the cellular regime. At
 $Ha/Ha_{c}=1$, there is a large gap in the data, signifying a sudden strong decrease of
 $v_{inner}$ compared to
 $v_{outer}$. This means the flow is suppressed in the cell centre and pushed towards the sidewalls. These wall modes were also found in recent direct numerical simulations by Liu et al. (Reference Liu, Krasnov and Schumacher2018). The critical Hartmann number
 $Ha_{c}$ marks the onset of convection for an infinite fluid layer without sidewalls. The sharp transition to wall modes at
 $Ha=Ha_{c}$ shows, that the flow in the fluid bulk behaves as in an unbounded layer. The remaining flow for
 $Ha>Ha_{c}$ is a result of the electrically insulating sidewalls, which reduce the effect of the magnetic damping (Houchens et al. Reference Houchens, Witkowski and Walker2002). The thermocouple array at the sidewall of our experiment detects multiple up- and downflows as can be seen in figure 2(e). Similar to the cellular regime, the order of azimuthal symmetry depends on the parameter combination
 $(Ra,Ha)$. More information can be found in the following § 3.4. Future measurements will address the history dependence of the pattern selection in detail.
3.4 Regime map
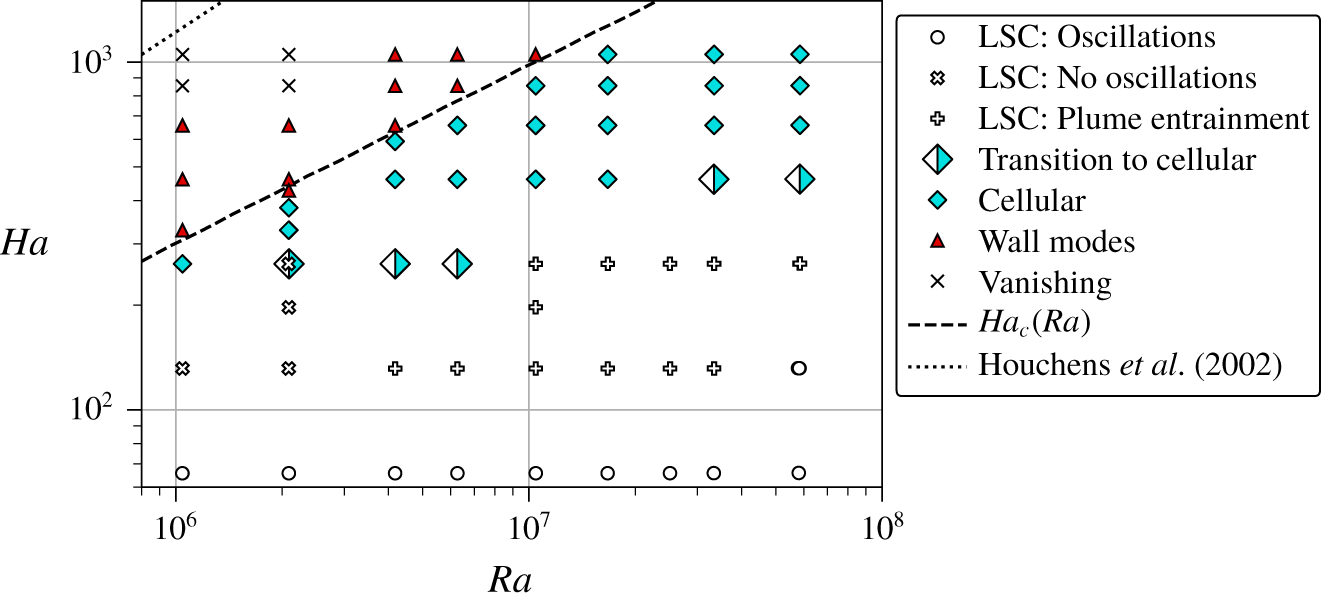
Regime map over the  $(Ra,Ha)$ parameter space. Measurements for
 $Ha<60$ (not shown) belong to the LSC regime with regular oscillations. The lines indicate the theoretical onsets of convection for an infinite fluid layer
 $Ha_{c}$ (Chandrasekhar Reference Chandrasekhar1961) and a cylindrical cell of
 $\unicode[STIX]{x1D6E4}=1$ (Houchens et al. Reference Houchens, Witkowski and Walker2002).

Figure 6 summarises the detected flow regimes over the  $(Ra,Ha)$ parameter space. All measurements
 $Ha<100$ display a LSC structure with regular sloshing and torsion oscillations (denoted as LSC: Oscillations). Only for the highest Rayleigh number of
 $Ra=6\times 10^{7}$ is this regime maintained up to a Hartmann number of
 $Ha=131$. For higher
 $Ha$, the regular oscillations are suppressed but the LSC is still retained (LSC: No oscillations). Above a Rayleigh number of
 $Ra>3\times 10^{6}$, the flow additionally displays the plume entrainment pattern (LSC: Plume entrainment). The subsequent breakdown of the LSC is not uniquely defined and multiple measurements display properties of the LSC and the cellular regime (Transition to cellular). The critical Hartmann number
 $Ha_{c}$ for an infinite fluid layer (Chandrasekhar Reference Chandrasekhar1961) clearly marks the onset of the wall mode regime. Only one measurement at
 $Ra=2.1\times 10^{6}$ and
 $Ha/Ha_{c}=0.97$ displays properties of the wall mode regime for
 $Ha<Ha_{c}$. The measurement closest to
 $Ha_{c}$ in the cellular regime is at a Rayleigh number
 $Ra=4.2\times 10^{6}$ and for
 $Ha/Ha_{c}=0.94$. At the highest Hartmann numbers
 $Ha>800$ and for Rayleigh numbers
 $Ra<3\times 10^{6}$, the temperature and velocity measurements cannot detect a distinctive flow structure anymore (Vanishing), i.e. the recorded values are below the measurement resolution. This does not necessarily imply that convection is completely suppressed by the magnetic field. A flow very close to the sidewall is outside the measurement capabilities of the UDV sensors and could be too slow to induce significant temperature variations at mid-height. Houchens et al. (Reference Houchens, Witkowski and Walker2002) performed a linear stability analysis for magnetoconvection in a cylindrical cell of aspect ratio
 $\unicode[STIX]{x1D6E4}=1$. They found the onset at
 $Ha=0.122Ra^{2/3}$ for
 $Ra\gtrsim 10^{5}$ (dotted line in figure 6) which our experiments cannot cross. In other words, electrically insulating sidewalls destabilise the magnetoconvection flow, a phenomenon that is similar to rotating convection (Zhong et al. Reference Zhong, Ecke and Steinberg1991).
Our experiments satisfy the condition that  $\unicode[STIX]{x1D705}<(\unicode[STIX]{x1D707}_{0}\unicode[STIX]{x1D70E})^{-1}$ or that of
 $Pr\gg Pm$ which suppresses the overstability and thus the appearance of an oscillatory regime (Chandrasekhar Reference Chandrasekhar1961). Simulations of magnetoconvection by Yan et al. (Reference Yan, Calkins, Maffei, Julien, Tobias and Marti2019) at
 $Pr=1$ in Cartesian cells with periodic horizontal boundary conditions also reveal a cellular and a turbulent regime, the latter of which corresponds to the LSC regime in the present study. In the cross-over between both regimes, a regime with narrow columnar up- and downflows is detected which are not destroyed by overstability. This regime existed also in their simulations at
 $Pr=0.025$ for
 $Ha\geqslant 1414$. We cannot detect these structures in our experiment and point to the different geometry and velocity boundary conditions, stress free in combination with periodic conditions in the simulations versus no slip at all walls in our experiment, as one possible reason for this discrepancy.
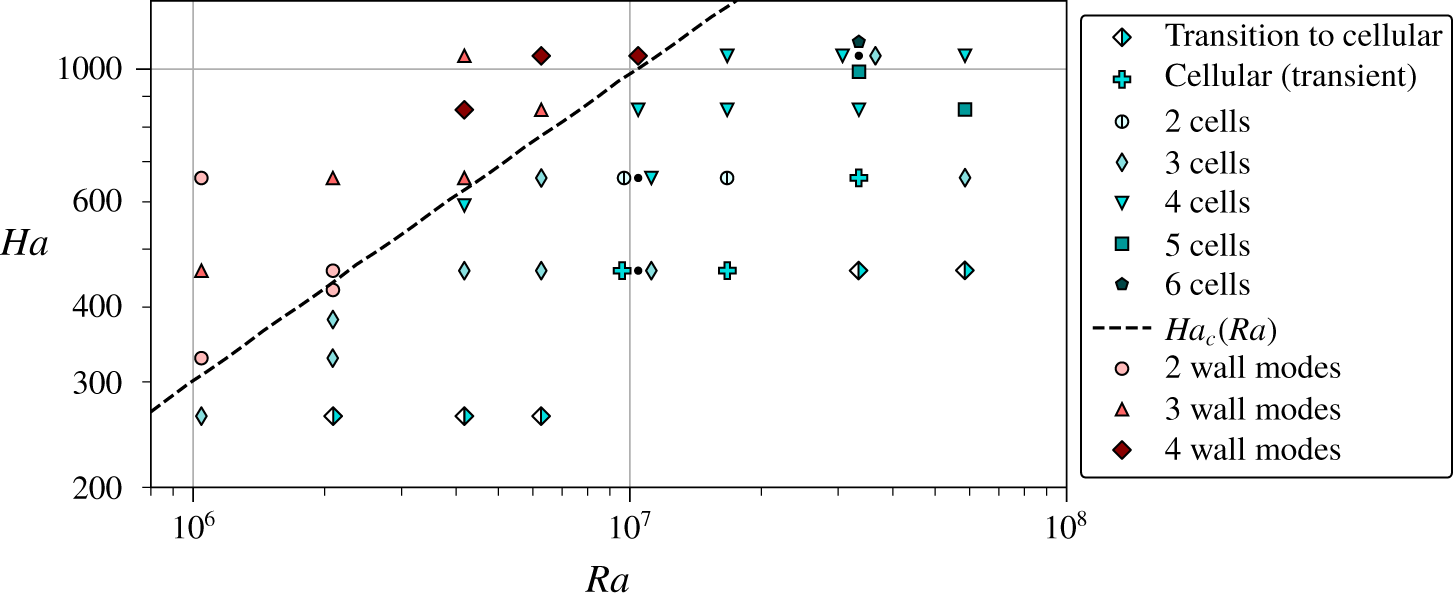
Distribution of flow patterns, represented by the marker shape, in the cellular and wall mode regime over the  $(Ra,Ha)$ parameter space. The dashed line indicates the theoretical onsets of convection for an infinite fluid layer
 $Ha_{c}$ (Chandrasekhar Reference Chandrasekhar1961). If multiple patterns have been observed at the same parameter combination, the respective markers are clustered around a black dot which indicates the actual measurement location. Measurements in the cellular regime that could not be properly identified due to strong fluctuations are assigned to the Cellular (transient) regime.

Figure 7 replots the regime map and highlights the different flow patterns of the cellular and wall mode regimes. The patterns in the cellular regime are named according to figure 3(b). The number of wall modes is determined by means of the temperature array at mid-height. For example, the 3 wall modes pattern consists of three up- and three downflows over the whole circumference. Patterns of type Transition to cellular and Cellular (transient) without a specific cell number are all situated at the low- $Ha$ boundary towards the LSC regime. An overall trend to a higher symmetry and cell number with increasing
 $Ra$ is visible. A refinement of this map with a finer sampling of
 $(Ra,Ha)$ or an inclusion of the dependence of pattern selection on the history of the temperature variation (hysteresis effects) is beyond the scope of the present work. Our presented regime map in figure 6 provides a general overview over the various flow structures occurring in liquid metal magnetoconvection.
In a number of measurements the flow experienced a constant azimuthal drift of up to three full turns per hour, an effect which occurred for several parameter combinations  $(Ra,Ha)$. An effect of the Coriolis force of the Earth, as discussed by Brown & Ahlers (Reference Brown and Ahlers2006) for RBC without magnetic fields, can be excluded as the reason of this drift since it only occurs for
 $Ha>0$. Additionally, a reversal of the vertical external magnetic field polarity caused a reversal of the drift direction. The Lorentz forces induced by the interaction of the velocity field and the external magnetic field are consequently not the reason for the drift since they are invariant under the inversion of the magnetic field (Davidson Reference Davidson2001). However, the magnetic field could be responsible for an additional force on the flow by the thermoelectric effect, which results from non-constant temperature differences between copper and liquid metal along the flow direction. These temperature differences are caused by the large-scale circulation and generate a thermoelectric current in radial direction. Due to the vertical magnetic field, this thermoelectric current induces a Lorentz force which acts on the liquid in azimuthal direction. To prevent this effect, the copper plates would have to be covered with an electrically insulating layer to electrically separate the copper from the liquid metal.
4 Global transport properties
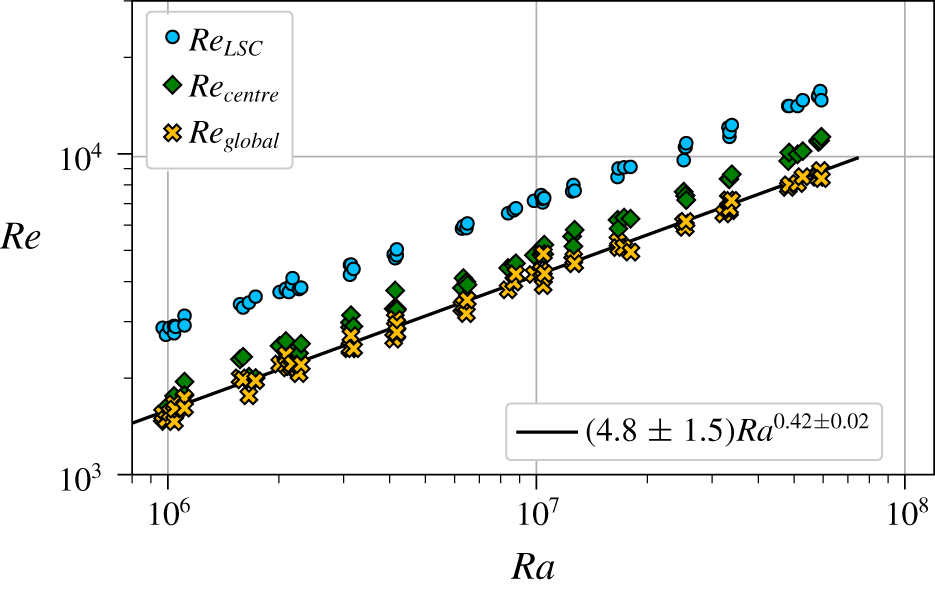
Global Reynolds number  $Re_{global}$ versus Rayleigh number
 $Ra$ at
 $Ha=0$. Values of
 $Re_{LSC}$ (based on the LSC velocity at the plates) and
 $Re_{centre}$ (based on the velocity fluctuations in the cell centre) are replotted from Zürner et al. (Reference Zürner, Schindler, Vogt, Eckert and Schumacher2019).

The global heat transport is characterised by the Nusselt number  $Nu=\dot{Q}/\dot{Q}_{cond}$, where
 $\dot{Q}_{cond}=\unicode[STIX]{x1D706}\unicode[STIX]{x03C0}R^{2}\unicode[STIX]{x0394}T/H$ is the purely conductive heat flux with the heat conductivity
 $\unicode[STIX]{x1D706}$. The Reynolds number
 $Re=UL/\unicode[STIX]{x1D708}$ which quantifies the momentum transport in the anisotropic and inhomogeneous convection flow does not have a clear definition since its magnitude depends on the choice of the characteristic velocity
 $U$, the measurement position and method as discussed in Zürner et al. (Reference Zürner, Schindler, Vogt, Eckert and Schumacher2019). An adaption of the definition of
 $U$ to the large variety of flow structures in the different regimes described in § 3 introduces biases. We want to provide a unique definition of
 $Re$ that applies for the whole parameter space. Numerical simulations typically calculate
 $U$ as a r.m.s. average over the whole fluid volume. Following this approach, we calculate a global velocity scale
 $v_{global}$ by taking the r.m.s. average of all velocity data recorded by the ten UDV sensors (over position and time). The resulting Reynolds number
 $Re_{global}=v_{global}H/\unicode[STIX]{x1D708}$ is plotted for
 $Ha=0$ in figure 8. For comparison, the Reynolds numbers
 $Re_{LSC}$ and
 $Re_{centre}$, based on the LSC velocity near the plates and the velocity fluctuations in the cell centre, are replotted from Zürner et al. (Reference Zürner, Schindler, Vogt, Eckert and Schumacher2019). The magnitude of
 $Re_{global}$ is lower than
 $Re_{LSC}$ and
 $Re_{centre}$, since the UDV sensors probe many low-velocity areas of the flow. A power law fit results in a scaling of
 $Re_{global}\simeq (4.8\pm 1.5)Ra^{0.42\pm 0.02}$ with the same exponent as
 $Re_{LSC}\simeq (8.0\pm 4.4)Ra^{0.42\pm 0.03}$ (Zürner et al. Reference Zürner, Schindler, Vogt, Eckert and Schumacher2019), showing that it is dominated by the high-velocity areas of the flow. It should be noted that this definition of the Reynolds number
 $Re_{global}$ can still introduce some biases towards different flow states. The reason is that UDV sensors can probe a limited number of regions and velocity components of the fluid only. Any large-scale flow which is predominantly located in those areas and aligned with some of the crossing beam lines will intrinsically give a stronger signal than a flow of the same intensity which is centred at different regions. Our results will be discussed in light of this bias.
For the following, the Reynolds number and the convective part of the Nusselt number will always be normalised by their reference values at  $Ha=0$ which leads to
 $$\begin{eqnarray}\tilde{Nu}=\frac{Nu(Ra,Ha)-1}{Nu(Ra,0)-1},\quad \tilde{Re}_{global}=\frac{Re_{global}(Ra,Ha)}{Re_{global}(Ra,0)}.\end{eqnarray}$$
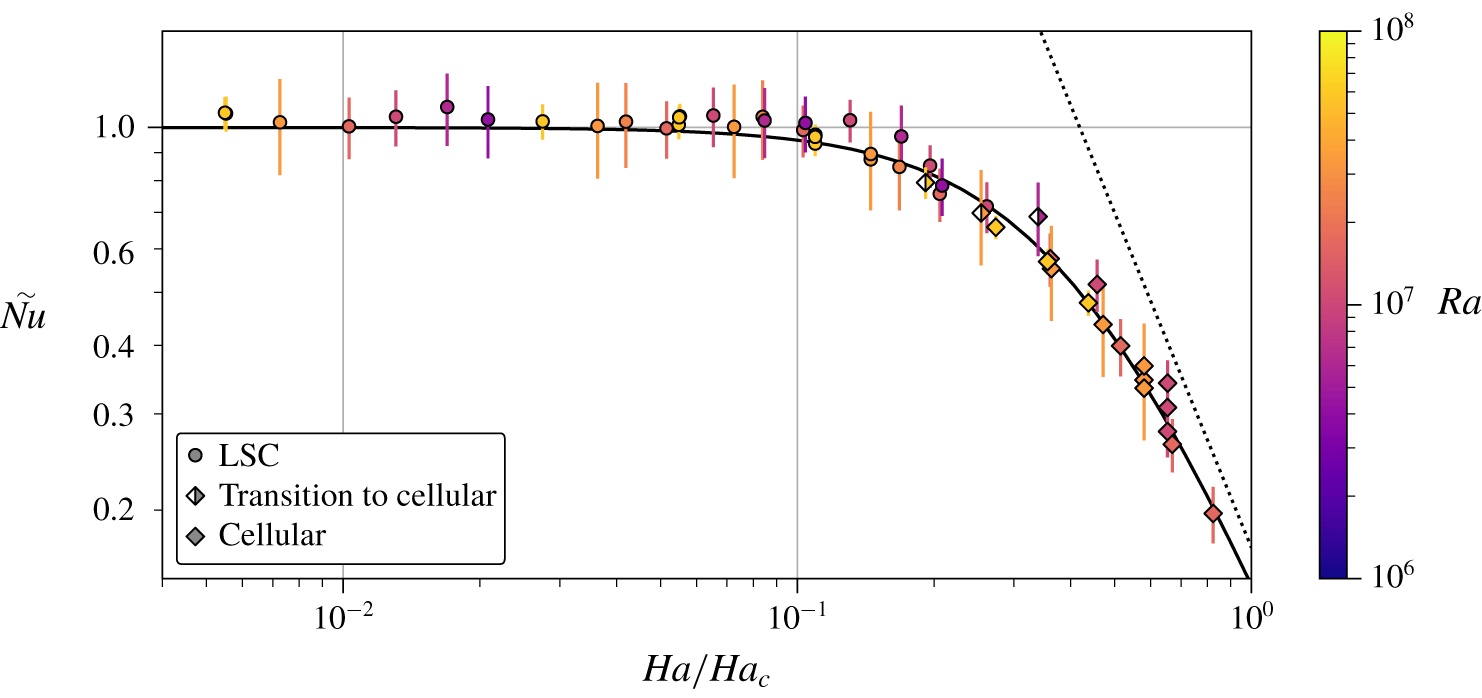
Normalised Nusselt number  $\tilde{Nu}$ versus Hartmann number
 $Ha$, normalised by
 $Ha_{c}$. Flow regimes and Rayleigh numbers are indicated by differently shaped and coloured symbols, respectively. The fit of (4.2) is plotted as solid line with parameters
 $\unicode[STIX]{x1D712}_{1}=5.9$ and
 $\unicode[STIX]{x1D6FE}_{1}=2.03$. Its asymptote for high
 $Ha$ is shown as dotted line.

The normalised Nusselt number  $\tilde{Nu}$ is plotted versus
 $Ha/Ha_{c}$ in figure 9. With this normalisation, as in Cioni et al. (Reference Cioni, Chaumat and Sommeria2000), the data collapse to a single curve for all Rayleigh numbers. For nearly the whole LSC regime
 $\tilde{Nu}$ retains its original value from
 $Ha=0$. Only close to the transition into the cellular regime,
 $\tilde{Nu}$ starts to drop to values of
 ${\sim}80\,\%$. Once the cellular regime is reached, the Nusselt number drops significantly with increasing Hartmann number. The resulting dependence of
 $\tilde{Nu}$ can be described by
 $$\begin{eqnarray}\tilde{Nu}\simeq \left[1+\unicode[STIX]{x1D712}_{1}\left(\frac{Ha}{Ha_{c}}\right)^{\unicode[STIX]{x1D6FE}_{1}}\right]^{-1}.\end{eqnarray}$$
A least-squares fit to the data with the parameters  $\unicode[STIX]{x1D712}_{1}=5.9\pm 0.3$ and
 $\unicode[STIX]{x1D6FE}_{1}=2.03\pm 0.06$ is plotted as a solid line in figure 9. For large
 $Ha$, (4.2) becomes the power law
 $\tilde{Nu}\simeq 0.17(Ha/Ha_{c})^{-2.03}$ (dotted line). This asymptote is, however, not reached before the transition to the wall mode regime at
 $Ha/Ha_{c}=1$. Lacking a sufficient amount of data in this regime, it is not clear whether the asymptote is reached eventually or whether the scaling changes for
 $Ha>Ha_{c}$, a point which has to be left open for now.
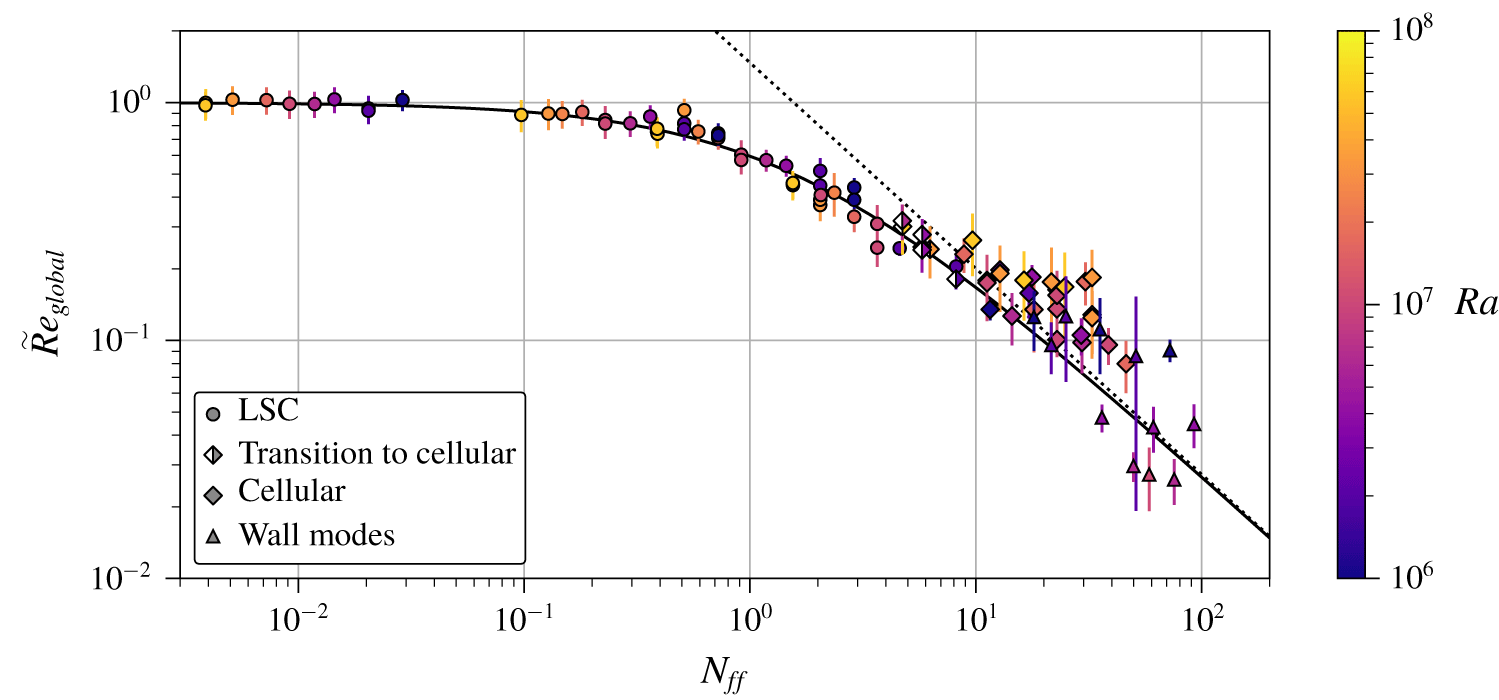
Normalised Reynolds number  $\tilde{Re}_{global}$ versus the free-fall interaction parameter
 $N_{ff}$. Flow regimes and Rayleigh numbers are indicated by differently shaped and coloured symbols, respectively. The fit of (4.4) is plotted as solid line with parameters
 $\unicode[STIX]{x1D712}_{2}=0.68$ and
 $\unicode[STIX]{x1D6FE}_{2}=0.87$. Its asymptote for high
 $N_{ff}$ is shown as dotted line.

The Reynolds number displays a similar progression as the Nusselt number. However, the  $\tilde{Re}_{global}$ data do not collapse over
 $Ha/Ha_{c}$. To find a better dependency, the function (4.2) is modified to
 $[1+\unicode[STIX]{x1D712}_{2}^{\prime }(Ha/Ha_{c}^{\unicode[STIX]{x1D6FD}})^{\unicode[STIX]{x1D6FE}_{2}^{\prime }}]^{-1}$ with an additional fit parameter
 $\unicode[STIX]{x1D6FD}$. A fit to
 $\tilde{Re}_{global}$ results in
 $\unicode[STIX]{x1D6FD}=0.47\pm 0.04\approx 0.5$ (as well as
 $\unicode[STIX]{x1D712}_{2}^{\prime }=0.04\pm 0.02$ and
 $\unicode[STIX]{x1D6FE}_{2}^{\prime }=1.74\pm 0.05$). This suggests that the Reynolds number scales with
 $Ha/\sqrt{Ha_{c}}$. Using
 $Ha_{c}=\sqrt{Ra}/\unicode[STIX]{x03C0}$ in the Chandrasekhar limit and introducing the free-fall Reynolds number
 $Re_{ff}=\sqrt{Ra/Pr}$ gives
 $$\begin{eqnarray}\frac{Ha}{\sqrt{Ha_{c}}}=\sqrt{\frac{Ha^{2}}{Re_{ff}}\frac{\unicode[STIX]{x03C0}}{\sqrt{Pr}}}=\sqrt{N_{ff}\frac{\unicode[STIX]{x03C0}}{\sqrt{Pr}}}.\end{eqnarray}$$
Here, the free-fall interaction parameter  $N_{ff}=Ha^{2}/Re_{ff}$ quantifies the ratio of magnetic and buoyant forcing in the fluid. Figure 10 shows that the
 $\tilde{Re}_{global}$ data indeed collapse onto one curve when plotted over
 $N_{ff}$. The Reynolds number continuously decreases over the LSC regime range for
 $N_{ff}\gtrsim 0.1$, reaching values of
 $\tilde{Re}_{global}\sim 30\,\%$ at the cross-over to the cellular regime. In the cellular and wall mode regimes, the data are more strongly scattered than in the LSC regime, because of the different flow configurations which are probed locally by the UDV sensors. However, a continuous decrease of
 $\tilde{Re}_{global}$ is still observed. A fit of the function
 $$\begin{eqnarray}\tilde{Re}_{global}\simeq [1+\unicode[STIX]{x1D712}_{2}N_{ff}^{\unicode[STIX]{x1D6FE}_{2}}]^{-1}\end{eqnarray}$$
to the data gives  $\unicode[STIX]{x1D712}_{2}=0.68\pm 0.04$ and
 $\unicode[STIX]{x1D6FE}_{2}=0.87\pm 0.03$, shown in figure 10 as a solid line. It should be noted that
 $\unicode[STIX]{x1D712}_{2}$ could in general be a function of
 $Pr$ (see (4.3)). Here, this is not relevant since
 $Pr\approx \text{const}.$ (the
 $Pr$-dependence of
 $\tilde{Re}$ is discussed at the end of this section). The asymptotic behaviour of (4.4) in the cellular and wall modes regime is the power law
 $\tilde{Re}_{global}\simeq 1.47N_{ff}^{-0.87}$ for large
 $N_{ff}\gtrsim 10$ (see dotted line in figure 10). The transition from
 $\tilde{Re}\simeq 1$ for small
 $N_{ff}$ to the high-
 $N_{ff}$ asymptote is centred around
 $N_{ff}\sim 1$ with
 $1.47N_{ff}^{\,-0.87}=1$ at
 $N_{ff}\approx 1.6$.
The values of  $\tilde{Nu}$ and
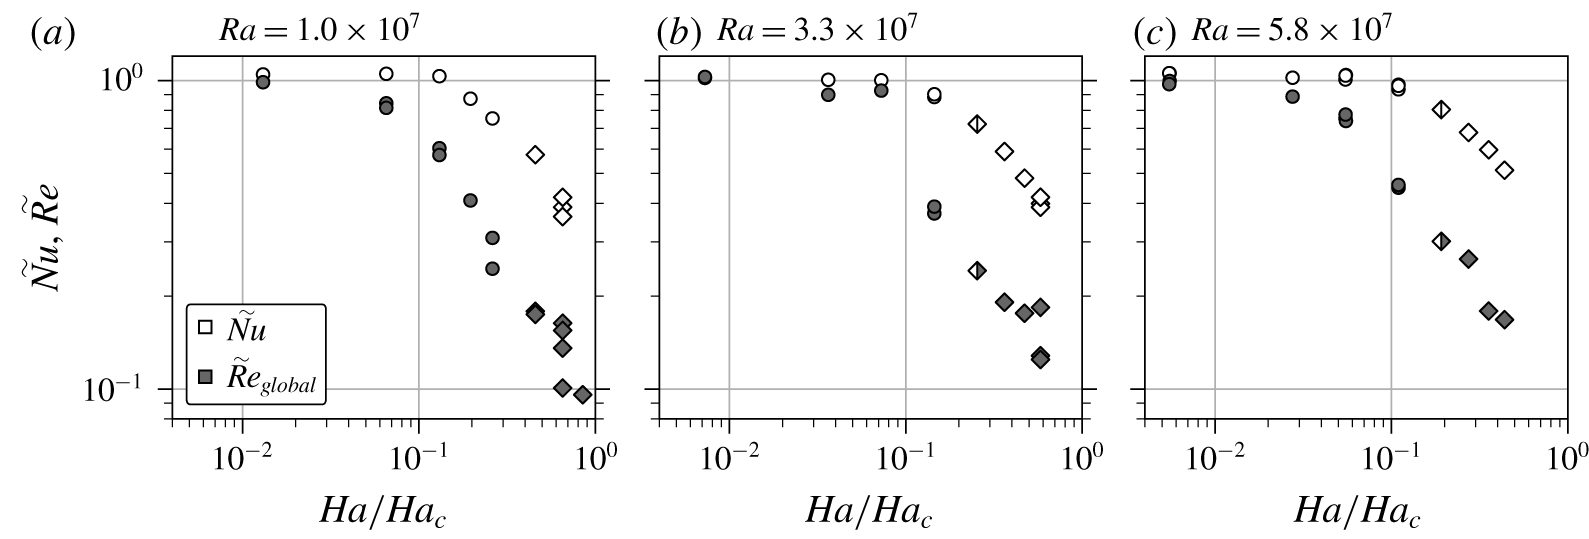
 $\tilde{Re}$ can be compared by their regime (marker shape) in figures 9 and 10. Additionally, figure 11 compares the data for three selected
 $Ra$ directly. It is remarkable that the global heat transport stays nearly constant up to the transition to the cellular regime while the global momentum transport decreases continually over the LSC regime. This decoupling of transport properties from the average flow speed is also observed for other convection systems that include a stabilising force, e.g. confined or rotating convection (Chong et al. Reference Chong, Yang, Huang, Zhong, Stevens, Verzicco, Lohse and Xia2017). The magnetic damping decelerates the flow, but more importantly, suppresses the turbulent oscillations and thus increases the coherence of the large-scale fluid motion. This in turn improves the convective heat transport and compensates the effect of an overall slower flow magnitude. In simulations of magnetoconvection at
 $Pr\sim 8$, Lim et al. (Reference Lim, Chong, Ding and Xia2019) even found an increase of
 $Nu$ for an optimal
 $Ha$. Such an improvement of the transport properties is generally associated with the cross-over of the viscous and the thermal boundary layer (BL) (Chong et al. Reference Chong, Yang, Huang, Zhong, Stevens, Verzicco, Lohse and Xia2017; Lim et al. Reference Lim, Chong, Ding and Xia2019). For low-
 $Pr$ convection, the viscous BL is much thinner than the thermal BL at
 $Ha=0$ (Stevens et al. Reference Stevens, van der Poel, Grossmann and Lohse2013; Scheel & Schumacher Reference Scheel and Schumacher2016, Reference Scheel and Schumacher2017). By increasing
 $Ha$ the viscous BL thickness further shrinks as it has to be substituted by a Hartmann BL thickness, which is given by
 $\unicode[STIX]{x1D6FF}_{B}=H/Ha$, whereas the thermal BL thickness
 $\unicode[STIX]{x1D6FF}_{T}=H/(2Nu)$ grows (Yan et al. Reference Yan, Calkins, Maffei, Julien, Tobias and Marti2019). Consequently, a BL cross-over is not expected in the present experiments. Indeed, an associated increase of
 $Nu$ with
 $Ha$ cannot be observed in figure 9.
The magnetic Reynolds number  $Rm=RePm$ is always significantly smaller than 1. The highest Reynolds numbers are reached for
 $Ha=0$, since
 $Re$ decreases with increasing
 $Ha$. The maximal values of
 $Re$ shown in figure 8 do not exceed
 $2\times 10^{4}$ (see also Zürner et al. (Reference Zürner, Schindler, Vogt, Eckert and Schumacher2019)). With a magnetic Prandtl number
 $Pm=1.36\times 10^{-6}$ this results in
 $Rm<2.72\times 10^{-2}$. Thus, the quasistatic approximation is applicable within the whole parameter space of the present experiment, i.e. the applied magnetic field is not significantly distorted by the convective flow (Davidson Reference Davidson2001).


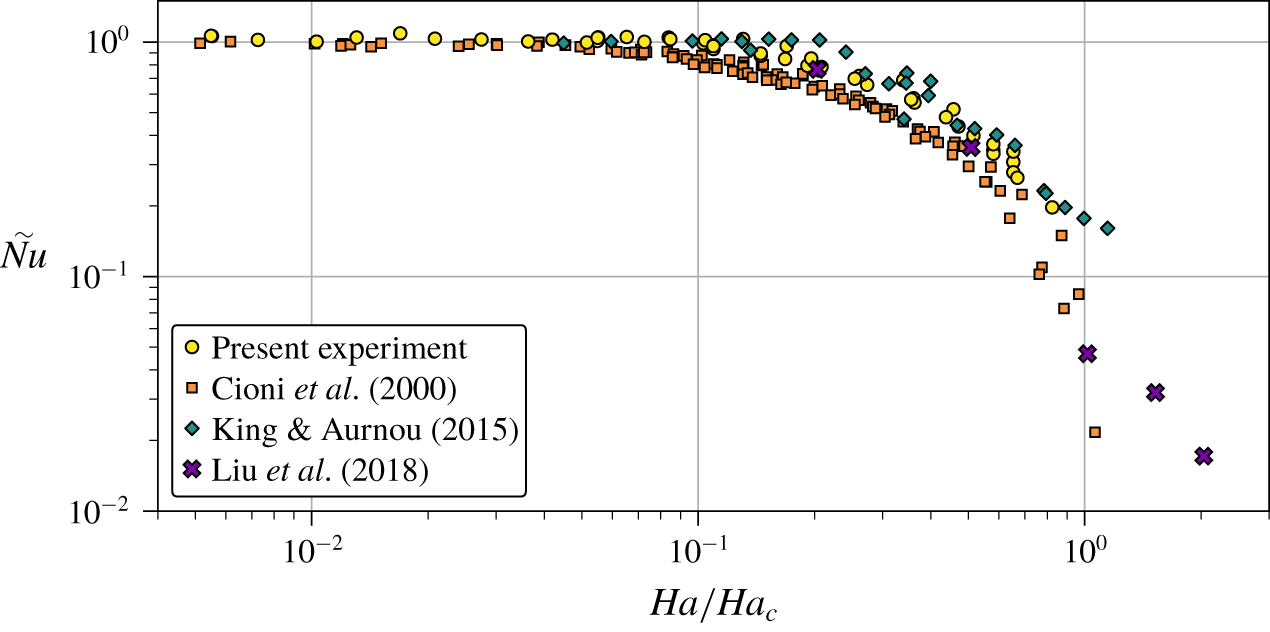
We now compare the results of the present experiments with further data from the literature. Nusselt number measurements by Cioni et al. (Reference Cioni, Chaumat and Sommeria2000) and King & Aurnou (Reference King and Aurnou2015), as well as simulations by Liu et al. (Reference Liu, Krasnov and Schumacher2018) (all at  $Pr=0.025$) are shown in figure 12. The data are plotted again over
 $Ha/Ha_{c}$ and are normalised by their respective values at
 $Ha=0$, which agree well with the present experiment (Zürner et al. Reference Zürner, Schindler, Vogt, Eckert and Schumacher2019). Liu et al. (Reference Liu, Krasnov and Schumacher2018) find a Nusselt number of
 $Nu=9.75\pm 0.05$ at
 $Ha=0$ and
 $Ra=10^{7}$, which is consistent with our result
 $Nu=9.2\pm 0.7$ (Zürner et al. Reference Zürner, Schindler, Vogt, Eckert and Schumacher2019). Simulations by Yan et al. (Reference Yan, Calkins, Maffei, Julien, Tobias and Marti2019) at
 $Pr=0.025$ agree with the data by Cioni et al. (Reference Cioni, Chaumat and Sommeria2000), but do not report results for
 $Ha=0$ and are thus not shown here. The data follow the same general progression as the present results. The experiments deviate slightly from one another once
 ${\tilde{N}}u$ drops off, even though every individual set of data collapses over its range of
 $Ra$. For
 $Ha>Ha_{c}$ the data disagree more strongly, giving a range of
 $0.02<\tilde{Nu}<0.3$. Since the wall modes depend on the sidewalls of the cell, one reason may be the different geometry: Liu et al. (Reference Liu, Krasnov and Schumacher2018) use a rectangular box of
 $\unicode[STIX]{x1D6E4}=4$, while the experiments by Cioni et al. (Reference Cioni, Chaumat and Sommeria2000) and King & Aurnou (Reference King and Aurnou2015) are conducted in cylinders of
 $\unicode[STIX]{x1D6E4}=1$. The large deviation between the experiments is less clear and may be attributed to the difficulty of accurately measuring low
 $Nu\sim 1$.
The authors are to the best of their knowledge not aware of any previous experiments that report Reynolds numbers for the magnetoconvection case. Direct numerical simulations by Liu et al. (Reference Liu, Krasnov and Schumacher2018) and Yan et al. (Reference Yan, Calkins, Maffei, Julien, Tobias and Marti2019) report such measurements for  $Pr=0.025$. The latter DNS cannot be compared since it reports data for
 $Ha=1414$ outside our range of
 $Ha$ and is missing data at
 $Ha=0$ needed for the normalisation of
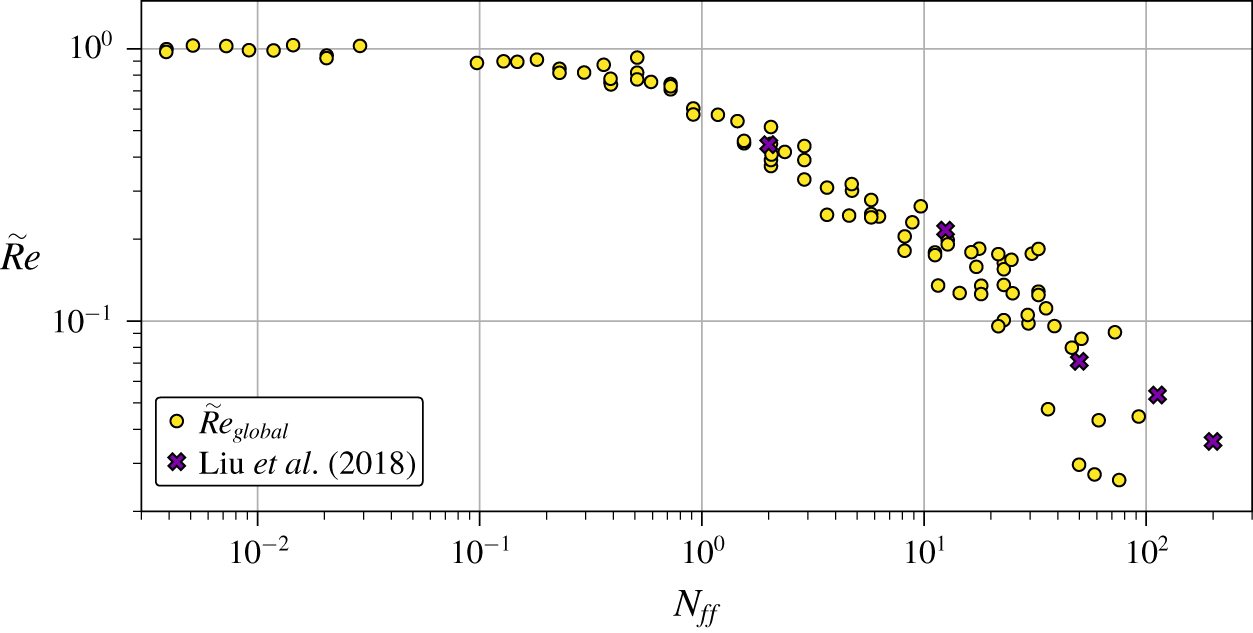
 $\tilde{Re}$. The former DNS is plotted over
 $N_{ff}$ along with
 $\tilde{Re}_{global}$ in figure 13. The two data sets agree very well with one another, although a fit of (4.4) to the simulation gives a somewhat smaller decrease (
 $\unicode[STIX]{x1D712}_{2}=0.78$,
 $\unicode[STIX]{x1D6FE}_{2}=0.66$) than the present experimental results, which might be explained with the difference in geometry or the limited velocity data acquired by the UDV sensors.
Comparison of normalised Nusselt number data as a function of the Hartmann number with experiments (Cioni et al. Reference Cioni, Chaumat and Sommeria2000; King & Aurnou Reference King and Aurnou2015) and direct numerical simulations (Liu et al. Reference Liu, Krasnov and Schumacher2018) at  $Pr=0.025$. The circles are the present data replotted from figure 9.

Comparison of normalised Reynolds number data as a function of the free-fall interaction parameter with direct numerical simulations by Liu et al. (Reference Liu, Krasnov and Schumacher2018) at  $Pr=0.025$. The circles are the present data replotted from figure 10. The Reynolds numbers by Liu et al. (Reference Liu, Krasnov and Schumacher2018) are based on the root mean square of the velocity field over the whole fluid volume for
 $Ra=10^{7}$.

DNS of magnetoconvection in vertical magnetic fields at moderate Prandtl numbers are reported by Yan et al. (Reference Yan, Calkins, Maffei, Julien, Tobias and Marti2019) for  $Pr=1$ and Lim et al. (Reference Lim, Chong, Ding and Xia2019) for
 $Pr=8$. While Lim et al. (Reference Lim, Chong, Ding and Xia2019) use a cubic cell with solid walls, Yan et al. (Reference Yan, Calkins, Maffei, Julien, Tobias and Marti2019) use boxes of different aspect ratios varying between
 $0.75:0.75:1$ and
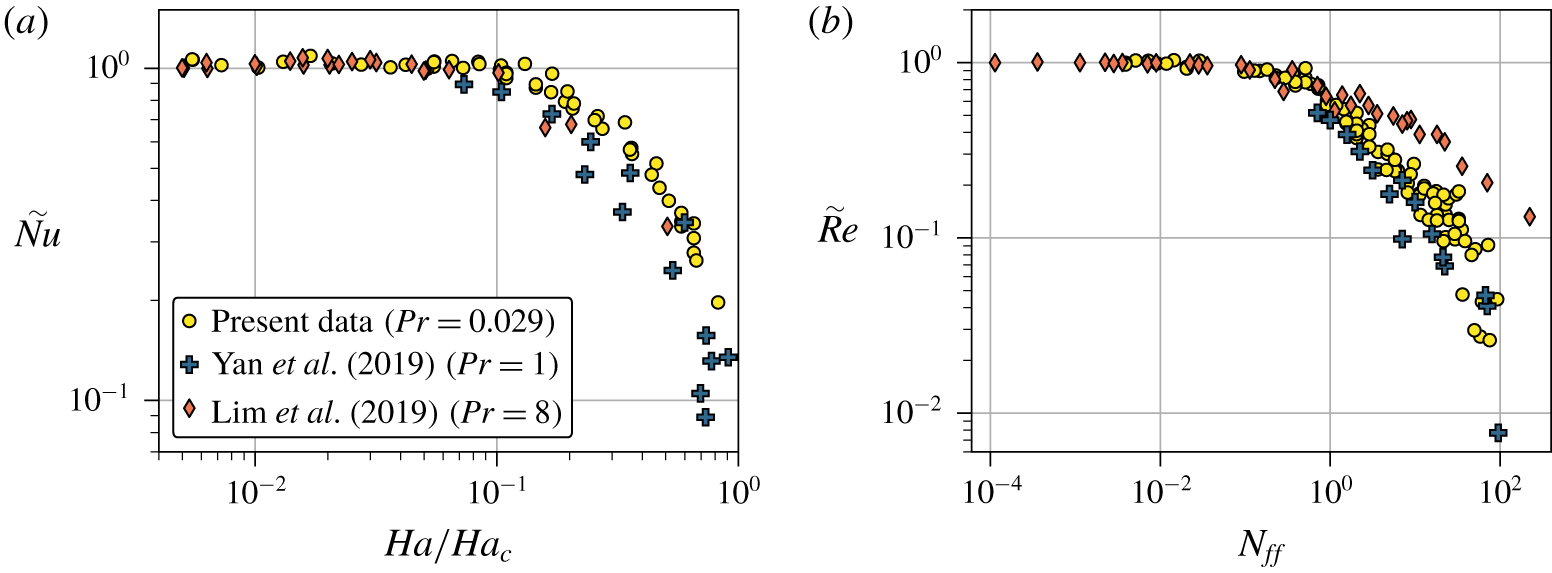
 $28:28:1$ and with periodic boundary conditions. Figure 14 compares these numerical results with our low Prandtl number experimental data. The data of
 $\tilde{Nu}$ (figure 14a) do not show a significant difference for the different Prandtl numbers, recalling the scatter of the experimental records at
 $Pr=0.025$ in figure 12. In contrast, the Reynolds numbers in figure 14(b) reveal a dependence on
 $Pr$. At first, the
 $Pr=0.029$ and
 $Pr=1$ data have the same progression. A fit of (4.4) to the
 $Pr=1$ data results in parameters
 $\unicode[STIX]{x1D712}_{2}=1.19$ and
 $\unicode[STIX]{x1D6FE}_{2}=0.76$. However, the results for
 $Pr=8$ give a much slower decrease of
 $\tilde{Re}$ with increasing
 $N_{ff}$ than the other data sets for
 $Pr\leqslant 1$ with fit parameters
 $\unicode[STIX]{x1D712}_{2}=0.44$ and
 $\unicode[STIX]{x1D6FE}_{2}=0.51$. Nevertheless, with the chosen normalisation each data set consistently collapses onto an individual curve for their full Rayleigh number ranges which are
 $2\times 10^{4}<Ra<2\times 10^{6}$ for Yan et al. (Reference Yan, Calkins, Maffei, Julien, Tobias and Marti2019) and
 $10^{7}<Ra<10^{10}$ for Lim et al. (Reference Lim, Chong, Ding and Xia2019). Our initial ansatz (4.3) for the scaling parameter of
 $\tilde{Re}$ included a factor of
 $Pr^{-1/2}$, which was not relevant so far since the considered
 $Pr$ were approximately constant. If the
 $\tilde{Re}$ data in figure 14(b) were to be plotted over
 $N_{ff}/\sqrt{Pr}$, the
 $Pr=1$ and 8 data would shift left of the
 $Pr=0.029$ data by a factor of 0.2 and 0.06, respectively. In this case, however, the common start of the decrease of the Reynolds number would be lifted. Consequently,
 $N_{ff}$ is chosen as the scaling parameter. This comparison of
 $\tilde{Re}$ for different Prandtl numbers suggests that the parameters
 $\unicode[STIX]{x1D712}_{2}$ and
 $\unicode[STIX]{x1D6FE}_{2}$ in the scaling (4.4) are a function of
 $Pr$, but not
 $Ha$. The relation
 $\tilde{Re}(N_{ff})$ seems to be mostly unchanged for
 $Pr\leqslant 1$, though the data display a large scatter. For
 $Pr>1$ the decrease of
 $\tilde{Re}$ with
 $N_{ff}$ however seems to become
 $Pr$-dependent even though this observation can be based on a single data set at
 $Pr=8$ only.
Comparison of the  $Pr$-dependence of the (a) normalised Nusselt numbers over
 $Ha/Ha_{c}$ and (b) normalised Reynolds numbers over
 $N_{ff}$ with simulations by Lim et al. (Reference Lim, Chong, Ding and Xia2019) at
 $Pr=8$ and Yan et al. (Reference Yan, Calkins, Maffei, Julien, Tobias and Marti2019) at
 $Pr=1$. The circles are the present data from figures 9 and 10. The numerical Reynolds numbers are based on the root mean square of the velocity field over the whole fluid volume.

5 Conclusion
In this article, we present measurements of liquid metal Rayleigh–Bénard convection in a cylindrical container of aspect ratio  $\unicode[STIX]{x1D6E4}=1$ under the influence of an external vertical magnetic field of different field strengths. The large-scale flow in the closed cylinder is investigated using temperature measurements at the side wall at half-height in combination with ten ultrasound Doppler velocimetry sensors. It is shown that with increasing magnetic field strength, the initial large-scale circulation known from turbulent convection is first forced into a steady circulation mode by suppressing the regular oscillations of the torsion and sloshing mode. A further increase of the magnetic field causes a breakdown of the one-roll structure into a cellular pattern of multiple convection rolls, which are identified using the spatially resolved velocity data. Finally, the onset of the wall mode regime at Chandrasekhar’s linear instability threshold is confirmed for a whole decade of
 $10^{6}\leqslant Ra\leqslant 10^{7}$: The flow in the centre is nearly fully suppressed and only in the vicinity of the sidewalls is a convective movement of the fluid still present. This regime has received little consideration so far, but is now confirmed in our experiment, together with simulations (Liu et al. Reference Liu, Krasnov and Schumacher2018) and pioneering theoretical studies by Houchens et al. (Reference Houchens, Witkowski and Walker2002) and Busse (Reference Busse2008).
The momentum transport in the convective system is continually decreasing with increasing magnetic field throughout all flow regimes. The normalised Reynolds number is shown to be a function of the free-fall interaction parameter. In contrast, the heat transport stays practically constant throughout most of the LSC regime due to suppression of turbulent oscillations and an increased coherence of the LSC flow. An increase of the Nusselt number for an optimal Hartmann number as in large  $Pr=8$ simulations (Lim et al. Reference Lim, Chong, Ding and Xia2019) is not observed. The decrease of the heat flux through the system sets in once the one-roll structure starts to break down into a cellular structure. Our comparison with numerical data at higher Prandtl numbers shows that the qualitative behaviour of the Hartmann number dependence of the global transport laws is similar to the present liquid metal flow case and that differences arise mainly for the momentum transport at high magnetic field strengths.
Open questions concern in our view mainly the flow dynamics in the cellular regime and the hysteresis effects of the pattern selection. They would require a fine-resolved parameter survey in the region where the LSC and cellular regimes can coexist. Such hysteresis-type switches between different large-scale flow states affect the transport capabilities of the liquid metal flow and can thus for example influence the cooling efficiencies in nuclear engineering devices. Investigations of magnetoconvection in liquid sodium at even lower Prandtl numbers would thus also be desirable.
Acknowledgement
This work is supported by the Deutsche Forschungsgemeinschaft with grants no. GRK 1567, VO2331/1-1, and SCHU 1410/29-1.
Declaration of interests
The authors report no conflict of interest.
Supplementary material
Supplementary material is available at https://doi.org/10.1017/jfm.2020.264.