Introduction
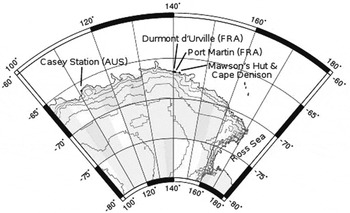
Mawson's Hut was erected at Cape Denison, Commonwealth Bay, East Antarctica (67°0′30″S, 142°39′40″E) (Figs. 1, 2a) in 1912 by the Australasian Antarctic Expedition (AAE). It is now one of only six remaining prefabricated wintering huts built on the Antarctic continent during the period 1897–1917. The hut was first occupied on 11 January 1912 by 18 men, led by Douglas Mawson. The next summer, on 8 February 1913, the relief vessel, MV Aurora, departed Commonwealth Bay without its full complement only hours before Mawson, the sole survivor of a three man far-eastern sledging journey, struggled back to the hut. Mawson was then forced, with six others, to remain at Commonwealth Bay until he was returned to Australia on 5 February 1914 (Mawson Reference Mawson1971; Jacka and Jacka Reference Jacka and Jacka1988).
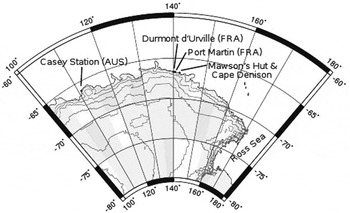
Map of part of East Antarctica indicating the locations of Mawson's Hut, Cape Denison, and Casey, Dumont D'Urville, and Port Martin stations.
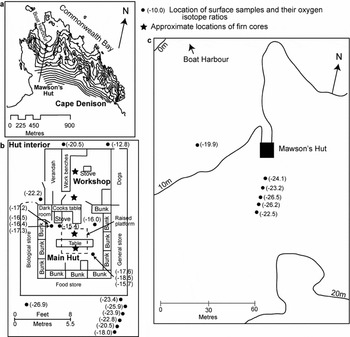
Mawson's Hut is a commonly used descriptor for the Main (living) Hut and Workshop, two prefabricated Baltic pine buildings constructed adjacent to each other. The Main Hut (7.3m2) housed the 18 occupants and provided sleeping, dining, storage and darkroom facilities, while the one-room Workshop (5.5m2), attached to the northern end of the Main Hut, served as a work area (Fig. 2b). Both huts had skylights to take advantage of natural light and a 1.5m wide veranda surrounding the huts on three sides for storage of food and other supplies.
The location of the surface samples and firn cores collected from Mawson's Hut and surrounds. a) Map of Cape Denison region with Mawson's Hut and boat harbour indicated. b) A plan of the Main Hut and Workshop with all measured oxygen isotope ratios (‰) shown at their collection location. There are two areas of the Main Hut near the darkroom and in the southeast corner where there were several surface samples taken down a vertical profile, indicated by a single arrow and a list of three to four oxygen isotope values in order from top to bottom. c) Location of the surface samples that were collected >10m from the huts.

Mawson's Hut has been visited intermittently since it was abandoned in 1914. In 1931 a second British, Australian, and New Zealand Antarctic Research Expedition (BANZARE) visited Cape Denison, spending a few days near the hut. The hut was not visited again until the 1950s when four separate Expeditions Polaires Françaises parties visited from the nearby research station at Port Martin (66°49′04″S, 141°23′39″E) (Fig. 1). In subsequent years, French expedition personnel visited the hut irregularly, reporting that the hut had filled with snow sometime between a 1959 visit and a 1962 visit. Four further French visits were reported during the 1960s and four Australian National Antarctic Research Expedition (ANARE) visits occurred in the early and mid 1970s.
Interest in the heritage value of the site prompted visits to undertake repairs in the 1970s. A cross that was erected as a memorial to Xavier Mertz and Belgrave Ninnis, the two explorers who perished during Mawson's far-eastern sledging journey, was re-erected in 1974. The first repairs to Mawson's Hut were made in 1977 and 1978 when a four-person ANARE team undertook a programme that included structural repairs to the Workshop. To facilitate this work, snow and ice were removed from this building. A privately funded expedition, Project Blizzard (1984–1985 and 1985–1986), was the first to include professional conservators and archaeologists, with the aim of increasing public awareness of Australia's involvement in Antarctica and to conserve Mawson's Hut. Since Project Blizzard, a number of publicly and privately funded expeditions, working on various aspects of the conservation and management of the site, have visited Cape Denison (Ledingham and others Reference Ledingham, Macklan, Ledingham and Brookes1978; Hayman and others Reference Hayman, Hughes and Lazer1999; Godden Mackay Logan Reference Godden Mackay Logan2001; Lazer Reference Lazer2006).
During the 1997 austral summer, the Australian Associated Press (AAP) Mawson's Huts Foundation expedition removed four snow/ice cores each ~2m long from within the Main Hut and Workshop. The cores were initially collected to facilitate a stratigraphic study of the post-occupation deposition of ice and snow. Previous ice excavation in the hut had been very slow and resulted in damage to artefacts (McGowan Reference McGowan1987). Another key reason for the collection of ice cores was to provide information about the physical environment within the hut, that informs conservation strategies to deal with problems, such as rust and fungal growth. The cores were returned to Australia in early 1998 for isotope and structural analysis. Further ice and snow samples were collected as part of an Australian Antarctic Division expedition in 2002–2003. 25 individual samples were retrieved for analysis to establish the time taken for the huts to fill with snow. The rate of fill and the effects of snow and ice on the interior of the huts are important for the development of conservation management plans for Mawson's Hut and possibly also for other huts from the ‘heroic’ era in the Antarctic.
Methodology
Two firn cores, MH-1, and MH-2, were drilled within the Workshop, and another two, MH-3 and MH-4, were drilled within the Main Hut using a Snow, Ice and Permafrost Research Establishment (SIPRE) corer (Fig. 2b). MH-1 is a vertical core drilled through one of the skylights of the Workshop. MH-2 is a horizontal core drilled northward into the Workshop from the tunnel that had been dug from the entrance to gain access to the Main Hut. MH-3 was drilled into the Main Hut at a 30° angle from vertical, through the northern skylight. The core was drilled at this angle in order to avoid damage to the platform below. MH-4 was drilled about 500mm west of the northeastern post about 300mm above the platform. MH-4 was drilled at a 15° angle from horizontal and 25° to the west of north to avoid damage to structures in the Main Hut.
Initially the cores were viewed under fluorescent light to examine visible structural features such as debris and layering. Once an overview of the core was completed, two to four thin sections were cut from each of the four cores perpendicular to the core axis. The thin sections were viewed between cross-polarised filters with background lighting to reveal individual crystals. An area count method similar to that of Li and others (Reference Li, Jacka and Morgan1998) and Donoghue (Reference Donoghue1999) was used to determine mean crystal size.
The structural features and mean crystal sizes were measured as an indicator of melt and refreeze in the core (Table 1). Structural features also indicate whether the cores are composed of compacted snow or melted and refrozen ice and hence provide information on the environment in which the snow was deposited. For example, large mean crystal size indicates that the snow accumulated in an environment of warmer temperatures (Gow Reference Gow1969). The relative number and distribution of bubbles within the core can be used as a rough indicator of whether the snow has melted and refrozen (Paterson Reference Paterson1994).
Mean crystal size in Mawson's Hut firn cores

In addition to the cores, 25 individual surface samples were taken from inside (S1–9) and outside the hut (S10–25) (Fig. 2b) using a stainless steel auger. The auger was drilled into the ice and the resulting shavings of ice were swept onto a clean tray that was emptied into 10mL glass bottles and returned to Australia as water.
Nine of the surface samples were collected from inside the hut. Two sets (S1 and S5–7, and S2–4) of samples from the Main Hut were taken vertically down ice walls or ice slopes (Fig. 2b). S1 and S5–7 were taken from ice near the darkroom in the Main Hut along a vertical profile down the ice wall at 500–1000mm spacing. S2, S3, and S4 were taken from the southeast corner of the Main Hut near the ladder along a vertical profile with 600–800mm spacing. Two samples drilled in the Main Hut were from the floor near the stove (S8) and from an ice column near the northeast platform post (S9) (Fig. 2b).
Samples S10–12 were drilled outside the hut on the downwind side (north) within a few metres of the hut (Fig. 2b). Samples S13–24 were drilled vertically into the snow bank that extends off the southern end of the hut (Fig. 2b). Samples S13–15 were drilled on the west and east side of the snow bank ~1m from the hut. S16–19 were drilled between the hut and the rocks to the south at 1.5m intervals. S20–24 were drilled beyond the rocks at roughly 5m spacing (Fig. 2c). S25 was drilled from the snow covering the blue ice that is located 38m due west of the southwest corner of the Main Hut.
Isotope ratios of the samples were determined by conventional mass-spectrometry methods. Individual sample error is ~0.2‰.
Oxygen isotope ratios were determined for each of the 25 surface samples and for the four cores at 10cm intervals. Because water containing the heavier isotope, 18O, is preferentially condensed out of a cooling mass of atmospheric water vapour, the oxygen isotope ratio of precipitation (usually expressed relative to a standard water as a δ value in ‰) varies as a function of the temperature at the precipitation location. Colder places have precipitation with lower δ18O values and winter snow has lower δ18O values than summer snow. Isotope ratio analysis can thus be used as an indicator of the source of wind-blown snow and the time of year that it fell.
Ice core and surface results
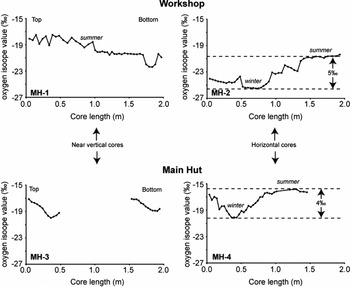
Measured oxygen isotope ratios from the four cores are shown in Fig. 3. The MH-1 core exhibits δ18O values ranging from −17.5 to −22.4‰ with a generally depleting trend with increasing depth. MH-2 oxygen isotope ratios ranged from −20.4 to −25.5‰ with an increasing trend toward the centre of the hut. In the Main Hut, the δ18O value for MH-3 ranged from −17.1 to −20.0‰ and for MH-4 from −15.8 to −20.1‰. The record for MH-3 is incomplete due to a 1m section from the centre of the core that was not available for analysis. MH-4, which is only 1.5m long, shows a rough cyclical trend (Fig. 3).
The results of the oxygen isotope analysis of the four cores retrieved from Mawson's Hut. The tops of the cores are located to the left side of each figure. The season of deposition is also noted in cores 1, 2, and 4 as well as the range in the oxygen isotope ratios between summer and winter for cores 2 and 4.

Oxygen isotope ratios of the individual samples measured inside the Main Hut range from −15.5 to −18.5‰ (Fig. 3). The enriched values are for the samples collected from the ice columns near the stove and platform posts (S8 and S9) and from near the floor (S4), which were possibly refrozen meltwater. The oxygen isotope ratios from snow outside the hut range from −12.8 to −22.2‰ on the downwind side of the hut (S10–12) and −18.0 to −26.9‰ on the upwind side (S13–24). The oxygen isotope ratio for the blue ice sample (S25) was −19.9‰.
The mean ice crystal size of firn in the hut is listed in Table 1. MH-1 and MH-2 both consist of large crystals in a finer matrix. These larger crystals are up to 20–30mm2 and roughly oblong in shape. The crystals in MH-2 are too fine grained to distinguish clearly, therefore an estimate of the crystal size was made. The crystal sizes for MH-3 and MH-4 are finer than in the Workshop cores (MH-1 and MH-2). There is no evidence of veins or other melt structures in the MH-3 and MH-4 cores. The air bubbles throughout all cores are evenly distributed and roughly equal in size.
Discussion
Average annual isotope ratios for coastal Antarctic sites at similar latitudes to Mawson's Hut are highly variable and show strong dependence on the local geography because of its effect on snow source locations. Maritime sites that accumulate precipitation directly from the cyclonic events that circle Antarctica (for example Mill Island, Vernadsky, Rothera) have relatively enriched δ18O values: ~ −12‰ (IAEA 2006). Sites on the coast that are shielded from katabatic wind-transported snow have δ18O ~ −17‰ (e.g. site A on Law Dome, Dumont d'Urville) (Morgan Reference Morgan1982), while locations subject to strong katabatic winds that transport relatively large amounts of snow from the inland plateau have relatively depleted δ18O values: ~–20‰ (IAEA 2006). For instance the GWAM site, just inland of Mawson Station at an elevation of 100m, has a δ18O value of −26‰, considerably depleted compared to −21.4‰ at the Law Dome summit, 120km inland at an elevation of 1400m.
Mean δ18O values from the Mawson's Hut samples are −20.06‰ which puts the site in the katabatic group. This is not an unexpected result, considering the known strong winds at the site as described by Mawson (Reference Mawson1971). During the 683 days of the 1911–1914 AAE the mean wind speed was 19.8m s−1 (Madigan Reference Madigan1929). The winds were especially high during winter (March to November), which is characteristic of katabatic winds. Since these initial records were taken an automatic weather station has been erected at Cape Denison, which has recorded similar wind speeds from the same consistent (south and south-southeast) directions as the 1911–1914 AAE (Parish and Walker Reference Parish and Walker2006). The Mawson's Hut samples have a δ18O range of 10.4‰ (−15.5 to −25.9‰), which is larger than that observed for sites for which there is suitable high resolution data and suggests the snow in and around Mawson's Hut consists of both locally precipitated snow and snow transported from inland by katabatic winds.
There is also a significant difference in δ18O values between the cores that were taken from the Workshop and the cores and individual samples taken from the Main Hut. The variability between samples from the two huts is probably due to the rate at which each hut filled.
When the AAE left Mawson's Hut, the building remained relatively well sealed, limiting the amount of snow ingress. The renowned photographer and member of the AAE, Frank Hurley, returned to Cape Denison in 1931, as part of the second BANZARE voyage. When Hurley photographed the interior of the hut and documented its contents, the only obvious evidence of snow or ice was ice columns located in the Main Hut and Workshop; the rest of the hut remained ice-free. Over time, cracks in the skylights, trap doors, and roof seam capping and general degradation of the roof allowed the entry of snow. It is possible that a door had been left open (Godden Mackay Logan Reference Godden Mackay Logan2001). It is believed that initially both huts filled with snow between 1959 and 1962 (although this snow was removed from the Workshop in 1978).
Workshop
The MH-2 core was drilled ~1m above the floor of the Workshop (Fig. 2b). From the location of the core and the δ18O values, we conclude that accumulation occurred during the first winter after the Commonwealth Bay party cleared the Workshop in 1978, since depleted δ18O values typically indicate (colder) winter accumulation. The general change from depleted to enriched δ18O values in MH-2 suggests the change from winter to spring accumulation.
MH-1 was drilled through the skylight of the Workshop (Fig. 2b). This core exhibits a general enrichment in δ18O towards its bottom, which we interpret to be an indication of summer accumulation at the top of the core and spring to winter accumulation at the bottom. The range of δ18O values measured in the Workshop cores is significantly lower than that typically measured at coastal sites. We infer that the accumulation within the hut is wind-blown snow (via katabatic winds), that originated as precipitation on the Antarctic Plateau. It is believed that the seasonal cycle at Cape Denison is closer to that measured in the Workshop (−17.5 to −25.5‰) than that measured in the Main Hut (15.8 to −20.1‰).
The structural features of the cores indicate they are composed primarily of compacted snow. MH-1 and MH-2 cores consist of larger ice crystals surrounded by compacted snow. The crystal size implies warm temperature deposition, which is expected in this maritime environment. Areas of large crystal size are probably due to snowmelt that has accumulated on the roof and seeped into the hut from the skylight or from water that may have dripped down the stovepipe in the Workshop. The large crystal structures are not extensive enough in the cores to be the result of melt and refreeze events within the hut. It is therefore assumed that the temperature within the hut is not warm enough to cause these regions of large ice crystals.
Main Hut
The cores from the Main Hut (MH-3 and MH-4) and most of the spot samples (S1–7) are from snow that has filled the hut since the AAE abandoned the site in 1914 (Fig. 2). The δ18O values from MH-3 and MH-4 suggest a seasonal cycle (Fig. 3) that possibly resulted in the filling of the top 2–3m of the Main Hut in less than a year. It is difficult to draw any conclusions about MH-3, as the middle section of the core was not available for analysis. The two series of spot samples, one near the stove (northwest corner) and the other near the ladder (southeast corner), exhibit δ18O values that are consistent with the core results (Fig. 2). These samples suggest that the enriched δ18O values observed in the cores are indicative of the rest of the Main Hut. Two of the individual samples, S8 and S9, obtained from the meltwater that covers part of the floor and from an ice column located near the stove respectively exhibit the most enriched δ18O values measured within the hut. The melt samples have enriched δ18O values due to warming and evaporation processes.
Crystal size results from the MH-3 and MH-4 cores suggest that the compacted snow in the Main Hut has not been subjected to thaw and refreeze events after deposition. These two cores are composed of evenly sized crystals (1.42–2.25mm2), similar to the crystal size observed in accumulating maritime snow.
Outside surface samples
The δ18O values obtained from samples outside the hut range from −17.8 to −26.9‰ (Figs. 2b, 2c). These depleted values, similar to those measured in the Workshop, indicate that the snow that has been deposited around the hut precipitated further south and was carried to the coast by katabatic winds.
This relatively large range (−12.8 to −26.5‰) in δ18O values at Cape Denison is due to the deposition mechanism for the area. The enriched δ18O values in the surface samples are likely to be from precipitation that was deposited near the huts. The depleted values are due to the katabatic winds that dominate this coastline, which carried and deposited the snow that had been precipitated further south.
Conclusions
Structural analysis of the four cores and 25 surface samples that were collected in and around Mawson's Hut indicates that there was no significant melt and refreeze occurring within the hut. The isotope analysis of the Main Hut indicates that it probably slowly filled with snow after being abandoned in 1914 but that the last few metres at the top of the hut filled in less than a year. The ice cores from the Workshop do not provide a conclusive result as to how fast or in which months the hut filled after being cleared of snow in 1978. However, the Workshop cores do indicate that the accumulation rate was higher in this hut than in the Main Hut.
The significant difference in the rate of snow ingress between the Workshop and the Main Hut is that the Workshop was emptied of snow in 1978. At that time the weatherproofing was left in a poor state so it is likely the Workshop rapidly filled during the following winter. Strong katabatic winds during winter will have allowed drifting snow from inland to partly fill the workshop with depleted δ18O snow as found in MH-2 compared with the enriched δ18O snow found at the bottom of MH-2 (near the centre of the hut) and the other three cores.
To provide any further conclusions about the accumulation rates within Mawson's Hut an annual snow collection from outside the hut is necessary to provide a comparison with the isotope values obtained inside.
Acknowledgements
We thank David Gillott, Gerard (Ted) Bugg, Paul Delaney, and Geoff Ashley for assistance in drilling ice cores in 1997 and Martin Passingham for assistance in the collection of snow and ice samples in the summer of 2002–2003. We would also like to thank two anonymous reviewers for constructive comments that improved this paper.