


Introduction
Research on voters and their perceptions of political performance has traditionally focused on how voters evaluate policy makers after a government forms, that is, voters’ perceptions of executive performance on outcomes ranging from the state of the economy (Anderson Reference Anderson1995; Duch and Stevenson Reference Duch and Stevenson2008; Hobolt et al. Reference Hobolt, Tilley and Banducci2013; Lewis-Beck et al. Reference Lewis-Beck, Nadeau and Elias2008; Powell Jr and Whitten Reference Powell and Whitten1993), over war casualties (Arena Reference Arena2008; Gartner Reference Gartner2008) to shark attacks (Achen and Bartels Reference Achen and Bartels2012). Accordingly, we know a lot about how voters condition their performance evaluations of governments on their behavior while in office (Anderson Reference Anderson1995; Duch and Stevenson Reference Duch and Stevenson2008; Fortunato et al. Reference Fortunato, Lin, Stevenson and Tromborg2021; Lewis-Beck Reference Lewis-Beck1988). However, we know much less about whether and how voters evaluate party behavior in the government formation process (see Gross et al. Reference Gross, Jankowski, Juen and Erlbruch2024, for an important exception). This is surprising considering that the allocation of ministries to parties is crucial for understanding the way government politics works (Bawn and Rosenbluth Reference Bawn and Rosenbluth2006; Laver and Shepsle Reference Laver and Shepsle1996). For these reasons, this paper examines how voters evaluate party performance during the ministerial allocation stage of government formation and whether their support for parties is conditioned by these evaluations.
Theoretically, we argue that voters use cues from the quantitative (that is, number of ministries) and qualitative (that is, type of ministries) portfolio distribution to evaluate government parties’ competence in coalition negotiations, which in turn shapes party support. We define competence during portfolio allocation negotiations as a party’s ability to extract the greatest possible benefit when it bargains over the distribution of ministries with other parties. If a party obtains many or particularly important portfolios it is a demonstration of competence, and vice versa if it does not. Competence, in turn, conditions party support because it signals a party’s ability to represent the interests of its supporters and implement the policy platform on which it was elected (Fortunato Reference Fortunato2021). If supporters perceive that their interests are no longer represented, they withdraw their support; similarly, if voters in general do not believe that a party can deliver on its policy pledges, they withdraw their support (Naurin et al. Reference Naurin, Soroka and Markwat2019).
Empirically, we use an original and pre-registered survey experiment from the 2022 Danish general election to test whether voters behave as we expect. In this election, there was a wide range of possible coalitions in play, which allows us to test whether and how voters react to a wide variety of possible outcomes while maintaining some experimental realism. Specifically, we test how voters evaluate government party performance in different possible quantitative and qualitative portfolio allocation scenarios prior to the election. Furthermore, we explore whether these types of evaluations matter for party support in both the short and long term based on an original three-wave survey with data from before and after the election.
Our results demonstrate that voters do indeed condition their perceptions of party performance on both the quantitative and the qualitative portfolio distribution. They perceive that parties perform better when they receive more ministries, and especially when the ministries they receive are more powerful or salient from the perspective of the party. The post-election survey further suggests that voters pay attention to the real-world allocation of ministries and that they condition their party support on perceived party performance in the negotiations. However, knowledge of who gets what is conditional on political sophistication. While most voters know the quantitative distribution of portfolios quite well, more sophisticated voters have much more accurate knowledge of the true qualitative distribution of ministries after the government forms.
These results have important implications for research on accountability and party incentives during government formation. With respect to accountability, they support recent work challenging traditional skepticism about voters’ ability to evaluate party performance in complex information environments (Fortunato et al. Reference Fortunato, Lin, Stevenson and Tromborg2021). With respect to party incentives, they align with recent work that argues – but has not empirically demonstrated – that parties with more politically sophisticated voter bases have stronger electoral incentives to pursue portfolios that are especially salient or powerful (Martin and Vanberg Reference Martin and Vanberg2025). We further elaborate on this implication in the concluding section.
Portfolio Allocation, Perceived Competence, and Party Support
The main questions of this paper are whether and how voters infer party competence from portfolio negotiations during government formation, and whether they condition their party support on these competence perceptions. We believe that they do because we know that voters’ party preferences are not only a function of parties’ positions, but also of their perceived level of competence in implementing those positions when they bargain with other parties (Fortunato Reference Fortunato2021). In other words, voters care about parties’ policy goals and their ability to implement them in practice. Given this, we argue that voters are also likely to care about party competence in portfolio negotiations.
Yet understanding party competence in portfolio negotiations poses a major challenge for voters. Portfolio allocation is highly complex because party preferences for different outcomes depend on numerous factors, including the incentives and ambitions of individual politicians, the institutional role of party congresses, and the preferences of the voters themselves (Martin and Vanberg Reference Martin and Vanberg2025). In addition, ministries are typically allocated sequentially (Ecker and Meyer Reference Ecker and Meyer2020), meaning that the value of any given portfolio to a party or politician may shift continuously over the course of the negotiations. Finally, portfolio bargaining typically takes place behind closed doors, leaving citizens to observe only the final allocation of ministries in the new government.
All of this complexity means that answering our question requires a theory of how voters make inferences about party behavior during complex or unobservable processes that lead to observable and interpretable outcomes. A line of research that has made great strides in this regard in recent years has focused on voters’ use of so-called ‘ecologically rational heuristics’ (Fortunato et al. Reference Fortunato, Lin, Stevenson and Tromborg2021; Fortunato and Stevenson Reference Fortunato and Stevenson2019; Gigerenzer et al. Reference Gigerenzer, Hertwig and Pachur2011). Specifically, this literature argues that when it becomes too difficult for voters to evaluate how a party has performed during a political process – because the performance is unobservable or too complex to understand – voters will rely on simple cues to make sensible and, on average, more accurate inferences than they would have made in the absence of such cues.
For these reasons, we expect that voters use simple but sensible cues from the distribution of ministries to understand how competently a party handled the negotiations. The cues should be simple and sensible in the sense that they are both easily observable and related to party goals. We argue that voters are likely to derive such cues from both quantitative and qualitative characteristics of the final portfolio distribution.
Cues from the Quantitative Portfolio Distribution
The quantitative portfolio allocation in parliamentary democracies tends to follow Gamson’s law (Gamson Reference Gamson1961). While the exact mechanism underlying the law is disputed, it holds that a party in government obtains a number of ministerial posts that is proportional to the share of parliamentary seats it contributes to the coalition. Several studies have shown that this proportionality rule holds on average in several countries and over time (Browne and Frendreis Reference Browne and Frendreis1980; Browne and Franklin Reference Browne and Franklin1973; Carroll and Cox Reference Carroll and Cox2007; Warwick and Druckman Reference Warwick and Druckman2006). Yet the law is not deterministic. Parties are sometimes able to use contextual factors or skill to their advantage and negotiate a higher share of ministries for themselves (Ansolabehere et al. Reference Ansolabehere, Snyder, Strauss and Ting2005; Martin and Vanberg Reference Martin and Vanberg2020; Schofield and Laver Reference Schofield and Laver1985).
Given this, we expect that one heuristic voters use to infer party competence is that the more ministries a party obtains, the more competently it negotiated. This heuristic is ecologically rational because it uses a cue that is both simple (the share of portfolios) and sensible (it assumes that parties prefer many over few portfolios). The cue’s relative simplicity is supported by existing research demonstrating that voters generally have accurate knowledge of parties’ true portfolio shares (Lin et al. Reference Lin, Stevenson, Tromborg and Fortunato2017). Accordingly, recent models of coalition bargaining assume (but do not demonstrate empirically) that some voters withdraw their support for parties that obtain a smaller portfolio share than expected (Martin and Vanberg Reference Martin and Vanberg2020). For these reasons, our first hypothesis is as follows.
Hypothesis 1: Voters perceive a coalition partner as more competent in coalition negotiations the larger the share of portfolios the party obtains.
Cues from the Qualitative Distribution of Portfolios (Power)
Parties do not only care about how many ministries they obtain but also about which portfolios they obtain (Browne and Franklin Reference Browne and Franklin1973; Laver and Hunt Reference Laver and Hunt1992). This means that voters can also use characteristics from the qualitative distribution of portfolios to infer party competence. Specifically, voters can observe which portfolios a government party obtains and, based on this, determine whether the party negotiated in a competent way given its goals. This requires that voters know which portfolios parties seek and whether they obtain them.
Certain ministries are generally considered more desirable than others because they are associated with more policy power (Laver and Hunt Reference Laver and Hunt1992; Lin et al. Reference Lin, Stevenson, Tromborg and Fortunato2017; Warwick and Druckman Reference Warwick and Druckman2001). The prime minister’s office is clearly the most powerful ministry in a government (O’Malley Reference O’Malley2007; Warwick and Druckman Reference Warwick and Druckman2001) and the most visible due to the high level of media attention (Klüver and Spoon Reference Klüver and Spoon2020). There is also evidence that most voters both know the party of the prime minister and perceive that this party is more powerful than other government parties (Fortunato et al. Reference Fortunato, Lin, Stevenson and Tromborg2021). It would therefore be ecologically rational for voters to use a prime minister heuristic to infer negotiation performance. Specifically, voters can reasonably infer that a party handled the portfolio allocation phase of government politics more competently if it obtained the prime minister’s office than if it did not. The inference is simple because of the visibility of the prime minister’s office, and it is sensible because of the desirability of the office.
Hypothesis 2: Voters perceive a coalition partner as more competent in coalition negotiations if the party obtains the prime minister’s office.
There is variation in ministry power beyond the prime minister’s office. For example, the Ministry of Finance is usually considered to be among the most important ones (Browne and Franklin Reference Browne and Franklin1973; Druckman and Warwick Reference Druckman and Warwick2005; Laver and Hunt Reference Laver and Hunt1992; Lin et al. Reference Lin, Stevenson, Tromborg and Fortunato2017). If voters perceive this variation as well, they can use it to infer portfolio negotiation competence. There is surprisingly little research on which ministries voters view as being particularly powerful beyond the prime minister’s office, but there is evidence that they are more aware of who obtains ministries that are traditionally considered more powerful (Lin et al. Reference Lin, Stevenson, Tromborg and Fortunato2017). Given this, it would be ecologically rational for voters to use the (perceived) power of ministries as a party competence cue. Since voters seem to understand ministry power, the cue appears to be simple enough for many voters to use, and it is sensible due to the desirability of powerful portfolios.
Hypothesis 3: Voters perceive a coalition partner as more competent in coalition negotiations if the party obtains a portfolio associated with more power.
Cues from the Qualitative Distribution of Portfolios (Issue Salience)
Parties also pay attention to another dimension of the qualitative portfolio distribution, namely issue salience. Specifically, parties seek the portfolios that are most salient to their party program (Bäck et al. Reference Bäck, Debus and Dumont2011). Accordingly, voters can sensibly infer a party’s negotiation competence from its ability to obtain the ministry (or ministries) that deals with the issue (or issues) that is (are) salient to the party’s profile. It is, however, arguably the least simple cue. Using it requires voters to know which ministries each party obtained as well as the relative importance of those ministries to the individual parties.
Despite this, previous research has demonstrated that voters not only tend to know who obtains most ministries, but also that they expect parties to obtain ministries that are relatively more salient to them than to other parties (Lin et al. Reference Lin, Stevenson, Tromborg and Fortunato2017). Voters thus appear to have the prerequisites for using issue salience to infer party competence in coalition negotiations and there is existing evidence, at the aggregate level, that junior coalition partners can benefit electorally from doing so (Greene et al. Reference Greene, Henceroth and Jensen2021). Consequently, our fourth hypothesis is as follows.Footnote 1
Hypothesis 4: Voters perceive a coalition partner as more competent in coalition negotiations if the party obtains a portfolio that is more salient to this party.
Who Uses Portfolio Cues?
While we argue that citizens tend to use simple and sensible cues in general, we do not mean to suggest that everyone necessarily uses the same cues in the same way. The hypotheses presented in this section were developed after the pre-registration based on the recommendation of reviewers. We know from research on partisan-motivated reasoning that many citizens are emotionally attached to the parties they support, and that such attachments can bias their evaluations of party performance (Bartels Reference Bartels2002; Bisgaard Reference Bisgaard2015; Gaines et al. Reference Gaines, Kuklinski, Quirk, Peyton and Verkuilen2007). Likewise, party supporters may be reluctant to use cues from the portfolio distribution that would lead them to infer that their preferred party has underperformed. This would reduce the competency penalty for not obtaining a portfolio. At the same time, party supporters may also be more inclined to view the acquisition of a portfolio as evidence of competence when it is their party that obtains it. This would amplify the competency effect. As such, partisan-motivated reasoning could both weaken or strengthen the link between portfolio outcomes and perceived party competence.
Hypothesis 5a: The effects of obtaining quantitatively and qualitatively better portfolio allocation outcomes on perceived party competence are weaker among voters who support the party.
Hypothesis 5b: The effects of obtaining quantitatively and qualitatively better portfolio allocation outcomes on perceived party competence are stronger among voters who support the party.
Political sophistication also influences whether and how individuals respond to different types of cues from their political context (Fortunato and Stevenson Reference Fortunato and Stevenson2019; Lin et al. Reference Lin, Stevenson, Tromborg and Fortunato2017). For portfolio allocations specifically, Martin and Vanberg (Reference Martin and Vanberg2020) theorize that more politically sophisticated voters pay more attention to complex negotiation pay-offs than less sophisticated voters. While these pay-offs could extend beyond the attainment of specific ministries (for example, in written coalition agreements), we have variation on complexity in the portfolio allocation cues we zoom in on. Among these cues, power and issue salience are clearly the most complex. Using these cues requires not only knowing which ministries a party obtained, but also understanding the institutional power of those ministries and their relative importance to the negotiating parties. Consequently, less politically sophisticated voters may be less likely to use ministry power and salience to infer competence.
Hypothesis 6a: The effects of obtaining more powerful portfolios on perceived party competence are weaker among voters who are less politically sophisticated.
Hypothesis 6b: The effects of obtaining more salient portfolios on perceived party competence are weaker among voters who are less politically sophisticated.
We also do not expect voters to assess portfolio allocations in a vacuum. Rather, they are likely to approach them with prior expectations about which parties will obtain which ministries. When a party receives more desirable portfolios than anticipated, voters may assign it a competence bonus. Conversely, when a party fails to secure the portfolios voters expected it to obtain, it may incur a competence penalty. However, the mechanisms of reward and punishment may be asymmetrical because voters have a tendency to prioritize negative information over positive information (Soroka Reference Soroka2014). Voters may therefore penalize parties more harshly for failing to meet expectations than they reward parties for exceeding them. If so, the net competence effect of getting a desirable portfolio allocation outcome – relative to an undesirable one – will be stronger when voters expected the party to get the desirable outcome in the first place.
Hypothesis 7: The effects of obtaining quantitatively and qualitatively favorable portfolio allocation outcomes on perceived party competence are stronger among voters who initially expect the party to obtain such outcomes.
The hypotheses so far take knowledge of the information input for granted. Yet, if voters do not know who gets what in the real world, then they clearly cannot use actual portfolio allocation outcomes to infer competence. Lin et al. (Reference Lin, Stevenson, Tromborg and Fortunato2017) find that voters tend to have very strong knowledge of the quantitative distribution of portfolios, but somewhat weaker knowledge of the qualitative distribution. This suggests that while knowledge of the quantitative distribution of portfolios is widespread, knowledge of the qualitative distribution may be more conditional on political sophistication. If so, political parties have a stronger incentive to pay attention to qualitative aspects of portfolio allocation when their voter base is more politically sophisticated – not because politically sophisticated voters are more likely to apply information about qualitative portfolio allocations when they have it, but rather because they are more likely to obtain this information in the first place.
Hypothesis 8: Political sophistication is more strongly associated with knowledge of which parties obtain which ministries than with the number of ministries each party obtains.
Finally, the implications of voters’ inferences about party competence for party incentives clearly also depend on whether voters actually condition their support on these perceptions. If no such relationship exists, parties do not have an electoral incentive to pay attention to voters when they negotiate the portfolio distribution. We argue that such a relationship is likely to exist because we know that voters use their perceptions of competence in coalition negotiations more broadly to inform their party preferences (Fortunato Reference Fortunato2021). From the perspective of voters, this makes sense because competence in coalition negotiations signals a party’s ability to represent its supporters and implement its policy pledges – something voters are particularly likely to hold parties accountable for if they fail to do (Naurin et al. Reference Naurin, Soroka and Markwat2019). To be sure, being competent in one area (portfolio allocation negotiations) does not necessarily mean that the party is competent in other areas (for example, policy development). Yet obtaining many or particularly desirable portfolios is an important first step towards delivering on policy commitments, and voters may use their perceptions of competence in one area to infer competence in others. Thus, our final hypothesis is as follows.
Hypothesis 9: Voters are more likely to support parties they perceive as more competent during coalition negotiations.
Experimental Research Design
To test our hypotheses, we implemented a panel survey with an initial wave fielded in the five days leading up to the Danish 2022 election on 1 November, followed by subsequent waves immediately after government formation and one year later. This section describes a survey experiment embedded in the first wave, which we use to test Hypotheses 1–7. The section Experimental Results presents the results from this experiment. In the section Implications for Accountability, we turn to the post-election surveys used to test Hypotheses 8 and 9.
Case Selection
Denmark has historically had two relatively stable party blocs competing for government, each with a well-defined prime ministerial candidate. The ‘red bloc’, composed of left-of-center parties, has typically been led by the Social Democratic Party, while the ‘blue bloc’, composed of right-of-center parties, has typically been led by either the Liberal Party or the Conservative Party.
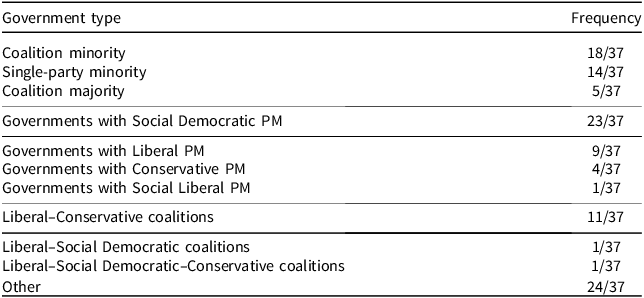
Yet the 2022 election campaign was unusual because Social Democratic Prime Minister Mette Frederiksen announced that she would seek to form a ‘broad coalition’ government, including at least one major party from the ‘blue bloc’ alongside the Social Democrats. As shown in Table 1, such an arrangement is highly uncommon in Danish political history, as the Social Democrats have rarely governed with either the Conservatives (most recently in 1945) or the Liberals (most recently in 1979). Moreover, both the Conservatives and the Liberals declared that they would seek the prime ministership for themselves after the election.
History of Danish governments since 1945

Table 1. Long description
A table showing the frequency of different types of governments in Denmark since 1945. The table has two columns: Government type and Frequency. The Government type column lists various types of governments, and the Frequency column shows how often each type occurred. The table includes 12 rows of data. Row 1: Coalition minority, 18/37. Row 2: Single-party minority, 14/37. Row 3: Coalition majority, 5/37. Row 4: Governments with Social Democratic PM, 23/37. Row 5: Governments with Liberal PM, 9/37. Row 6: Governments with Conservative PM, 4/37. Row 7: Governments with Social Liberal PM, 1/37. Row 8: Liberal-Conservative coalitions, 11/37. Row 9: Liberal-Social Democratic coalitions, 1/37. Row 10: Liberal-Social Democratic-Conservative coalitions, 1/37. Row 11: Other, 24/37.
Because of this new situation, there was a great deal of uncertainty about which government would form and how the individual ministries would be allocated. The uncertainty was heightened because a new party outside the bloc structure, the Moderates, campaigned primarily on the goal of supporting a ‘broad coalition’, and was the pollster favorite to become the seat-weighted median party, thereby playing a pivotal role in deciding who should enter government (see Figure 1). In the end, the ‘red bloc’ retained a one-seat majority, but the Social Democrats nevertheless chose to form a majority ‘broad coalition’ with the Moderates and the Liberals as junior partners. The government negotiations were the longest in Danish political history (42 days).
Polling trends for the red bloc, blue bloc, and the Moderates during 2022.

This contextual foundation provides a unique opportunity to randomize different hypothetical – yet reasonably plausible – portfolio allocation outcomes to voters. In our experimental set-up (explained in more detail below), we vary our portfolio allocation dimensions of interest for a coalition between the Social Democrats, the Liberals, and the Conservatives – the three parties contending for the prime minister’s office. To be sure, this was not the most likely government formation outcome, but it was also not an impossible one.Footnote 2 In Danish government formation history, the seat-weighted median party – which was expected to be the Moderates – has traditionally been pivotal in determining which parties form the government. Whether this party joins the government itself depends on whether it has sufficient ‘office capacity’ – that is, a sufficient number of MPs to cope with the practical tasks of governing (Skjæveland Reference Skjæveland2009).
Moreover, the office of the prime minister has previously been held by the smallest coalition party (from 1968 to 1971) and it is a possibility that occasionally comes up in the political debate (for example, in 2006 when the leader of the Social Liberals announced that she would aim to form such a coalition). A coalition in which a smaller party obtained the prime minister’s office would therefore not be entirely unfamiliar to Danish voters and, for this particular constellation of parties (that is, the three parties competing for the prime minister’s office), could reflect a situation in which the Moderates became the seat-weighted median party, but lacked sufficient office capacity to join the government itself. While we acknowledge that not all voters are likely to have had this precise scenario in mind, they were certainly aware that an unusual ‘broad coalition’ could form after the election, as prominent parties campaigned on facilitating it.
Experimental Design
The survey experiment in the first wave was fielded online and immediately before the 2022 general election in Denmark (27 October 2022 to 1 November 2022). Respondents (only eligible voters) were recruited through the survey company Epinion. The respondents are generally demographically representative of the Danish voting age population (see Table A.3 in Appendix B), and most of the results are robust to using survey weights to account for remaining imbalances (see Table A.6 in Appendix F). The experiment and model specifications for the test of the first four hypotheses are pre-registered at https://doi.org/10.17605/OSF.IO/H9VCB.Footnote 3
The survey design proceeded in three parts. First, we asked the respondents to rate how important they considered three ministries (the Ministry of Defense, the Ministry of Social Affairs and Old Age, and the Ministry of Food, Agriculture and Fishing) for the three parties with ambitions for the prime minister’s office (the Social Democrats, the Liberals, and the Conservatives), and to rate the ministries in terms of their overall power. This was done to assess the average perceived salience and power of the portfolios we use for the experiment. Descriptive statistics for these perceptions are displayed in Table 3 and discussed in the next subsection, while their distribution is illustrated in Figure A.1 in Appendix C.
Historical data on portfolio allocations in Denmark

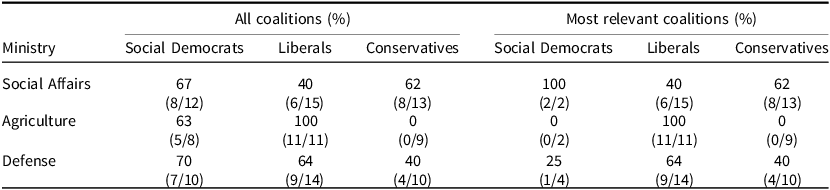
Table 2. Long description
A table comparing portfolio allocations in Denmark across different coalitions and ministries. The table has four rows and six columns. The columns are labeled as All coalitions (percent) and Most relevant coalitions (percent), with sub-columns for Social Democrats, Liberals, and Conservatives. The rows are labeled as Ministry, with specific ministries being Social Affairs, Agriculture, and Defense. Each cell contains a percentage value followed by raw numbers in parentheses. For Social Affairs, the percentages for All coalitions are 67 for Social Democrats, 40 for Liberals, and 62 for Conservatives. For Most relevant coalitions, the percentages are 100 for Social Democrats, 40 for Liberals, and 62 for Conservatives. For Agriculture, the percentages for All coalitions are 63 for Social Democrats, 100 for Liberals, and 0 for Conservatives. For Most relevant coalitions, the percentages are 0 for Social Democrats, 100 for Liberals, and 0 for Conservatives. For Defense, the percentages for All coalitions are 70 for Social Democrats, 64 for Liberals, and 40 for Conservatives. For Most relevant coalitions, the percentages are 25 for Social Democrats, 64 for Liberals, and 40 for Conservatives. The table provides historical data on the share of ministers from each party heading different ministries in Denmark since 1945.
Note: ‘All coalitions’ are all coalition governments in Denmark since 1945 that included the party in the column. ‘Most relevant coalitions’ are restricted to coalition governments that also included one of the two other parties. Percentages indicate the party’s total share of all the ministers that have headed the ministry. Each government can have multiple ministers for the same ministry. Raw numbers are in parentheses.
Descriptive statistics

Table 3. Long description
A table comparing the perceived importance and power of three ministries across three political parties. The table has four rows and five columns. The columns are labeled Social Democrats, Liberals, Conservatives, and Power. Each column is divided into Mean and SD sub-columns. The rows are labeled Social Affairs, Defense, and Agriculture. Row 1: Social Affairs, Social Democrats Mean 6.98, Social Democrats SD 2.43, Liberals Mean 6.06, Liberals SD 2.22, Conservatives Mean 5.96, Conservatives SD 2.27, Power Mean 5.33, Power SD 2.33. Row 2: Defense, Social Democrats Mean 6.64, Social Democrats SD 2.24, Liberals Mean 7.38, Liberals SD 2.05, Conservatives Mean 7.35, Conservatives SD 2.22, Power Mean 6.50, Power SD 2.12. Row 3: Agriculture, Social Democrats Mean 5.86, Social Democrats SD 2.26, Liberals Mean 7.13, Liberals SD 2.17, Conservatives Mean 6.27, Conservatives SD 2.06, Power Mean 5.37, Power SD 2.22.
Note: sample of Danish voters in October 2022. n = 1,427.
Second, we introduced an attention check, also called a ‘screener’. Specifically, we asked respondents to indicate which of seven daily activities (for example, ‘cooking’ and ‘cleaning’) they spent most time on, and then asked them to tick the box for ‘laundry’.Footnote 4 The purpose was twofold: to get an indication of how thoroughly respondents read the questions (53 per cent of the sample ticked the correct box, which is a fairly typical number for this type of question [Berinsky et al. Reference Berinsky, Margolis and Sances2014]), and to reduce the risk that our pre-treatment questions might influence our post-treatment outcomes by asking respondents to consider a completely unrelated topic first.
Third, as the experimental treatment, respondents were instructed to read a short paragraph about a potential future government formation involving the Social Democrats, the Liberals, and the Conservatives. The treatment read as follows:
‘Please take a moment to consider this potential outcome of the upcoming parliamentary election. Imagine that the Social Democrats, Liberals, and Conservatives entered a coalition together. [Party X] gets [X] portfolios and controls the prime minister’s office and the [X ministry] among others, [Party Y] gets [Y] ministries and controls the [Y ministry] among others, and [Party Z] gets [Z] ministries and controls the [Z ministry] among others. How competently would you say that each of the three parties handled the coalition negotiations in this situation?’
The party composition of the government was constant, but the portfolio allocation varied across respondents. The prime minister’s office was randomly assigned to one of the three parties. Furthermore, the three portfolios (the Ministry of Defense, the Ministry of Social Affairs and Old Age, and the Ministry of Food, Agriculture and Fishing) were randomly assigned. The order of the ministries and the order of the parties was also randomized to prevent ordering effects on the outcome (except for the prime minister’s office, which was always mentioned first). Each party and ministry was mentioned only once, meaning that each party could win only one ministry in each treatment text. Finally, the number of portfolios that each party received varied randomly, but with the constraints that the Social Democrats (the party with the largest expected vote share) received at least 8, the Liberals and Conservatives received at least 4 each, and the total number of portfolios summed to 20.Footnote 5 After reading the paragraph, the respondents rated how competently each of the three parties had handled the coalition negotiations in the hypothetical scenario on a scale from 0 to 10, with 10 meaning high competence and 0 meaning low competence.
Perceived Ministry Power and Salience
The three ministries mentioned in the experimental treatment text were chosen with the intention of achieving variation on both the perceived level of power and the perceived party-level salience of each ministry. We expected the Ministry of Food, Agriculture and Fisheries to be particularly salient to the Liberals, given their origins as an agrarian party in Denmark (Stubager et al. Reference Stubager, Hansen, Lewis-Beck and Nadeau2021). We expected the Ministry of Defense to be particularly salient to the Conservatives due to their ownership of defense-related issues (Damsbo-Svendsen and Seeberg Reference Damsbo-Svendsen, Seeberg, Hansen and Stubager2024). Finally, we expected the Ministry of Social Affairs to be particularly salient to the Social Democrats, reflecting their historical role as a working-class party and in building the Danish welfare state (Stubager et al. Reference Stubager, Hansen, Lewis-Beck and Nadeau2021).
These expectations are consistent with traditional party group-to-ministry pairings in Western Europe (Budge and Keman Reference Budge and Keman1990). They are also largely consistent with the historical patterns of portfolio allocations as presented in Table 2. The Liberal Party has received the Ministry of Agriculture in all governments it has been part of since 1945, and the Social Democrats have received the Ministry of Social Affairs in all governments they have been part of together with the Liberals (the Conservatives and the Social Democrats have not been in a government together since 1945). Interestingly, the Conservatives have obtained the Social Ministry more frequently than the Ministry of Defense, but this is likely due to the fact that all of the coalition governments they have been part of have contained other center-right parties, for whom the Ministry of Defense is also salient.
In terms of power, we expected the Ministry of Defense to be perceived as the most powerful. While this has not historically been the case, the ministry has gained considerable importance following the onset and escalation of the war in Ukraine. Its perceived importance is further underscored by the fact that the Liberal Party leader secured this portfolio for himself after the election. We further expected the Ministry of Social Affairs to be perceived as more powerful than the Ministry of Food, Agriculture and Fisheries. Although the latter has historically been an influential portfolio, its importance has declined as the food and agriculture sector has shrunk substantially over time and it now accounts for less than 3 per cent of Danish GDP (Landbrug & Fødevarer 2026). The Ministry of Social Affairs remains an important portfolio, although some of its areas of responsibility have gradually been transferred to other ministries over time.
Most of our expectations regarding voter perceptions of ministry power and salience bore out as illustrated in Table 3 (for the full response distributions see Figure A.1 in the Appendix). The Ministry of Defense was perceived as the most powerful ministry and more salient to the Conservatives than to the Social Democrats. Further, the Ministry of Social Affairs was perceived as more salient to the Social Democrats than to the Liberals and Conservatives, and the Ministry of Food, Agriculture and Fisheries was perceived as being most salient to the Liberals. Contrary to our expectations, however, the Ministry of Defense was perceived as more salient to the Liberals than to the Conservatives (though this difference is statistically insignificant). Likewise, the Ministry of Social Affairs was considered less powerful than (though again statistically indistinguishable from) the Ministry of Food, Agriculture and Fisheries.
Individual-Level Characteristics
To account for potential individual-level heterogeneity in the results (Hypotheses 5–7), we also asked respondents about their vote intention (Hypotheses 5a and 5b), their level of political interest (Hypotheses 6a and 6b), and their prior expectations about government formation outcomes (Hypothesis 7). For vote intention we simply asked respondents who they expected to vote for in the upcoming election. For political interest (our measure of political sophistication), we asked respondents to self-evaluate their level of political interest on a 1–4 Likert scale ranging from 1 (‘not interested at all’) to 4 (‘very interested’). Finally, we measure expectations about the government formation outcome using a question asking the survey respondents to indicate which parties they thought would get into office (with respondents free to choose among all eligible parties). In retrospect, we would also have liked a direct measure of which portfolios the survey respondents expected each party to get. The question we use measures whether each respondent expected each party to get any portfolios at all.
Statistical Models
For the analysis of the survey experiment, we stack the data to make the unit of analysis the respondent-party. We then estimate four regression models using OLS with cluster-corrected standard errors by respondents.Footnote 6 In the first model, we regress the perceived competence of the party on (1) the number of portfolios, (2) whether the party obtained the prime minister’s office, (3) a dummy for each of the three (non-PM) ministries, and (4) a dummy for each party. This allows us to capture the average effect of receiving each treatment condition and thus provides a direct test of Hypotheses 1 and 2. We rescale the number of portfolios to range from 0 to 4 within each party. For the Social Democrats, 8 portfolios (the minimum) are coded as 0 and 12 portfolios (the maximum) as 4, with intermediate values increasing linearly (that is, 9 = 1, 10 = 2, 11 = 3). For the Liberals and the Conservatives, 4 portfolios (the minimum) are coded as 0, and 8 portfolios (the maximum) as 4, again with intermediate values increasing linearly.Footnote 7
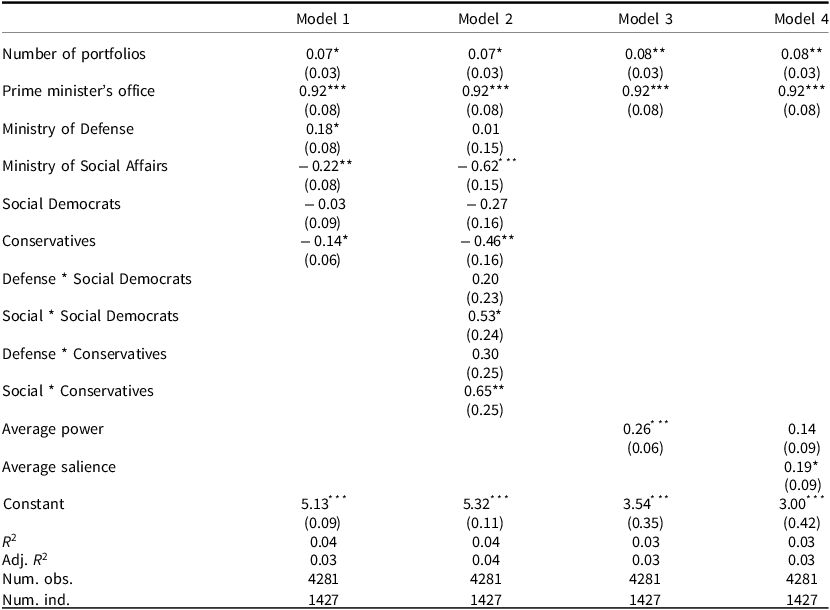
In the second model, we add interaction terms for the portfolios and the party dummy variables. This allows us to capture party-specific effects of receiving a particular portfolio (Hypothesis 4). In the third model, we regress the perceived competence of the party on (1) the number of portfolios, (2) whether the party obtained the prime minister’s office, and (3) the average perceived power of the portfolio (that is, averaging power across respondents). This allows us to estimate the average effect of power across all ministries (Hypothesis 3). In the fourth model, we add the average perceived salience of the portfolio (that is, averaging salience across respondents for each party). This allows us to test Hypothesis 4, comparing across all portfolios (whereas Model 2 only allows us to compare two party portfolios at a time). The estimated coefficients from these models are presented in Table 4.Footnote 8
Average marginal component effects (AMCE) on perceived party competence

Table 4. Long description
A table with four rows and thirteen columns comparing the average marginal component effects (AMCE) on perceived party competence across four models. The columns are labeled as Model 1, Model 2, Model 3, and Model 4. The rows are labeled with different variables and their corresponding values and standard errors. The variables include Number of portfolios, Prime minister’s office, Ministry of Defense, Ministry of Social Affairs, Social Democrats, Conservatives, Defense * Social Democrats, Social * Social Democrats, Defense * Conservatives, Social * Conservatives, Average power, Average salience, Constant, R^2, Adj. R^2, Num. obs., and Num. ind. Each model presents the coefficients and standard errors for these variables. Notable trends include significant coefficients for the Prime minister’s office across all models and varying effects for other variables across different models.
***p < 0.001; **p < 0.01; *p < 0.05 Robust standard errors clustered by individuals in parentheses.
Adj. R 2 = Adjusted R 2, Num. obs = Number of observations, Num. ind. = Number of individuals.
Finally, for the tests of individual-level heterogeneity (Hypotheses 5–7), we estimate a fifth model. In this model, we include a dummy variable that measures whether the respondent expected to vote for the party being evaluated (1 if yes, 0 if no), a political interest variable ranging from 1 (‘not interested at all’) to 4 (‘very interested’), and a dummy variable that measures whether the respondent expected the evaluated party to get into government (1 if yes, 0 if no). Using each of these variables, we replicate Model 3, interacting them with portfolio share, the dummy variable for the prime minister’s office, average power, and average salience (we replicate Model 4 for the salience interaction in a sixth model).Footnote 9
Experimental Results
Average Effects of Portfolio Cues (Hypotheses 1–4)
The results from tests of Hypotheses 1–4 are summarized as regression coefficients in Table 4. The dependent variable measures perceived competence on a 0–10 scale. The omitted ministry and party in Models 1 and 2 are Agriculture and the Liberals, respectively. Before turning to the hypothesis tests, we note that the R 2 values are relatively low across all models. There are two likely reasons for this. First, perceived competence is shaped by additional factors beyond those captured by our measures, such as partisan preferences. Second, some degree of stochastic error is inevitable (for example, due to respondents interpreting the competence scale in different ways). While the latter cannot be directly addressed, the section Individual-Level Heterogeneity speaks to the former by analyzing whether the results vary systematically across individual-level characteristics.
We begin the analysis with Hypothesis 1, that parties are considered more competent when they obtain a higher number of portfolios. Across all four models, we find evidence in favor of this hypothesis. For each additional portfolio obtained (holding the total number of portfolios constant at 20), a party will be perceived as approximately 0.07 units more competent on the 0–10 scale. This is a substantively small effect (the standard deviation of perceived party competence is 2.54), but it does suggest that party portfolio shares influence voter perceptions of negotiation competence.
Next, we turn to our test of Hypothesis 2 and 3, that obtaining the prime minister’s office and other powerful portfolios, respectively, increases a party’s perceived competence. Across all four models, we observe a strong positive effect of obtaining the prime minister’s office: a 0.92 unit increase in competence evaluations, which is equivalent to 0.36 standard deviations in perceived competence. We thus find strong evidence in favor of Hypothesis 2 in terms of both statistical significance and substance.
The most relevant test of Hypothesis 3 on ministerial power is provided in Model 3 where we do not include the issue salience variable, which measures both power and party-specific salience. We also find evidence in favor of this hypothesis. When a party obtains a ministry that the average voter perceives as more powerful, then the party is perceived to have handled the coalition negotiations more competently. Specifically, a one-unit increase in average perceived power on the 0–10 scale leads to a 0.26 unit increase in perceived competence. The difference between obtaining the most powerful ministry (the Ministry of Defense) relative to the least powerful ministry (the Ministry of Social Affairs) thus results in a positive 0.30 bump on the 0–10 competence scale. This implies, for example, that the difference between obtaining Defense and Social Affairs is roughly equal to four additional portfolios.
Finally, in order to test whether the party-specific salience of portfolios matters (Hypothesis 4), we turn to Models 2 and 4. The results from Model 2 show a clear linear trend visualized in Appendix K: if a ministry is perceived as more salient to one party than another then this party also receives a larger competence bonus for obtaining this ministry. The disadvantage of Model 2, however, is that each comparison is composed of a subset of observations, which means that it is less useful for testing whether the average effect of party-issue salience is statistically significant. For this purpose, we use Model 4 where the average party-salience coefficient indicates the average effect of a ministry’s salience to a party, independent of how powerful that ministry is generally perceived to be. This coefficient is statistically significant and substantively relevant. Specifically, a one-unit increase in the salience of a ministry to a party leads to a 0.19 increase on the party competence scale.
Figure 2 illustrates the average marginal effects of our main explanatory variables (that is, a one-unit increase in each independent variable). The figure shows that while both quantitative and qualitative portfolio allocations matter, the qualitative distribution is key to understanding voter perceptions of party competence in coalition negotiations. Obtaining the prime minister’s office is clearly the most important aspect of this distribution. However, portfolio quality also matters beyond the prime minister’s office. The estimated effect of a one-unit increase in both the power and salience variables is more than twice as great as the estimated effect of obtaining an additional ministry. This is not trivial considering that there is a lot of variation in both how powerful and salient voters perceive the ministries to be. For example, the Ministry of Defense is considered more than one unit more powerful than the two other ministries on the power scale (Table 3), and there is even greater variation at the individual voter level within ministries (indicated by the standard deviation being greater than two units in Table 3 for all ministries). This suggests that the qualitative distribution of ministries influences competence perceptions in substantively important ways at both the aggregate and individual levels.
Average marginal effects of main explanatory variables.
Note: estimates of portfolio share and prime minister’s office based on Model 1, average power based on Model 3, and average salience based on Model 4 (Table 4). Number of observations 4,281, number of individuals 1,427.

Individual-Level Heterogeneity (Hypotheses 5–7)
The results from the analyses of individual-level heterogeneity (hypotheses 5–7) are summarized in Figure 3. This figure presents the coefficients on the interaction terms when we interact vote intention, political interest, and prior expectations with the variables measuring portfolio share, whether the party obtained the prime minister’s office, average power, and average salience. Substantively, a point estimate close to zero thus means that the average effect of a given cue – as presented in Figure 2 – does not vary by the voter characteristic in question.Footnote 10
Coefficient plot of interaction effects on perceived competence.
Note: estimates of interaction effects based on Model A.30 in Table A.10 in the Appendix. n = 4,275.

Figure 3 shows little evidence that individual-level characteristics condition the effect of portfolio allocation cues on perceived party competence (though we note that the introduction of the interaction terms increases uncertainty around the estimates). Most of the interaction term coefficients are statistically insignificant and several are close to zero. There are, however, some important exceptions. Most importantly, the competence bonus for obtaining the prime ministry is much stronger among the subset of voters who support the party. A similar, though weaker, pattern emerges for the number of portfolios obtained. In other words, party supporters appear to place greater weight on what their preferred party obtains (Hypothesis 5b).
Finally, we find that the competency effect of receiving the prime minister’s office is stronger among more sophisticated voters. This is a bit puzzling because it is arguably the most visible ministry, but it likely has to do with the context of the particular election. Specifically, the prime minister’s office was more contested than in previous elections and more sophisticated voters were more likely to know this and thus reward the party that obtained it. Nevertheless, our main takeaway from Figure 3 is that the use of cues is generally quite universal, with the main exception of party supporters evaluating their own party.
Implications for Accountability
Voters’ Factual Knowledge (Hypothesis 8)
To test Hypothesis 8 and 9 regarding knowledge and the competency-to-support linkage, we implemented a post-election survey using the same respondents immediately after the portfolios had been negotiated and publicized. The survey was in the field for 17 days (19 December 2022 to 5 January 2023) and was designed to test the mechanisms that are necessary in order for the real portfolio allocation outcome to influence party support. A total of 902 respondents out of the original 1,472 participated in the follow-up study, resulting in a response rate of 63 per cent.
For Hypothesis 8, we first asked the respondents to report the number of portfolios each coalition partner obtained. Respondents were told in the question prompt that there was a total of 23 ministries (that is, the true number of portfolios) and were required to put in a non-negative number below 24 for each party. Figure 4 shows the distribution of answers for each party as well as the distribution of the total sum of portfolios. The solid lines indicate the true answers, and the two dashed lines indicate the average response for high-interest voters (3 and 4 on the political interest scale) and low-interest voters (1 and 2 on the interest scale), respectively.
Perceived quantitative portfolio allocation.
Note: sample of Danish voters December 2022. High-interest respondents (n = 623) and low-interest respondents (n = 276).

Figure 4. Long description
The image contains four histograms, each representing the distribution of portfolio allocations for different political portfolios. Panel A: The histogram for Social Democratic Portfolios shows the frequency distribution of the number of portfolios. The x-axis represents the number of portfolios, ranging from 0 to 20, and the y-axis represents the frequency, ranging from 0 to 300. The actual number of portfolios is marked by a solid vertical line, while the high interest average and low interest average are marked by dashed vertical lines. The distribution peaks around 10 portfolios. Panel B: The histogram for Liberal Portfolios shows a similar frequency distribution. The x-axis ranges from 0 to 20, and the y-axis ranges from 0 to 400. The actual number of portfolios is marked by a solid vertical line, with the high interest average and low interest average marked by dashed lines. The distribution peaks around 10 portfolios. Panel C: The histogram for Moderate Portfolios shows the frequency distribution with the x-axis ranging from 0 to 20 and the y-axis ranging from 0 to 400. The actual number of portfolios is marked by a solid vertical line, with the high interest average and low interest average marked by dashed lines. The distribution peaks around 5 portfolios. Panel D: The histogram for Total Portfolios shows the frequency distribution with the x-axis ranging from 0 to 30 and the y-axis ranging from 0 to 600. The actual number of portfolios is marked by a solid vertical line, with the high interest average and low interest average marked by dashed lines. The distribution peaks around 10 portfolios.
In all three cases, the results clearly show that a large number of respondents have exact knowledge of the quantitative portfolio allocation: 37.8 per cent correctly assigned 11 portfolios to the Social Democrats, 42.4 per cent correctly assigned 7 portfolios to the Liberals, and 44.8 per cent correctly assigned 5 portfolios to the Moderates. Many of the remaining respondents were very close, which indicates that voters are quite knowledgeable about the quantitative portfolio distribution. This holds true regardless of whether voters are politically sophisticated or not. In either case, the average voter has a good understanding of the real share of portfolios each party received.
Next, Figures 5 and 6 summarize voters’ knowledge about the qualitative aspects of the portfolio allocation.Footnote 11 All respondents were asked about party roles in the new government and which coalition member controls the Ministry of Defense. Further, a random subset were asked about the Ministries of Social Affairs and Agriculture. Figure 5 shows the distribution of party role answers for the Social Democrats. As one might expect, almost everyone knew that this was the party of the prime minister regardless of their political interest. However, knowledge of the three other portfolios depends much more on sophistication. A plurality of high-interest voters gave the correct answer in all three cases. In fact, an impressive 87 per cent of these voters knew that the Liberals obtained the Ministry of Defense. For low-interest voters, on the other hand, the modal answer was ‘don’t know’ for the Ministries of Social Affairs and Agriculture, and for the Ministry of Defense the share of correct answers was much lower than for the high-interest group (53.6 per cent for low-interest voters).
Attribution of government roles to the Social Democrats.
Note: sample of Danish voters December 2022. ‘Which answer represents the role of the Social Democrats with regard to the newly formed government?’ High-interest respondents (n = 624) and low-interest respondents (n = 276).

Perceived qualitative portfolio allocation.
Note: sample of Danish voters December 2022. ‘Which party obtained the following ministries?’: Ministry of Social Affairs (high interest n = 150 and low interest n = 63), Ministry of Defense (high interest n = 624 and low interest n = 276), and Ministry of Agriculture (high interest n = 144 and low interest n = 56).

Figure 6. Long description
Panel A: A bar graph comparing the perceived interest levels for the Minister of Social Affairs among different political groups. The horizontal axis lists the groups: SocDems, Libs, Mods, and DK. The vertical axis represents the percentage of interest ranging from 0 percent to 100 percent. The bars are grouped by high and low interest levels, with high interest in dark gray and low interest in light gray. SocDems show 44.0 percent high interest and 25.4 percent low interest. Libs have 18.0 percent high interest and 12.7 percent low interest. Mods exhibit 8.7 percent high interest and 7.9 percent low interest. DK shows 29.3 percent high interest and 54.0 percent low interest. Panel B: A bar graph comparing the perceived interest levels for the Minister of Defense among different political groups. The horizontal axis lists the groups: SocDems, Libs, Mods, and DK. The vertical axis represents the percentage of interest ranging from 0 percent to 100 percent. The bars are grouped by high and low interest levels, with high interest in dark gray and low interest in light gray. SocDems show 4.6 percent high interest and 5.8 percent low interest. Libs have 87.0 percent high interest and 53.6 percent low interest. Mods exhibit 1.6 percent high interest and 4.7 percent low interest. DK shows 35.9 percent high interest and 6.7 percent low interest. Panel C: A bar graph comparing the perceived interest levels for the Minister of Agriculture among different political groups. The horizontal axis lists the groups: SocDems, Libs, Mods, and DK. The vertical axis represents the percentage of interest ranging from 0 percent to 100 percent. The bars are grouped by high and low interest levels, with high interest in dark gray and low interest in light gray. SocDems show 13.2 percent high interest and 22.0 percent low interest. Libs have 54.9 percent high interest and 23.7 percent low interest. Mods exhibit 7.6 percent high interest and 1.7 percent low interest. DK shows 24.3 percent high interest and 52.5 percent low interest.
The results across the three figures are thus consistent with Hypothesis 9 and suggest that political parties with more politically sophisticated voters (or potential voters) have a stronger incentive to pay attention to the qualitative distribution of portfolios because sophisticated voters have more accurate knowledge about this distribution (Martin and Vanberg Reference Martin and Vanberg2020). Of course, this also requires that perceptions of party negotiation competence map onto party support, which is the question we turn to in our final set of analyses.
Party Competence and Party Support (Hypothesis 9)
To explore the relationship between perceived party competence and party support, we model support as a function of the perceived competence of the parties that got into office in the real world using the panel data described in the previous section. We measure party support in two ways. First, we compare responses to the question ‘where would you place the parties on a scale from 0 to 10, where 0 means that you really dislike and 10 means that you really like the party’ in the pre-election wave and the post-formation wave. Secondly, we zoom in on party supporters for each of the coalition members and ask them: ‘How do you feel about the way you voted, now that you know which government was formed after the election?’ with response categories on a Likert scale ranging from 1: ‘Definitely the wrong decision’ to 5: ‘Definitely the right decision’. Finally, the question for competence was asked in the same way as in the experimental design (and with the same 0–10 response scale): ‘How competently would you say that each of the following parties handled the coalition negotiations?’.
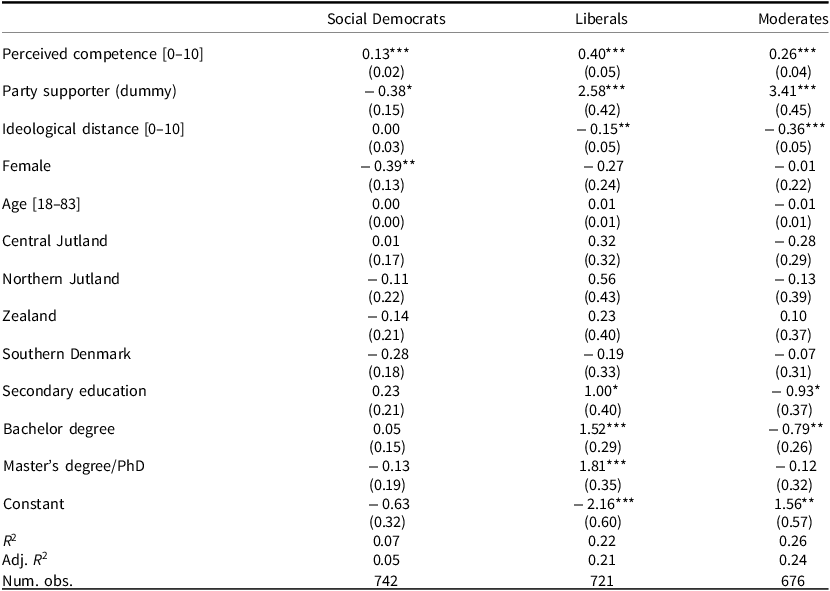
Table 5 reports the relationship between changes in party sympathy from immediately before the election to immediately after the coalition negotiations and perceptions of party competence in these negotiations. Consistent with Hypothesis 9, we find a strong positive and statistically significant relationship for each of the three government parties. Voters sympathize more with government parties they perceive handled the negotiations competently. The coefficients indicating party sympathy change for a one-unit increase in perceived competence (on the 0–10 scale) range between 0.13 (for the Social Democrats) and 0.40 (for the Liberals). This suggests that if two otherwise fairly similar voters feel quite differently about whether a government party handled the coalition negotiations in a competent way, then they will also feel quite differently about this party after the government formation.
Change in party sympathy after the coalition negotiations

Table 5. Long description
The table presents data on the relationship between changes in party sympathy and perceived competence in coalition negotiations for three political parties: Social Democrats, Liberals, and Moderates. It includes 10 rows and 10 columns. The columns are labeled as follows: Perceived competence [0–10], Party supporter (dummy), Ideological distance [0–10], Female, Age [18–83], Central Jutland, Northern Jutland, Zealand, Southern Denmark, Secondary education, Bachelor degree, Master’s degree/PhD, Constant, R2, Adj. R2, and Num. obs. The rows list the corresponding values for each category. For example, the Perceived competence [0–10] values are 0.13 for Social Democrats, 0.40 for Liberals, and 0.26 for Moderates. The Party supporter (dummy) values are -0.38 for Social Democrats, 2.58 for Liberals, and 3.41 for Moderates. The Ideological distance [0–10] values are 0.00 for Social Democrats, -0.15 for Liberals, and -0.36 for Moderates. The Female values are -0.39 for Social Democrats, -0.27 for Liberals, and -0.01 for Moderates. The Age [18–83] values are 0.00 for Social Democrats, 0.01 for Liberals, and -0.01 for Moderates. The Central Jutland values are 0.01 for Social Democrats, 0.32 for Liberals, and -0.28 for Moderates. The Northern Jutland values are -0.11 for Social Democrats, 0.56 for Liberals, and -0.13 for Moderates. The Zealand values are -0.14 for Social Democrats, 0.23 for Liberals, and 0.10 for Moderates. The Southern Denmark values are -0.28 for Social Democrats, -0.19 for Liberals, and -0.07 for Moderates. The Secondary education values are 0.23 for Social Democrats, 1.00 for Liberals, and -0.93 for Moderates. The Bachelor degree values are 0.05 for Social Democrats, 1.52 for Liberals, and -0.79 for Moderates. The Master’s degree/PhD values are -0.13 for Social Democrats, 1.81 for Liberals, and -0.12 for Moderates. The Constant values are -0.63 for Social Democrats, -2.16 for Liberals, and 1.56 for Moderates. The R2 values are 0.07 for Social Democrats, 0.22 for Liberals, and 0.26 for Moderates. The Adj. R2 values are 0.05 for Social Democrats, 0.21 for Liberals, and 0.24 for Moderates. The Num. obs. values are 742 for Social Democrats, 721 for Liberals, and 676 for Moderates.
***p < 0.001; **p < 0.01; *p < 0.05.
Adj. R 2 = Adjusted R 2, Num. obs = Number of observations, Num. ind. = Number of individuals.
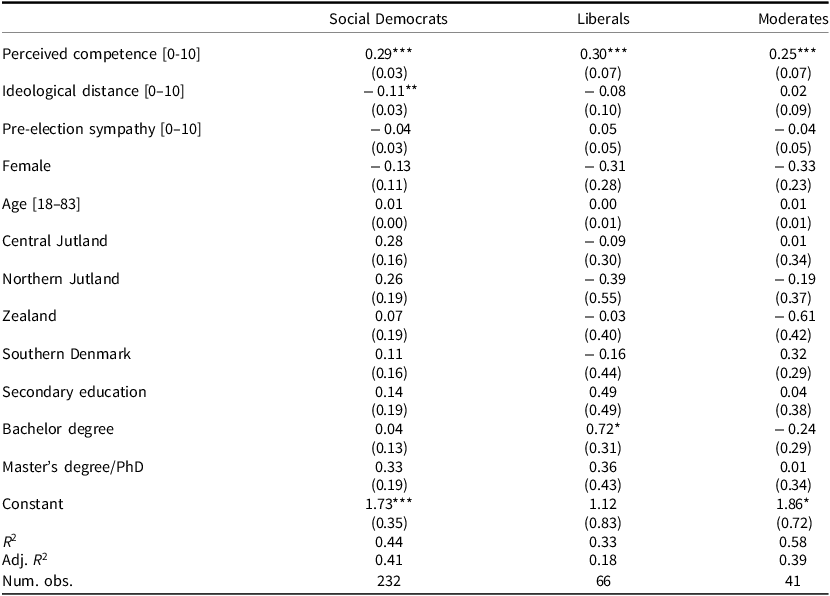
The results for vote choice satisfaction are reported in Table 6. These analyses are restricted to respondents who reported having voted for the three parties that formed the government. We find that a government party’s perceived competence in the portfolio negotiations has a positive and statistically significant relationship with vote choice satisfaction, even after accounting for party sympathy immediately prior to the election, ideological distance, and a number of socio-demographic variables. Voters who perceive a party handled the government negotiations more competently are more likely to be satisfied with their vote choice after the government is formed. Considering that perceived competence ranges between 0 and 10 and that the dependent variable ranges from 1 to 5, the coefficients – ranging from 0.25 to 0.30 between parties – are not only significant but also substantively meaningful. Voters appear to use their perceptions of negotiation competence to update their party preferences in non-trivial ways.
Satisfaction with vote choice among party supporters

Table 6. Long description
The table presents data on vote choice satisfaction among supporters of three government-forming parties. It includes columns for Social Democrats, Liberals, and Moderates, each with various socio-demographic variables and their impact on vote choice satisfaction. The table has 16 rows and 4 columns, including row labels and values. Key variables include perceived competence, ideological distance, pre-election sympathy, gender, age, region, education level, and a constant. Each row provides specific values and standard errors for these variables across the three parties. Notable trends include the positive and significant relationship between perceived competence and vote choice satisfaction, with coefficients ranging from 0.25 to 0.30. Other variables such as ideological distance, pre-election sympathy, and socio-demographic factors like gender, age, region, and education level are also analyzed for their impact on vote choice satisfaction.
***p < 0.001; **p < 0.01; *p < 0.05.
Adj. R 2 = Adjusted R 2, Num. obs = Number of observations, Num. ind. = Number of individuals.
Finally, we estimated the same models again using answers from the same respondents in 2024 (Appendix Tables A.18 and A.19). The results are generally robust over time. Voters who perceive a party was competent in the coalition negotiations are more likely to support this party over a year later. This suggests that the relationship between perceived competence in coalition negotiations and party support is not merely short term, but sticks over time.
Conclusion
How do voters evaluate party performance in the government formation process, and does it influence their party preferences? Despite the importance of this question, it has received little research attention so far. To address this gap, we have analyzed whether and how voters evaluate party performance in negotiations over ministry allocation. We hypothesized that voters would incorporate aspects of both the quantitative and qualitative portfolio distribution in their competence perceptions and found broad support for our expectations using a survey experiment in Denmark: competence ratings are higher when parties receive a higher portfolio share and (especially) when the portfolios they obtain are more powerful and salient to the party in question.
Our analyses also suggest that the connection between portfolio allocations and voters’ competence perceptions has important implications for accountability and party incentives during government formation. Using panel data, we showed that voters appear to update their party preferences based on their competence perceptions, and that this relationship is sticky at least a year into the future. To be sure, we do not know whether the connection between perceived competence and party support persists beyond the one-year time span we observe, and it may not. If a party is unable to deliver in the portfolio areas it receives, competence during portfolio negotiations could even produce negative long-term effects on the party’s support (Greene et al. Reference Greene, Henceroth and Jensen2021). Yet voter support at the beginning of a government’s term is also important, and failing to secure it can lead to instability later and ultimately government withdrawal (Martin and Vanberg Reference Martin and Vanberg2025).
Together these dynamics give parties an incentive to consider voter expectations when negotiating portfolios and provide a plausible mechanism underlying well-documented regularities in portfolio allocation outcomes. Coalition parties tend to seek, and usually obtain, the portfolios most salient to their brand (Bäck et al. Reference Bäck, Debus and Dumont2011; Greene and Jensen Reference Greene and Jensen2018), and our findings show that one reason for this pattern could be electoral: parties may pursue salient portfolios to avoid voter dissatisfaction and electoral backlash. In this sense, the resulting allocation system reflects an alignment between supply (portfolio distribution) and demand (voter preferences).Footnote 12 We also find that politically sophisticated voters have much more accurate knowledge of which parties obtain which ministries. This helps account for another empirical regularity, namely that parties with a more politically sophisticated voter base are especially likely to secure qualitatively desirable portfolios (Martin and Vanberg Reference Martin and Vanberg2025).Footnote 13
There are, however, also important limitations to our study. Most importantly, we focus on a single country – Denmark – and we cannot know how the results travel to other contexts. For example, Denmark has traditionally had many coalition minority governments, and we cannot know if voters who have more experience with other types of governments (for example, majority governments, surplus governments, and single-party governments) react differently to quantitative and qualitative portfolio allocation outcomes when they observe them. Likewise, we cannot know whether our results travel to other levels than the national one. For instance, while Gamson’s law has strong predictive power in European parliamentary democracies at the national level, its explanatory strength is weaker at the subnational level (see, for example, Ecker and Gross Reference Ecker and Gross2026; Olislagers and Steyvers Reference Olislagers and Steyvers2013; Perrin Reference Perrin2026; Raabe and Linhart Reference Raabe and Linhart2015; Serritzlew et al. Reference Serritzlew, Blom-Hansen and Skjæveland2010) and in (semi-)presidential systems or other world regions (Ariotti and Golder Reference Ariotti and Golder2018, Reference Batista2023; Batista Reference Batista2018; Bucur Reference Bucur2018, Reference Bucur2020; Evans Reference Evans2020; Jang Reference Jang2024). This could have implications for how voters link quantitative portfolio allocation to competence in these contexts.
Another limitation of the study is the experimental setting. In the survey experiment we leverage the uncertainty about which coalition would form to more credibly manipulate the portfolio distribution dimensions we are interested in. However, it is possible that voters behave differently when they observe an actual outcome than when presented with a possible one, and we cannot know how the results travel to cases where the portfolio distribution outcome is more certain. Moreover, we kept the composition of parties constant in the experimental design, meaning we cannot be certain that the results travel to governments where other types of parties are bargaining. That said, the parties we include resemble those that govern in many other countries – namely mainstream parties with relatively centrist policy profiles – and the ministries we focus on are comparable to those in several other countries in terms of the policy areas they cover. As such, we believe the Danish case can offer insights into voters and coalition politics beyond this specific context.
More generally, we hope this paper will inform a new research agenda that merges insights from research on voting behavior with research on government formation processes and outcomes. For example, it is possible that voters update their competence perceptions during the bargaining process itself, depending on how much information is leaked. If it appears early in the negotiations that a party is likely to obtain a desirable portfolio, voters may perceive the party as handling the negotiations competently. However, if the party ultimately fails to secure that portfolio, voters may become more dissatisfied than they would have been had no such information been leaked.
There are also other policy trade-offs involved in government formation negotiations than the ministries themselves. While the allocation of cabinet posts is clearly a highly visible outcome, the negotiations often result in a policy compromise expressed in a written coalition agreement. This is a visible outcome that parties pay a great deal of attention to, especially when they need to compensate for not obtaining their preferred portfolios (Krauss and Kluever Reference Krauss and Kluever2023). Consequently, it may be an important factor for voters’ perceptions of party competence as well. Voters may, for example, be more willing to forgive a party for giving up one or more important portfolios if the party negotiates a coalition compromise that is more consistent with the party’s policy positions. We do not have the data to test these possibilities here, but we encourage future research to do so.
Supplementary material
The supplementary material for this article can be found at https://doi.org/10.1017/S0007123426101744.
Data availability statement
Replication data for this paper can be found at https://doi.org/10.7910/DVN/IA69DM.
Acknowledgements
We are grateful for the support of Svenja Krauss in the initial stages of the project. In addition, we would like to thank Christoffer Green-Pedersen, Carsten Jensen, Sven-Oliver Proksch, Lucas Almeida Couto, and participants at the Vienna Department of Government seminar and at the ECPR conference 2023, as well as three anonymous reviewers for their helpful comments and suggestions. We thank Magnus Kirstein Cohen for excellent research assistance.
Financial support
This work was supported by the European Research Council (ERC consolidator grant no. 817855). The working time of Ida B. Hjermitslev was supported by the Carlsberg Foundation (grant no. CF23-0407).
Competing interests
None to disclose.
Ethical standards
The research was conducted in accordance with protocol 797 approved by the Institutional Review Board of the Faculty of Social Sciences, University of Vienna.






 Open access

