Implications
Results from this experiment show that ergot alkaloids present in endophyte-infected tall fescue do not have an impact on nutrient absorption or barrier function of the isolated rumen epithelium of cattle following acute exposure. This indicates that previously observed reductions in nutrient absorption in live animals exposed to ergot alkaloids requires chronic exposure or is driven by the reduced blood flow. Results also show that ergovaline, one of the main causative agents of fescue toxicosis, is absorbed across the rumen epithelium, although it is at a fairly slow rate ∼1% of a daily dose.
Introduction
Ergot alkaloids such as ergovaline are synthesized by the endophyte (Neotyphodium coenophialum) present in tall fescue (Lolium arundinaceum) and are thought to be the main causative agents of fescue toxicosis in beef cattle (Strickland et al., Reference Strickland, Looper, Matthews, Rosenkrans, Flythe and Brown2011). Rhodes et al. (Reference Rhodes, Paterson, Kerley, Garner and Laughlin1991) used radio-labeled microspheres to measure blood flow and reported that consumption of endophyte-infected tall fescue reduced blood flow to the gut of cattle. Supporting the findings of Rhodes et al. (Reference Rhodes, Paterson, Kerley, Garner and Laughlin1991), endophyte-infected tall fescue seed extract (EXT) has been reported to cause constriction of the ruminal artery and veins (Foote et al., Reference Foote, Harmon, Brown, Strickland, McLeod, Bush and Klotz2012) and a follow-up experiment reported a large reduction in epithelial blood flow to the washed reticulorumen of steers (Foote et al., Reference Foote, Kristensen, Klotz, Kim, Koontz, McLeod, Bush, Schrick and Harmon2013). However, variability in the response to endophyte-infected tall fescue is evident as Harmon et al. (Reference Harmon, Gross, Kreikemeier, Coffey, Avery and Klindt1991) showed only a minor effect of fescue toxicosis on nutrient flux across or blood flow to splanchnic tissues.
Along with the reduced epithelial blood flow, a marked reduction in volatile fatty acids (VFA) flux across the washed rumen was observed (Foote et al., Reference Foote, Kristensen, Klotz, Kim, Koontz, McLeod, Bush, Schrick and Harmon2013), which could be independent of blood flow and a direct effect of the ergot alkaloids on the rumen epithelium. The objectives of this experiment were to (1) determine the effect of acute exposure to ergot alkaloids on total, facilitated and passive VFA flux across the isolated bovine rumen epithelium, (2) determine the effect of acute ergot alkaloid exposure on isolated rumen epithelial barrier function and (3) determine the flux of ergovaline, a principal alkaloid present in the tall fescue seed extract, across the rumen epithelium.
Material and methods
Methods used with live animals were reviewed and approved by the University of Saskatchewan Animal Research Ethics Board before beginning the study (protocol no. 20100021).
Preparation and analysis of tall fescue seed extract
At the University of Kentucky, an extract of ‘3rd Millennium’ tall fescue seed was isolated as previously described (Foote et al., Reference Foote, Kristensen, Klotz, Kim, Koontz, McLeod, Bush, Schrick and Harmon2013). The tall fescue seed extract was analyzed using a Waters Acquity UPLC-TQD (Waters Inc., Milford, MA, USA) with a sample manager. The sample manager was maintained at 4°C. An Acquity UPLC BEH (C18, 2.1×150 mm, 1.7 μm; Waters Inc.) column was used to perform chromatographic separation. Chromatographic separation was conducted at 75°C and the mobile phase was delivered at a constant flow of 0.5 ml/min using a 2 μl full loop injection. The binary mobile phase consisted of 5 mM ammonium carbonate (pH=10.12, adjusted with ammonium hydroxide; mobile phase A) and acetonitrile (mobile phase B). The tall fescue seed extract was injected (2 µl) into the initial gradient conditions of 100% mobile phase A and 0% mobile phase B, which were maintained for 2 min following injection. Mobile phase B was increased at a linear rate to 95% over the next 6.4 min to chromatographically resolve all of the ergot alkaloids. After the 6.4 min separation run, mobile phase B was held constant for an additional 3.1 min to flush the liquid chromatography column. Mobile phase A increased at a linear rate to 100% over the next 0.05 min and held constant for an additional 1.45 min to allow for column re-equilibration in preparation for the next analysis. The total run time from one injection to the subsequent injection was 13 min, while data acquisition occurred from 2 to 8.4 min post injection. A tandem-quadrupole MS (Quattro Premier equipped with a Z-spray ion source; Waters Inc.) was coupled to the UPLC system. The mass spectrometer atmospheric pressure ionization was operated in positive electrospray ionization. The capillary voltage was 0.50 kV, and the source and desolvation temperatures were set at 150°C and 400°C, respectively. The cone and desolvation gas flows were set at 125 and 800 l/h, respectively. Collision gas (argon) flow and pressure were set at 0.15 ml/min and 3.50×10⁻³ mbar, respectively. The MS tune was run in multiple reaction-monitoring mode with an automated dwell time. Six different scan functions were acquired simultaneously, corresponding to each of the molecular ions for the analytes. Chromatograms from selected reaction monitoring were used for quantification of the ergot alkaloids. The limits of detection and quantification of ergovaline were 0.61 and 1.06 ng/ml, respectively.
The extract contained the following ergot alkaloids (mg/ml): ergovaline (3.934), lysergic acid (0.084), ergocornine (0.056), ergotamine (0.040), ergocryptine (0.011) and ergocristine (0.008). The extract was diluted with 80% methanol into two concentrations (10 and 50 µg ergovaline/ml) and aliquots were stored in silanized amber vials at −20°C. The diluted extract was then shipped on dry ice to the University of Saskatchewan and stored at −20°C until it was used.
Animals and tissue collection
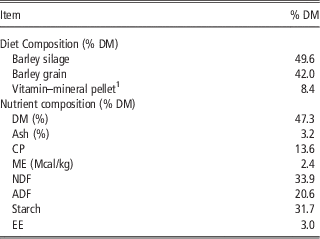
Six Holstein steers (BW=107.9±7.3 kg) housed at the livestock research building, University of Saskatchewan, were fed a mixed ration (Table 1) ad libitum for 23 to 30 days before slaughter. One steer per day was killed to collect tissue for Ussing chamber experiments. Steers were killed by captive bolt stunning, followed by pithing, and exsanguination. The abdominal cavity was opened and a 100 cm2 section of the caudal dorsal sac of the rumen was removed. The submucosal tissues were carefully removed and the epithelium was placed in an oxygenated buffer (pH 7.4 at 38°C; Supplementary Table S1) for transport to the laboratory (~20 min from the time of death).
Composition and nutrient content of diet fed to steers before in vitro experiments

DM=dry matter; ME=metabolizable energy; EE=ether extract.
1 Contains (% of DM) soybean meal (57.15), ground barley grain (23.73), dynamate (10.73; Mosaic Feed Ingredients, South Riverview, FL, USA), ground limestone (5.51), trace mineral salt (2.47), Na-selenite (0.18), Vitamin ADE premix (0.08), potassium chloride (0.07), MgO (0.04), MnO2 (0.04).
The epithelium was sectioned and mounted between two halves of an Ussing chamber with an exposed surface area of 3.14 cm2 (12 chambers used for acetate and butyrate flux experiments, 6 chambers used for ergovaline flux experiments; Muschler, University of Leipzig, Germany) or 1.43 cm2 (used in inulin flux measurements, 6 chambers; Physiologic Instruments, San Diego, CA, USA). A silicon rubber ring was placed on both sides of the epithelium section to protect the edge of the tissue from damage. For each experiment, each treatment was incubated in two chambers. For acetate and butyrate flux experiments, the tissues mounted in the chambers were bathed on each side with 15 ml of buffer (Supplementary Table S1) that was mixed with a gas-lift system using 95% O2/5% CO2, except for the bicarbonate-free buffer that was gassed with 100% O2. For inulin flux experiments, the tissues were bathed on each side with 10 ml of buffer that was mixed by a gas-lift system using 95% O2/5% CO2. For ergovaline flux experiments, the tissues mounted in the chambers were bathed on each side with 11 ml of buffer that was mixed by a gas-lift system using 95% O2/5% CO2. All buffers were maintained at 38.5°C. The chemical composition of the buffers (Supplementary Table S1) were designed to determine total VFA flux (total) without inhibition (i.e. the buffer contained HCO3 − and did not contain Cl− or NO3 −) and bicarbonate-independent nitrate insensitive VFA flux (passive) by inducing maximal inhibition (i.e. addition of Cl− and NO3 − and absence of HCO3 −) (Sehested et al., Reference Sehested, Diernaes, Moller and Skadhauge1996a, Aschenbach et al., Reference Aschenbach, Bilk, Tadesse, Stumpff and Gabel2009, Penner et al., Reference Penner, Aschenbach, Gabel, Rackwitz and Oba2009). Facilitated VFA flux was calculated as the difference between total and passive flux. In all cases, the pH of the mucosal (6.2) and serosal (7.4) buffers were set to mimic the pH of rumen contents and blood, respectively.
Electrophysiology
Tissues were incubated under short-circuit conditions by passing current through the tissue to clamp the potential difference to 0 mV. Potential difference and short-circuit current were measured using a computer-controlled voltage clamp device (VCC MC6 Multichannel Voltage/Current Clamp; Physiologic Instruments, was used for inulin flux) connected to electrodes (Physiologic Instruments) via agar bridges (3% agar in 3 M KCl). The current required to clamp the transepithelial potential difference to 0 mV is equivalent to the short-circuit current (I sc ) but in the opposite direction. Pulses of current were applied every 10 s for the measurement of transepithelial conductance (G t ). For tissues used to measure VFA and ergovaline flux, the procedure for short-circuit conditions were the same except a different voltage clamp device (Ing. – Büro für Mess – und Datentechnik, Aachen, Germany) was used and different electrodes voltage-sensing (Argenthal electrodes for voltage measurements; Mettler Toledo, Urdorf, Switzerland), and current passing electrodes (Pt−PtCl electrodes; Free University of Berlin, Berlin, Germany) connected via NaCl bridges for passing current).
Acetate and butyrate flux experiments
Tissue conductance (G t ) and short-circuit current (I sc ) were allowed to stabilize for 30 min after mounting. After at least 10 min of stabilization, tissues were blocked based on G t . Within block, chambers were randomly assigned to a treatment so that each treatment was present in each block and each treatment was duplicated within buffer type. Treatments included control (Con, 75 µl of 80% methanol), Low EXT (75 µl of a 10 µg ergovaline/ml to yield a final concentration of 50 ng ergovaline/ml) and High EXT (75 µl of a 50 µg ergovaline/ml to yield a final concentration of 250 ng/ml). The volume of the treatment addition was designed to keep the volume of organic solvent at 0.5% of the total volume. The High EXT treatment concentration was equal to that used by Foote et al. (Reference Foote, Kristensen, Klotz, Kim, Koontz, McLeod, Bush, Schrick and Harmon2013) and showed reduced epithelial blood flow and VFA absorption from the washed reticulorumen of steers. The Low EXT treatment was meant to provide a more physiological concentration of ergovaline, typical of growing beef cattle. Treatments were added to the mucosal buffer after the 30 min stabilization period and the chambers were allowed to equilibrate for 15 min before the addition of radioisotopes. A stock solution with 720 mM acetate and 720 mM butyrate was spiked with 3H-acetate (37 kBq/µl; NET003005; Perkin Elmer, Waltham, MA, USA) and 14C-butyrate (3.7 kBq/ml; #MC-319; Moravek Biochemicals and Radiochemicals, Brea, CA, USA) and 523 µl was added to the mucosal buffer to achieve a final concentration of 25 mM acetate and 25 mM butyrate with 100 kBq 3H and 74 kBq of 14C. The radioisotopes were allowed to equilibrate for 45 min (Sehested et al., Reference Sehested, Diernaes, Laverty, Møller and Skadhauge1996b). Mucosal buffer samples (100 µl) were collected at the end of the equilibration period and at the end of the experiment. Serosal buffer samples (500 µl) were taken at the end of the equilibration period and every 30 min for 2 h resulting in four flux periods. Samples were placed in scintillation vials with 5 ml of scintillation cocktail (Perkin Elmer) and read on a Multi-Purpose Scintillation Counter (model LS6500; Beckman Coulter, Mississauga, ON, Canada). Flux was calculated as described previously (Clarke, Reference Clarke2009; Wilson et al., Reference Wilson, Mutsvangwa and Penner2012) and is as follows:
 $${\rm Flux}=V{\times}{{{\rm }S2\,{\minus}\,S1{\times}{\rm dilution}} \over {{\rm specific\ activity}{\times}{\rm surface\ area}{\times}{\rm time}}}$$
where V is the volume of the buffer (ml), S is dpm/ml of buffer samples taken at the beginning (S1) and end (S2) of the flux period, dilution is the dilution factor after replacing the sample volume, specific activity is the activity of the isotope (dpm/µmole) on the mucosal side, surface area is the exposed area of the rumen epithelium (cm2) and time is the length of duration of the flux period (h).
Inulin and ergovaline flux experiments
Tissues were equilibrated, blocked and assigned to treatments as described above. For the inulin flux experiment, treatments included control (50 µl of 80% methanol), Low EXT (50 µl of a 10 µg ergovaline/ml to yield a final concentration of 50 ng ergovaline/ml) and High EXT (50 µl of a 50 µg ergovaline/ml to yield a final concentration of 250 ng/ml). For the ergovaline flux experiments, treatments included Con (55 µl of 80% methanol), Low EXT (55 µl of a 10 µg ergovaline/ml to yield a final concentration of 50 ng ergovaline/ml) and High EXT (55 µl of a 50 µg ergovaline/ml to yield a final concentration of 250 ng/ml). Treatments were added to the mucosal buffer after the 30 min equilibration period and the chambers were allowed to equilibrate for 15 min before the addition of 3H-inulin (74 kBq; Perkin Elmer) to the mucosal buffer and allowed to equilibrate for 45 min. No radioactivity was added to chambers designated for the ergovaline flux experiments. For the inulin flux experiments, mucosal buffer samples (100 µl) were collected at the end of the equilibration period and at the end of the experiment. Serosal buffer samples (500 µl) were taken at the end of the equilibration period and every 1 h for 3 h resulting in three flux periods. Samples were placed in scintillation vials with 5 ml of scintillation cocktail and read on a Multi-Purpose Scintillation Counter (model LS6500). Inulin flux was calculated as described above. Samples were collected from the mucosal and serosal (500 µl from each) buffers for the ergovaline flux chambers at the same time and placed in silanized amber vials and stored at −20°C. Buffer samples designated for ergovaline analysis were shipped on dry ice to the University of Kentucky for analysis at the USDA-ARS, Forage-Animal Production Research Unit laboratory.
Buffer samples for ergovaline analysis were transferred to a 4 ml clear disposable borosilicate glass tube (12×75 mm; Fisher Scientific, Pittsburgh, PA, USA) and evaporated for 90 min at 60°C using a CentriVap Console (LABCONCO, Kansas City, MO, USA). The residue was reconstituted in 500 μl of 80 : 20 MeOH : H2O containing the analytical internal standard methysergide (200 fmol or 70.7 pg on column) and vortexed for 30 s. Each tube was centrifuged at 2000×g with a CR422 swinging bucket rotor (Jouan Inc., Winchester, VA, USA) for 10 min at 4°C. The supernatant (350 μl) was transferred to deactivated amber screw-top autosampler vial (Waters Inc.). A subsample of the supernatant was used for a dilution; 100 μl of the supernatant was combined with 900 μl of the 80 : 20 MeOH : H2O containing the analytical internal standard methysergide for a 1 : 10 dilution. Ergovaline was analyzed as described above for the tall fescue seed extract. Ergovaline flux was calculated using the method described above with the substitution of concentration of ergovaline on the mucosal side for specific activity on the mucosal side.
Statistical analysis
Data were analyzed as a completely randomized design using mixed procedure (SAS 9.3; SAS Institute Inc., Cary, NC, USA). The experimental unit was the tissue in the individual chambers. The model included the fixed effects of treatment, flux period and treatment×flux period. Flux period was included as a repeated measure using an autoregressive covariance structure. When the F-test was significant (P<0.05), pair-wise comparisons were conducted using LSD. Data are presented as least square means±s.e.m.
Results and discussion
The initial G t and I sc values of the rumen preparations were consistent with previous studies (Sehested et al., Reference Sehested, Diernaes, Moller and Skadhauge1996a, Aschenbach et al., Reference Aschenbach, Wehning, Kurze, Schaberg, Nieper, Burckhardt and Gäbel2000, Penner et al., Reference Penner, Oba, Gäbel and Aschenbach2010) and are representative of viable preparations. The EXT used in these experiments has previously been evaluated in vitro to determine if other compounds are present that could contribute to the observed effects of the EXT (Foote et al., Reference Foote, Harmon, Brown, Strickland, McLeod, Bush and Klotz2012). It was determined that the vasoactivity of pure ergovaline was no different than the EXT or a mixture of ergovaline plus six commercially available ergot alkaloids that mimicked the concentrations of the ergot alkaloids in the EXT. An extract of endophyte-free tall fescue seed was also evaluated to determine if the extraction process contributes additional vasoactive compounds, and it was determined to have no vasoactive potential in core or peripheral vasculature (Foote et al., Reference Foote, Harmon, Brown, Strickland, McLeod, Bush and Klotz2012). In addition, the EXT used in these experiments presented here has been shown to reduce reticuloruminal epithelial blood flow and VFA absorption in the washed reticulorumen (Foote et al., Reference Foote, Kristensen, Klotz, Kim, Koontz, McLeod, Bush, Schrick and Harmon2013). Collectively, these data indicate that the EXT is representative of ergot alkaloid activity on locally induced effects and has been shown to reliably induce fescue toxicosis.
Volatile fatty acid flux
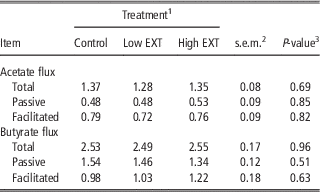
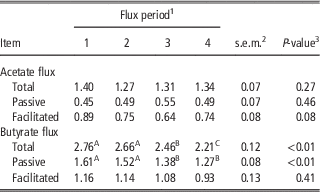
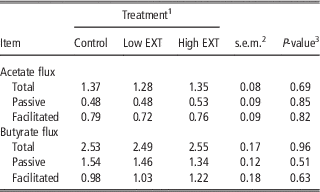
There were no EXT treatment×flux period interactions for total, passive or facilitated acetate flux (P=0.25, 0.79 and 0.33, respectively) or total, passive and facilitated butyrate flux (P=0.82, 0.99 and 0.87, respectively). Therefore, only data for main effects of treatment and flux period are presented (Tables 2 and 3).
Effect of acute exposure to ergot alkaloids on total, passive and facilitated acetate and butyrate flux (µmol/cm2 per hour) across the isolated bovine rumen epithelium
1 Control=80% methanol (0.5% of the buffer volume), Low EXT=50 ng ergovaline/ml, High EXT=250 ng ergovaline/ml.
2 s.e.m., n=48.
3 Probablity of a greater F-statistic for the main effect of treatment.
Effect of time on total, passive and facilitated acetate and butyrate flux (µmol/cm2 per hour) across the isolated bovine rumen epithelium
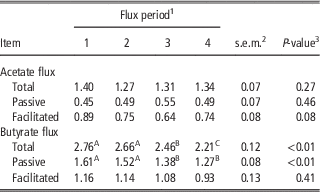
A,B,CMeans within row without a common superscript differ (P<0.05).
1 Flux period is the 30 min blocks of time in which flux of acetate and butyrate were measured.
2 s.e.m., n=36.
3 Probablity of a greater F-statistic for the main effect of flux period.
Total, passive and facilitated acetate flux across the isolated bovine rumen epithelium was not affected by acute exposure to a tall fescue seed extract (P=0.69, 0.85 and 0.82, respectively; Table 2). Butyrate flux across the isolated rumen epithelium was not affected by acute exposure to ergot alkaloids (P=0.96, 0.51 and 0.63, for total, passive and facilitated, respectively; Table 2).
Flux period had no effect on total or passive acetate flux (P=0.27 and 0.46, respectively; Table 3). There was a tendency (P=0.08) for higher facilitated acetate flux during the first flux period. Total and passive butyrate flux decreased after the second period (P<0.01) and total flux decreased further during the fourth period. The lack of an EXT treatment×flux period interaction indicates the ergot alkaloids were effective over an extended amount of time. In addition, the lack of a flux period effect and stable flux rates over the experimental timeline provide evidence of a viable system to evaluate the acute effect of ergot alkaloids.
Consumption of ergot alkaloids from wild-type endophyte-infected tall fescue has previously been shown to decrease portal flux of acetate in steers (Harmon et al., Reference Harmon, Gross, Kreikemeier, Coffey, Avery and Klindt1991) even though portal blood flow was not affected. In addition, acute exposure to ergot alkaloids by incubating an extract of endophyte-infected tall fescue seed in a washed reticulorumen caused a reduction in total VFA, acetate, butyrate and isovalerate flux as well as a decrease in blood flow to the epithelium (Foote et al., Reference Foote, Kristensen, Klotz, Kim, Koontz, McLeod, Bush, Schrick and Harmon2013). It was thought that several factors could be contributing to the alteration in VFA flux in response to ergot alkaloids independent of blood flow including (1) a change in specific absorption pathways (facilitated or passive VFA flux) or (2) a change in epithelial metabolism. Results presented in this current experiment clearly show that acute exposure of rumen epithelium to ergot alkaloids has no effect on the absorptive pathways, either facilitated or passive, of bovine rumen epithelium. It is likely that the results previously observed for VFA absorption are due to alterations in blood flow and or epithelial metabolism of VFA.
Barrier function and electrophysiology
Rumen epithelium barrier function was assessed by the mucosal to serosal flux of inulin and G t . The barrier function of rumen epithelium is thought to be attributed to the tight junctions in the stratum granulosum (Graham and Simmons, Reference Graham and Simmons2005). Tissue conductance and the movement of hydrophilic macromolecules that are not transported transcellularly can be used as measures of barrier function. There was no treatment×flux period interaction for inulin flux (P=0.84, data not shown); therefore only the data for main effects are presented (Table 4). The mucosal to serosal flux of inulin was not affected by the addition of alkaloids (P=0.16) or flux period (P=0.74). Flux of inulin in this experiment was much lower than mannitol flux across isolated sheep rumen (Penner et al., Reference Penner, Oba, Gäbel and Aschenbach2010) but similar to Cr−EDTA flux across isolated sheep rumen (Schweigel et al., Reference Schweigel, Freyer, Leclercq, Etschmann, Lodemann, Böttcher and Martens2005), likely due to similar molecular weights of inulin and Cr–EDTA (~375 and 340 Da, respectively) that is higher than mannitol (~180 Da).
Effect of acute exposure to ergot alkaloids and time of incubation on inulin flux (nmol/cm2 per hour), tissue conductance (G t , mS/cm2), short-circuit current (I sc , µEq/cm2 per hour) of isolated bovine rumen epithelium

A,B,CMeans within row without a common superscript differ (P<0.05).
1 Control=80% methanol (0.5% of the buffer volume), Low EXT=50 ng ergovaline/ml, High EXT=250 ng ergovaline/ml.
2 s.e.m., n=36.
3 Probablity of a greater F-statistic for the main effect of treatment.
4 Flux period is the 1 h blocks of time in which flux of inulin was measured.
5 Probablity of a greater F-statistic for the main effect of flux period.
Tissue conductance was analyzed separately for each experiment. There were no treatment×flux period interactions for G t in the inulin flux experiment (P=0.31) or ergovaline flux experiment (P=0.61); therefore only data for the main effects are presented (Tables 4 and 5). The average G t ranged from 1.63 to 3.36 mS/cm2 and there was no effect of ergovaline treatment on G t (P>0.17; Tables 4 and 5). In all experiments there was an increase in G t over time (P<0.01; Tables 4 and 5). As there were no treatment×flux period interactions, this was not an effect of the treatments, but simply a natural occurrence in the in vitro system.
Effect of acute exposure to ergot alkaloids on the tissue conductance (G t , mS/cm2) and short-circuit current (I sc , µEq/cm2 per hour) of isolated bovine rumen epithelium during the ergovaline flux experiments

A,B,CMeans within row without a common superscript differ (P<0.05).
1 Control=80% methanol (0.5% of the buffer volume), Low EXT=50 ng ergovaline/ml, High EXT=250 ng ergovaline/ml.
2 s.e.m., n=33.
3 Probablity of a greater F-statistic for the main effect of treatment.
4 Flux period is the 1 h blocks of time in which electrophysiology was measured.
5 s.e.m., n=35.
6 Probablity of a greater F-statistic for the main effect of flux period.
Ergocristine has been shown to reduce barrier function of an in vitro blood−brain barrier model with an apical concentration of at least 5 µM (compared with the 0.09 and 0.47 µM concentrations used in the current study), as measured by electrical resistance and sucrose permeability (Mulac et al., Reference Mulac, Hüwel, Galla and Humpf2012). The structure of ergocristine is similar to ergovaline with the same basic tricyclic peptide group that only differs at two points (Klotz et al., Reference Klotz, Kirch, Aiken, Bush and Strickland2010, Foote et al., Reference Foote, Harmon, Strickland, Bush and Klotz2011) and has similar inhibition constants for dopamine receptors (Larson et al., Reference Larson, Samford, Camden, Piper, Kerley, Paterson and Turner1995). Based on in vitro studies (Klotz et al., Reference Klotz, Kirch, Aiken, Bush and Strickland2010, Foote et al., Reference Foote, Harmon, Strickland, Bush and Klotz2011), it seems that ergocristine and ergovaline differ in their ability to elicit a vasoconstrictive response that is likely indicative of differences in membrane receptor binding; therefore, effects induced by ergocristine might not be representative of the potential of ergovaline to induce responses.
There were no treatment×flux period interactions for I sc in the inulin flux experiment (P>0.99; Table 4) or ergovaline flux experiment (P=0.67; Table 5); therefore only data for the main effects are presented. There was no effect of in vitro treatment on I sc (Tables 4 and 5; P>0.09). Short-circuit current increased after the first flux period in the ergovaline flux experiment (P<0.01). While I sc plateaued after the first flux period in the total VFA flux experiment, it continued to increase in the ergovaline flux experiment. Short-circuit current decreased after the first flux period in the inulin flux experiment (P=0.01).
Ergovaline flux
Ergovaline was not detected in the serosal buffer of the Low EXT treatment at any time point. Ergovaline was detected, but not quantifiable, in the serosal buffer of the High EXT treatment at the end of the second flux period (1 out of 12 chambers), the end of the third flux period (7 out of 12 chambers) and the end of the fourth flux period (3 out of 12 chambers). Ergovaline was never detected in the serosal buffer of the High EXT treatment for one chamber. Using the values for the lower limit of detection (0.61 ng/ml) and the lower limit of quantification (1.06 ng/ml) of ergovaline, a minimum and maximum mucosal to serosal flux rate for ergovaline was estimated. Minimum ergovaline flux is estimated as 0.25±0.10 ng/cm2 per hour and the maximum ergovaline flux rate is estimated to be 0.44±0.17 ng/cm2 per hour. This is equivalent to 0.47 and 0.83 pmol/cm2 per hour. Using the liquid volume (35 l) from the rumen contents of steers receiving endophyte-infected tall fescue seed (Foote et al., Reference Foote, Kristensen, Klotz, Kim, Koontz, McLeod, Bush, Schrick and Harmon2013), an approximation of the surface area exposed to rumen fluid containing ergovaline (calculated as half the surface area of a sphere with a volume of 35 l) is 2600 cm2. This would translate to a potential ruminal absorptive capacity of 15 to 27 µg of ergovaline a day (29 to 52 nmol of ergovaline). This represents <1% of the ergovaline consumed (~4.4 mg) by steers in a previous study (Foote et al., Reference Foote, Kristensen, Klotz, Kim, Koontz, McLeod, Bush, Schrick and Harmon2013). It is also possible that ergovaline is metabolized by the epithelium and a metabolite not analyzed is released into the serosal media. If the metabolite is also toxic to the animal, this absorption process could contribute significantly to the toxicosis syndrome.
This is the first known report to show that ergovaline crosses the bovine rumen epithelium. Ayers et al. (Reference Ayers, Hill, Rottinghaus, Stuedemann, Thompson, Purinton, Seman, Dawe, Parks and Ensley2009) showed that ergovaline did not cross bovine rumen epithelium isolated in a parabiotic chamber; however, the concentration used in their experiment may have resulted in serosal concentrations below the limit of detection. The estimation of flux rates presented here are significantly lower than those reported for ergotamine transport across ovine rumen and omasum tissue (Hill et al., Reference Hill, Thompson, Stuedemann, Rottinghaus, Ju, Dawe and Hiatt2001) as well as ergovaline movement across Caco-2 cells (Shappell and Smith, Reference Shappell and Smith2005). The differences could be due to the much higher concentrations used in the previous studies (30.5 mM ergotamine and 22 µM ergovaline) compared with the more physiological concentrations (0.47 µM ergovaline) in the current study.
The relatively slow rate of ergovaline flux may not directly correlate to an in vivo situation. It is possible that with blood flow removing the serosal molecules an increased concentration gradient could provide a greater absorption rate. In addition, ergovaline could adsorb to the epithelium over time and create a greater concentration gradient near the tissue that could lead to a greater absorption rate.
Data presented here indicate that acute exposure to ergovaline from wild-type endophyte-infected tall fescue has no effect on the absorptive function or the barrier function of the isolated bovine rumen epithelium. Previous reports displaying reduced VFA absorption from the washed rumen in response to acute ergot alkaloid exposure is likely due to reduced blood flow to the absorptive surface of the rumen. Results also indicate that ergovaline can potentially be absorbed across the rumen epithelium, although at a very slow rate.
Acknowledgements
Support for this research was provided in part by federal funds from the US Department of Agriculture, Agricultural Research Service and by the Kentucky Agricultural Experiment Station and is Publication No. 13-07-104. The authors would like to acknowledge Huihua Ji and Dr Neil Fannin for their assistance with the tall fescue seed extract; Tyler Schweiger for animal care; and Brittney Schurmann and Gillian Gratton for their assistance with the Ussing chambers.