I. INTRODUCTION
Nowadays, the photocatalytic purification and treatment of slops using nanostructured semiconductor under sunlight is an efficient technology for producing environmentally clean energy, in which one can use the sunlight as an energy source and it offers the possibility of accomplishing energy cycles without polluting the environment and additional heating of the earth. Reference Yan, Kochuveedu, Quan, Lee and Kim1,Reference Wey, Jason and Rose2 Nevertheless, most of the widely used photocatalysts have two main limitations in practical application: (1) the low solar energy conversion efficiency due to their wide band gap and (2) the high recombination ratio of photoinduced electron–hole pairs. Therefore, development of efficient visible light driven photocatalysts is still an intensifying endeavor worldwide. Reference Kumar, Surendar, Baruah and Shanker3,Reference Sun, Zhao, Jia, Zhou, Cheng, Li, Liu and Fan4
A metal-free semiconductor, graphitic carbon nitride (g-C3N4), has been proved a kind of efficient photocatalyst due to its characteristics of high thermal, chemical stability, versatile optical, electronic, tribological, and catalytic properties. Reference He, Cai, Li, Wu, Yi, Luo and Zhao5,Reference Huang, Xu, Li, Li, Cheng, Xia, Xua and Cai6 However, g-C3N4 photocatalyst suffers from the disadvantages of low surface area, low quantum efficiency, and high recombination rate of the photoinduced electron–hole pair, which reduce its photocatalytic activities. Therefore, many attempts have been made to improve the photocatalytic performance of g-C3N4. For example, S-doped g-C3N4 displays much higher activity than g-C3N4 for water splitting. Reference Liu, Niu, Sun, Smith, Chen, Lu and Cheng7 The g-C3N4/TaON shows stronger photocatalytic activity than either single phase of g-C3N4 or TaON in rhodamine B photodegradation. Reference Yan, Lv, Li and Zou8 Recently, the novel Bi2WO6/g-C3N4, Reference Ge, Han and Liu9 graphene/g-C3N4, Reference Liao, Chen, Quan, Yu and Zhao10 N-In2TiO5/g-C3N4, Reference Liu, Chen, Zhou, Hu, Fu, Liu and Wang11 and GdVO4/g-C3N4 (Ref. Reference He, Cai, Li, Wu, Lin, Zhao and Luo12) composite photocatalysts have been prepared and used for photodegradation of organic dyes.
ZrO2-based composite materials are of considerable interest for many applications such as solid electrolytes, Reference Chu, Yashiro, Segawa, Inoue and Wada13 catalyst supports, Reference Lei, Xu, Tang, Hua and Gao14 and organic catalysts. Reference Zhou, Liu, Tan, Pei, Qiao, Fan and Zong15,Reference Nunez, Angel, Tzompantzi and Navarrete16 Recently, ZrO2 composite materials as effective photocatalysts have been aroused more and more research enthusiasm due to their unique physical and chemical properties. For example, Yuan et al. Reference Yuan, Liu, Li, Li, Fang, Duan, Li and Yan17 reported mesoporous TiO2–ZrO2 nanocomposites with photocatalytic activity in degradation of rhodamine-B. Cha et al. Reference Cha, An, Jang, Kim, Song and Kim18 prepared N-doped ZrO2/TiO2 photocatalysts with enhanced photocatalytic degradation of NO. As far as we know, the coupling of nano-ZrO2 with g-C3N4 as a kind of photocatalyst to remove organic pollutant has been seldom observed.
In the present work, considering the synergic effect between ZrO2 and graphitic carbon nitride, the ZrO2/g-C3N4 heterostructured photocatalysts were prepared for the first time by calcination and hydrothermal treatment. The as-prepared ZrO2/g-C3N4 photocatalyst has been characterized by x-ray diffraction (XRD), Fourier transform spectroscopy (FTIR), scanning electron microscopy (SEM), x-ray photoelectron spectroscopy (XPS), UV–vis diffuse reflectance spectra (DRS), Brunauer–Emmett–Teller (BET), photoluminescence spectra (PL), and electrochemical impedance spectra (EIS). The photocatalytic activity of the as-prepared photocatalyst was evaluated by degradation of methylene blue (MB) under visible light irradiation. In addition, the photocatalytic mechanism in the degradation process was also further studied based on the main active species.
II. EXPERIMENTAL
A. Preparation of ZrO2/g-C3N4
Melamine and zirconium oxychloride were purchased from Aladdin Reagent Co. Ltd, China. All reagents were used as received and without further purification. The ZrO2/g-C3N4 photocatalyst was prepared by calcination (process) and hydrothermal treatment. In a typical synthesis, 5 g of melamine and 0.25 g of zirconium oxychloride were added into 90 mL of ethanol. The mixture had been heated and stirred for about 1 h to remove ethanol. The powder was then put into a crucible with a cover, heated in a semiclosed system at 530 °C in a muffle furnace for 4 h with a heating rate of 2 °C/min, further heated at 530 °C for another 4 h. After being naturally cooled to room temperature, the sallow powders were obtained and then gently washed with deionized water several times to wash off the Cl−, followed by desiccation at 60 °C in air.
For comparison, the pure g-C3N4 and ZrO2 photocatalysts were prepared according to the literature. Reference Zhao, Chen, Yu and Quan19,Reference Song, Liu and He20
B. Characterization of ZrO2/g-C3N4
The XRD characterization of the as-prepared photocatalyst was carried out on Rigaku D/MAX-2000 XRD (Rigaku Corporation, Japan), using Cu Kα radiation (40 kV/30 mA) with λ = 0.15 nm. Diffraction patterns were recorded in the angular range of 10–80° with a step width of 0.02°/s. The FTIR on the pellets of the samples mixed with KBr were recorded on a Perkin Elmer Spectrum 2000 FTIR spectrophotometer at a resolution of 4 cm−1. The scanning electron microscope (SEM) images were taken with a NOVA/4000-E instrument equipped with an energy dispersive spectra (EDS) analysis system. The surface chemical composition and bonding state of the photocatalyst were probed by XPS analysis on a Perkin-Elmer-PHI/5000-ESCT-System spectrometer using an emission source Al K-1486.6 eV X-ray source. All the spectra were calibrated with the adventitious carbon at 284.6 eV. The UV-Vis diffuse reflectance spectra (DRS) measurements were carried out using a UV-2450 (SHIMA-DZU, Japan) over a range of 200–700 nm, and BaSO4 was used as a reflectance standard. The Brunauer-Emmett-Teller (BET) surface area was determined by a multipoint BET method using the adsorption in the relative pressure (P/P0) range of 0.01-1.0. Adsorption branch of the aforementioned isotherms was employed to determine the pore size distribution using the Barrett-Joyner-Halenda (BJH) method developed for cylindrical pore geometry. Photoluminescence spectra (PL) of the samples were obtained using a fluorescence spectrometer (LS-30) at 293 K, using a Xe lamp (excitation at 320 nm) as light source.
Electrochemical measurements were performed in three-electrode quartz cells with 1 mM Fe(CN)6 3−/Fe(CN)6 4− (1:1) electrolyte solution. Platinum wire was used as counter electrode and Ag/AgCl used as reference electrodes. And g-C3N4 and ZrO2/g-C3N4 film electrodes on glass carbon electrode served as the working electrodes. The photoelectrochemical experiment results were recorded with an electrochemical system (CHI-650C, China).
C. Measurement of photocatalytic activity
The photocatalytic activity under visible light irradiation of the as-prepared photocatalyst ZrO2/g-C3N4 was evaluated on the basis of the degradation rate of MB. A 250 W indoor fluorescent lamp was used as visible-light irradiation source, cooled with flowing water in a quartz cylindrical jacket around the lamp. The short wave length components (λ < 420 nm) of the light were cut off using a glass optical filter. The distance between the lamp and the center of the quartz tube was 15 cm. 0.2 g of catalyst was suspended in 200 mL of MB solution (5 mg/L) under visible light irradiation. Before visible light irradiation, the solution was magnetically stirred in the dark for 30 min to ensure the establishment of an adsorption/desorption equilibrium. The reactor was open to air to ensure enough oxygen in the reaction solution. The lamp was switched on to initiate the reaction. During irradiation, agitation was maintained to keep the suspension homogeneous, and then this was sampled after an appropriate illumination time. The pure ZrO2 and g-C3N4 powder were also tested for comparison to evaluate the photocatalytic degradation activity of ZrO2/g-C3N4. The concentration of MB in each degraded sample was determined with a spectrophotometer (UV–vis spectrophotometer, WFZUV-2000) at λmax = 665 nm based on a calibration curve. Using this method, the ratio of the MB instant concentration (C t) in the solution to the initial concentration of MB, C t/C 0 was obtained to evaluate the photocatalytic degradation. Total organic carbon (TOC) was determined using TOC analyzer (Shimadzu TOC-VCPH).
D. Determination of hydroxyl radical (•OH)
The analysis of •OH formation at the photo-illuminated sample surface was tested by fluorescence technique using terephthalic acid. The terephthalic acid readily reacts with •OH to produce highly fluorescent product, 2-hydroxyterephthalic acid. Reference Yu, Xiang and Zhou21–Reference Yu, Wang, Cheng and Su23 The product of terephthalic acid hydroxylation, 2-hydroxyterephthalic acid, gave a peak at the wave length of about 435 nm by the excitation with the wave length of 315 nm. Reference Xiao and Ouyang24 In our work, the selected concentration of terephthalic acid solution was 5×10⁻⁴ M in 2×10⁻³ M NaOH solution. The fluorescence emission spectrum (excitation at 315 nm) of terephthalic acid solution in the presence of the as-prepared powder was measured every 30 min during illumination. Solution after centrifugation was analyzed on fluorescence spectrophotometer.
III. RESULTS AND DISCUSSION
A. XRD patterns and FTIR spectra
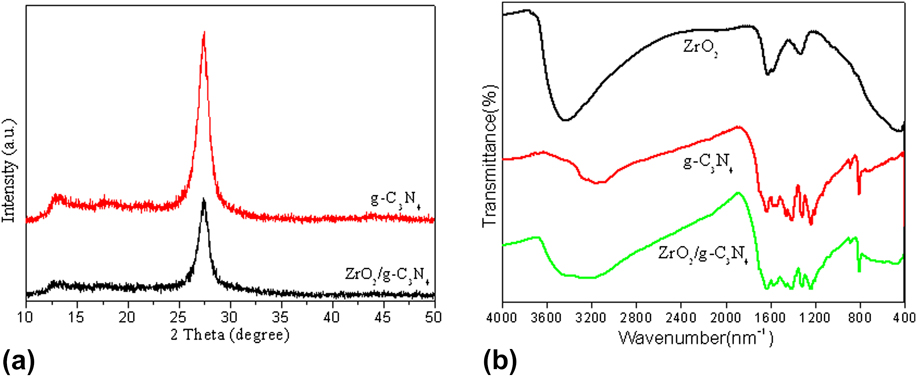
Figure 1(a) shows the XRD patterns of the g-C3N4 and ZrO2/g-C3N4 samples. As shown in Fig. 1(a), the characteristic peak of g-C3N4 around 27.4° could be clearly identified in the pure g-C3N4 sample, which was indexed as (002) diffraction plane. Reference Xu, Yan, Xu, Song, Li, Xia, Huang and Wan25 No significant diffraction peaks of ZrO2 phase can be detected in the composite ZrO2/g-C3N4 samples because of the small amount of ZrO2.
(a) XRD patterns for the g-C3N4 and ZrO2/g-C3N4 samples; (b) FTIR spectra of ZrO2, g-C3N4, and ZrO2/g-C3N4.

The FTIR spectra of ZrO2, g-C3N4, and ZrO2/g-C3N4 photocatalysts are shown in Fig. 1(b). In the FTIR spectrum of g-C3N4, the peak at 1645 cm−1 is attributable to the C=N stretching vibration modes, while the peaks at 1241, 1319, and 1404 cm−1 are due to the aromatic C–N stretching. The peak at 805 cm−1 is related to the s-triazine ring modes. In the FTIR spectrums of the ZrO2/g-C3N4 photocatalysts, the main characteristic peaks of both g-C3N4 and ZrO2 are observed, indicating that ZrO2 has been doped to the surface of g-C3N4.
B. SEM images
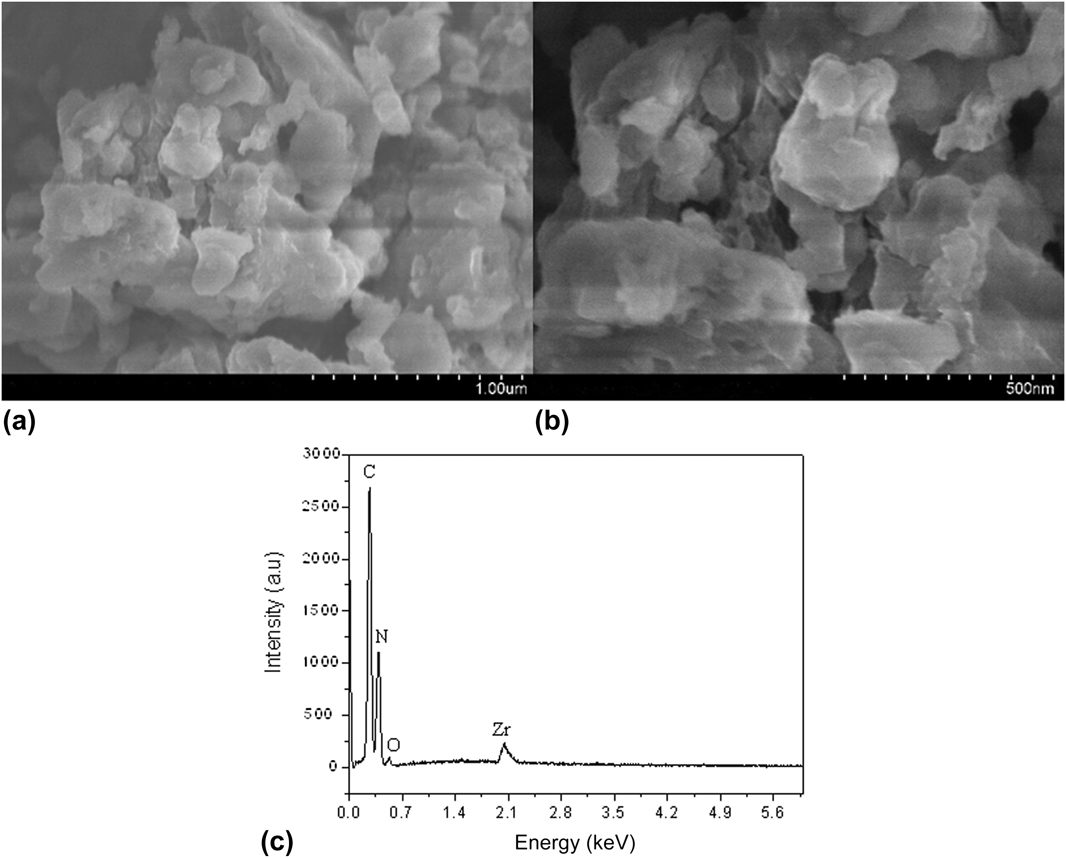
The morphologies of ZrO2/g-C3N4 were characterized by SEM. As shown in Figs. 2(a) and 2(c), it is found that the ZrO2/g-C3N4 composite photocatalyst is composed of irregular nanoparticles, and the diameters of the particles are in the range of 100–500 nm. The EDS pattern [see Fig. 2(c)] indicates that the composite photocatalyst contains Zr, O, C, and N elements. The EDS analysis clearly confirms the presence of ZrO2 in lower amount (about 5.6%) with respect to g-C3N4.
SEM images of the ZrO2/g-C3N4 sample (a and b); EDS analysis of ZrO2/g-C3N4 (c).

C. XPS analysis
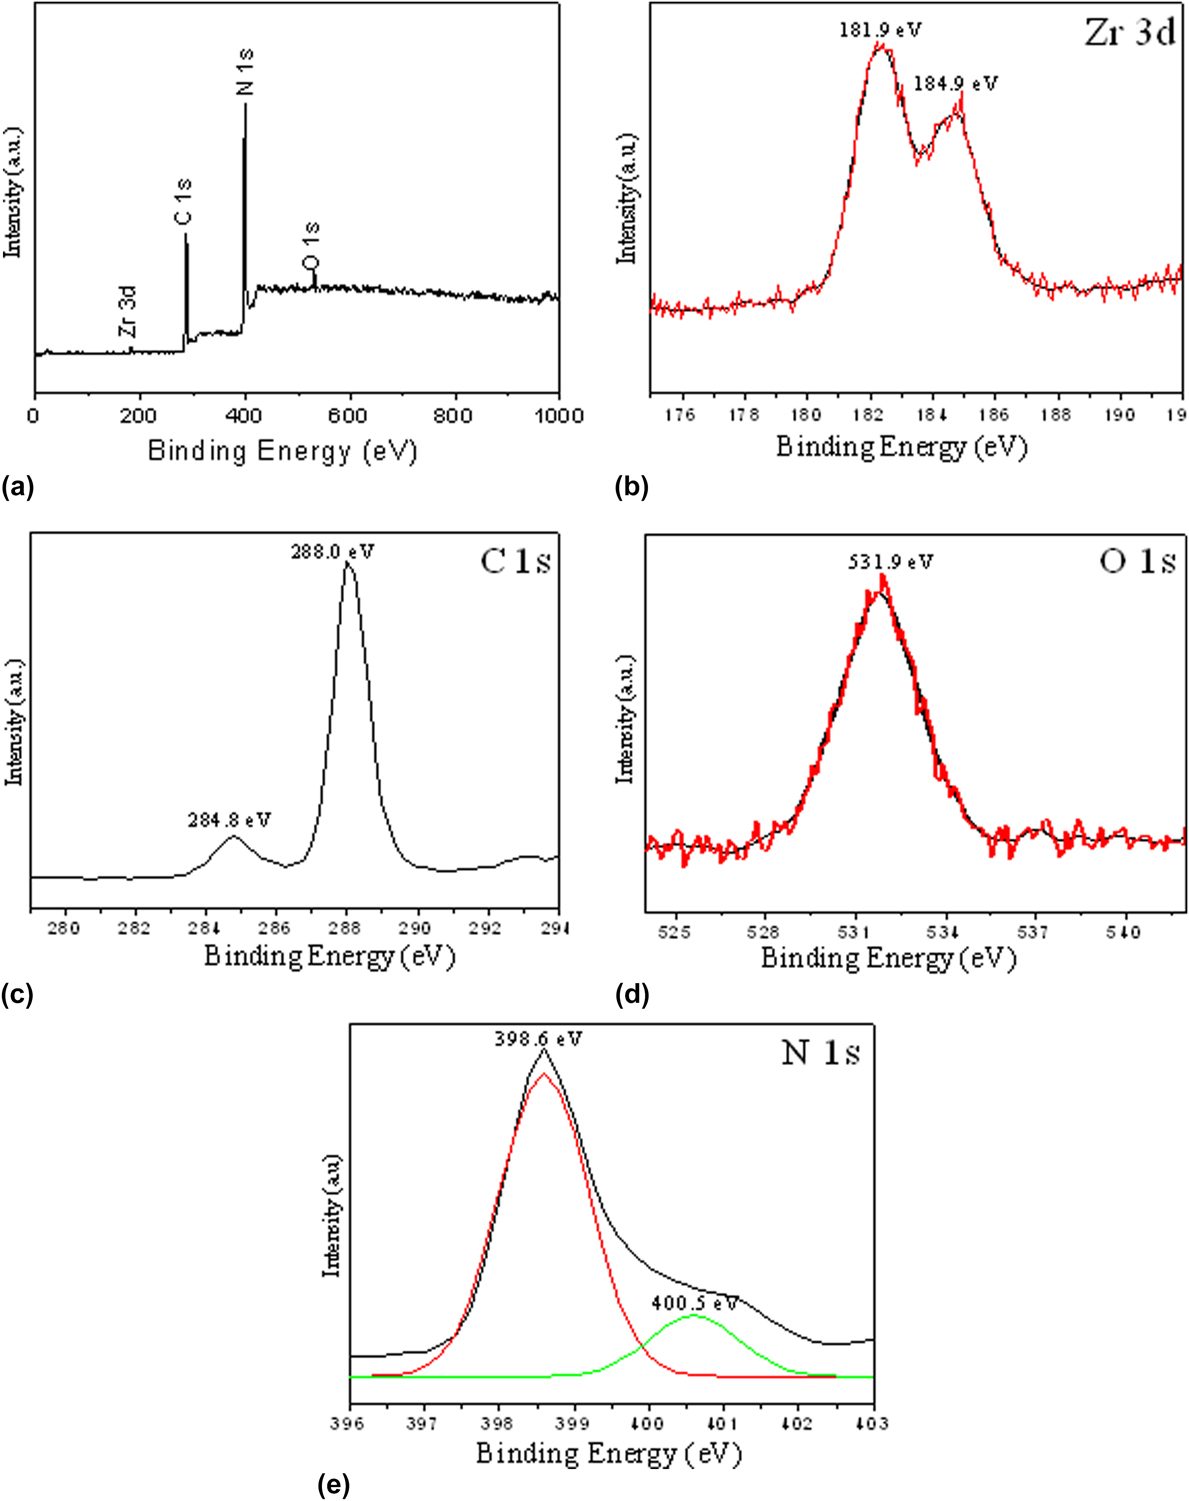
XPS measurement was performed to explicate the surface chemical composition and chemical states of the ZrO2/g-C3N4 photocatalyst. As shown in Fig. 3(a), the survey scan XPS spectrum of the composite sample indicates the presence of Zr, O, C, and N in the ZrO2/g-C3N4 composite. Figure 3(b) shows the XPS spectra of Zr3d. Two peaks can be centered at 181.9 and 184.9 eV, which can be assigned to Zr3d5/2 and Zr3d3/2, respectively. The C1s peak can be deconvoluted into two peaks at 284.8 and 288.0 eV, as shown in Fig. 3(c). The peak centered at 284.8 eV can be assigned to the adventitious hydrocarbon from the defect-containing sp 2-hybridized carbon atoms present in graphitic domains, corresponding to a C–N–C coordination, while the peak centered at 288.0 eV was assigned to N–C=N2 coordination for g-C3N4. Reference Xiang, Yu and Jaroniec26,Reference Jiang, Chen, Xie and Chen27 The O1s peak at 531.9 eV, as shown in Fig. 3(d), can be assigned to the Zr–O bonds. The N1s peak of the sample can be deconvoluted into two peaks, 398.6 and 400.5 eV, as shown in Fig. 3(e). It indicate that two different chemical environments of nitrogen existing in these samples. The predominant peaks at a binding energy of 398.6 eV may be attributed to nitrogen atoms in C–N–C group, Reference Khabashesku, Zimmerman and Margrave28 while the peak at 400.5 eV can be identified as tertiary nitrogen N–(C)3 groups in g-C3N4. Evidently, results from XRD, FTIR, and XPS revealed that the obtained composites contained g-C3N4 and ZrO2. The mass percentage of ZrO2/g-C3N4 was also determined by XPS analysis and the results show that the actual ZrO2 contents in ZrO2/g-C3N4 is 5.8%, which is consistent with the ICP analysis (6.3%).
XPS spectra of the ZrO2/g-C3N4 composite photocatalyst: (a) survey XPS spectrum; (b) Zr3d; (c) C1s; (d) O1s; and (e) N1s.

D. UV–vis DRS analysis
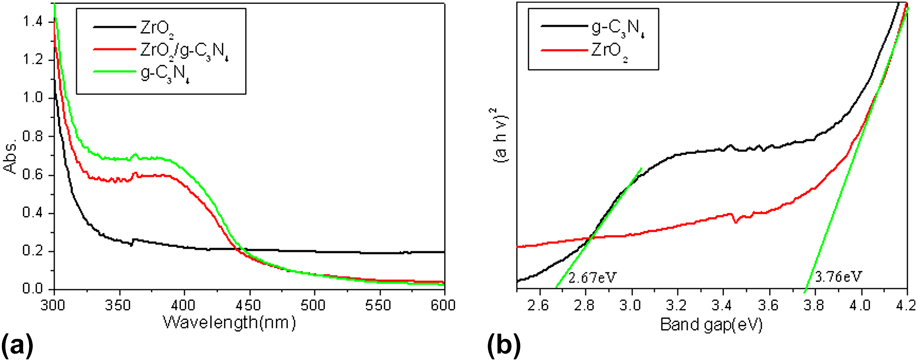
The optical absorption of the as-prepared ZrO2/g-C3N4 sample was characterized by DRS, which is compared to that of the individual components g-C3N4 and ZrO2. As shown in Fig. 4(a), the ZrO2/g-C3N4 composite shows an absorption edge around 400 nm, which is intermediate between the absorption edges between the components g-C3N4 and ZrO2, but much closer to that of the component g-C3N4 due to the low content of ZrO2 doped. The enhanced light absorption of the composite samples led to the production of more electron–hole pairs under the same visible light irradiation, which maybe due to the changes in its band gap and electronic structure after ZrO2 incorporation, and subsequently results in a higher photocatalytic activity. Reference Ye, Qiu, Yuan, Zhu, Xia and Zhu29
(a) UV–vis DRS of the as-prepared samples pure g-C3N4, ZrO2, and ZrO2/g-C3N4. (b) (αhν)2 versus photon energy (hν) plots for g-C3N4 and ZrO2/g-C3N4.

The optical band gap was determined by the following equation using the data of optical absorption versus wave length near the band edge.
 $${\left( {\alpha h\nu } \right)^{\rm{n}}} = A\left( {h\nu - {E_{\rm{g}}}} \right)\quad {\rm{,}}$$
where α, ν, A, and E g are absorption coefficient, light frequency, proportionality constant, and band gap, respectively. In the equation, n decides the characteristics of the transition in a semiconductor, that is, a direct transition for n = 2 and an indirect transition for n = 1/2. The band gap energies can be estimated from the intercept of the tangents to the plots of (αhν)2 versus photon energy (hν). Reference Wang, Maeda, Thomas, Takanabe, Xin, Carlsson, Domen and Antonietti30 The band gap energies estimated from these intercepts [see Fig. 4(b)] are 2.76 and 3.76 eV for g-C3N4 and ZrO2, respectively.
E. Specific BET surface areas and pore structure
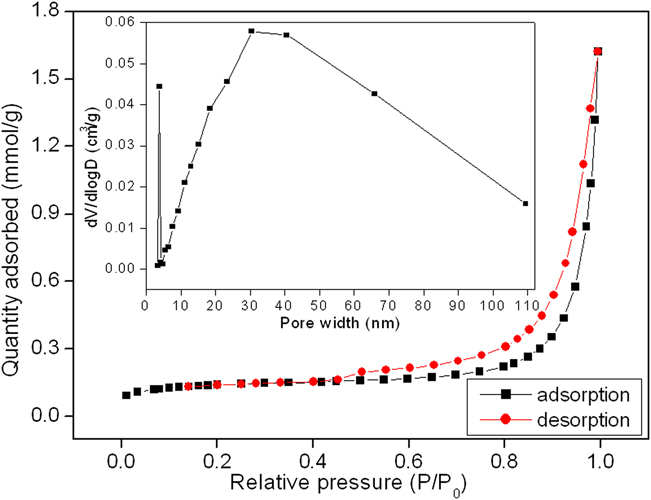
Figure 5 shows the nitrogen adsorption–desorption isotherms and the corresponding pore-size distribution (PSD) curve of the as-prepared ZrO2/g-C3N4. The shape of the hysteresis loop for the nanoparticles is a type H3, associated with bulk-like particles giving rise to narrow slit-shaped pores, which is consistent with the SEM results (Fig. 2). The sample shows the isotherm of type IV, with a hysteresis loop at relative pressure P/P 0 between 0.4 and 1.0, indicating the presence of mesoporous structures formed by aggregation of nanoparticles. From the PSD curve (Fig. 5, inset), the quite broad (from 2 to 50 nm) and mesoporous structures (about 30 nm) were found. The mesoporous structures can be related to the pores formed between stacked nanoparticles which can be seen from the SEM images mentioned above. Such organized porous structures might be extremely important in photocatalysis because of their efficient transport pathways between reactant and product molecules. Reference Miranda, Mansilla, Yánez, Obregón and Colón31
Nitrogen adsorption–desorption isotherms and pore size distribution profiles of the as-prepared ZrO2/g-C3N4.

F. Photoluminescence spectra
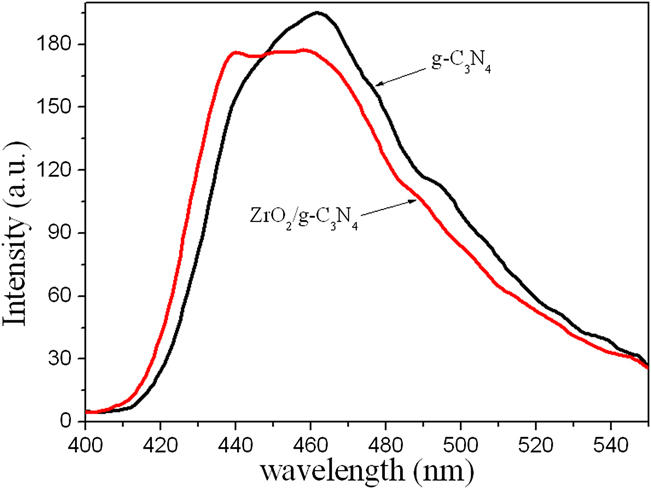
As shown in Fig. 6, the main emission peak is centered at about 462 nm for g-C3N4, and the emission peak of ZrO2/g-C3N4 appears a little blue-shift compared to g-C3N4 about 450 nm, which indicates the interaction between ZrO2 and g-C3N4. Obviously, compared with pure g-C3N4, the emission intensity of the ZrO2/g-C3N4 composite samples is lower. An obvious fluorescence quenching is observed for ZrO2/g-C3N4, indicating that ZrO2 dispersed on the surface of g-C3N4 could effectively inhibit the combination of photogenerated charge carriers, which is helpful for the separation of photogenerated electron–hole pairs in g-C3N4. Reference Zhang, Liu, Wu and Chen32
Comparison of photoluminescence spectrum of pure g-C3N4 and ZrO2/g-C3N4 samples.

G. Photocatalytic activity
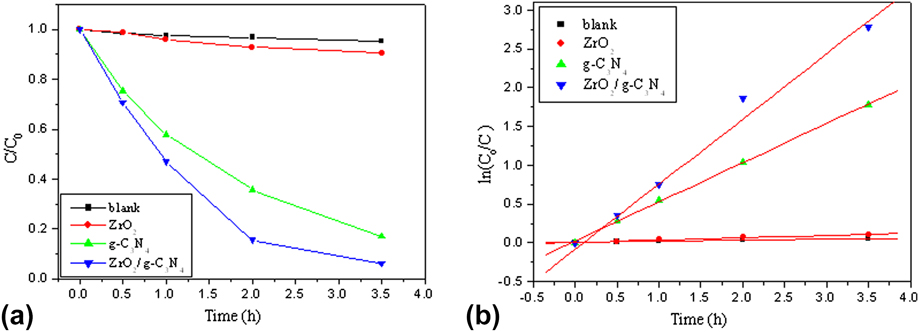
Figure 7 shows the photocatalytic activity of the photocatalyst for decomposing the organic pollutant MB under visible light illumination. As a comparison, photocatalytic degradation rate of MB under visible light irradiation without the photocatalyst was also performed, and the results demonstrated that the degradation rate was very low. Under the same condition, the ZrO2/g-C3N4 photocatalyst shows much higher photocatalytic activity for the photodegradation of MB than that of the pure ZrO2 or g-C3N4, in which the degradation rate of MB over ZrO2/g-C3N4 reach to 99% during 3.5 h [Fig. 7(a)].
(a) Photocatalytic degradation of MB in the solution over ZrO2, g-C3N4, and ZrO2/g-C3N4 and (b) the first-order kinetics plot of MB degradation using various photocatalysts. Dose of photocatalyst: 1 g/L; initial concentration of dyes: 5 mg/L; volume: 200 mL; initial pH was used.

To have a better understanding of the reaction kinetics of MB degradation catalyzed by various photocatalysts, the experimental data were fitted by a first-order model as expressed by Eq. (1), due to the fact that the value of the rate constant k commonly gives an indication of the activity of the composite photocatalyst. Reference Sun, Yuan, Qiu, Jiang, Xie, Shen and Zhu33
 $$\ln \left( {{{{C_0}} \mathord{\left/ {\vphantom {{{C_0}} C}} \right. \kern-\nulldelimiterspace} C}} \right) = kt\quad {\rm{,}}$$
where k is the rate constant (min−1), C 0 and C are the initial concentration and the instant concentration at time t of MB dye, respectively. Figure 7(b) shows the linear relation between ln(C 0/C) and the irradiation time for degrading MB over three different photocatalysts. Apparently, the rate constant k for the photodegradation of MB over ZrO2, g-C3N4, and ZrO2/g-C3N4 is 0.0299, 0.5033, and 0.8398 min−1, respectively. This result indicates that ZrO2-doped g-C3N4 could efficiently enhance the photocatalytic activities with respect to the pure g-C3N4 or ZrO2 under visible light irradiation.
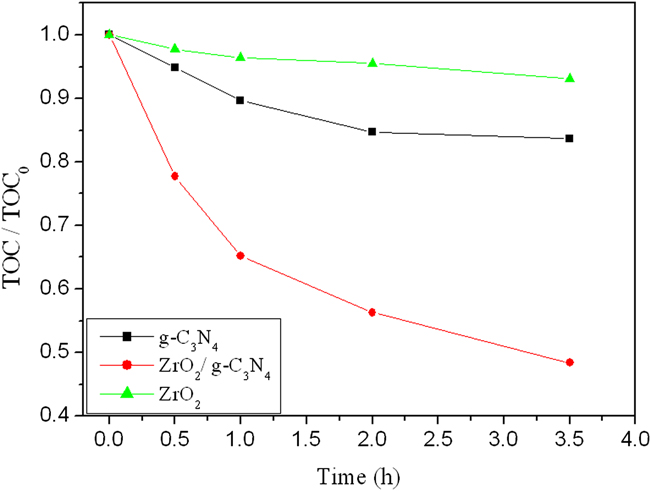
TOC removal of MB solution has been also studied under the same condition over the photocatalyst sample, as shown in Fig. 8. For the ZrO2/g-C3N4 photocatalyst, its TOC removal is higher than that of the pure ZrO2 or g-C3N4. The rate of the TOC reduction was lower than that of the decoloration of the MB dye. For the concentration of 5 mg/L, the decoloration rate over the ZrO2/g-C3N4 photocatalyst reached 99%, while the TOC removal rate of the solution reached to about 50% within 3.5 h, indicating that the as-prepared photocatalyst shows high photocatalytic efficiency in the degradation of organic pollutants for environmental remediation.
TOC removal of the MB solution under visible-light illumination with different photocatalysts. Dose of photocatalyst: 1 g/L; initial concentration of dyes: 5 mg/L; volume: 200 mL; initial pH was used.

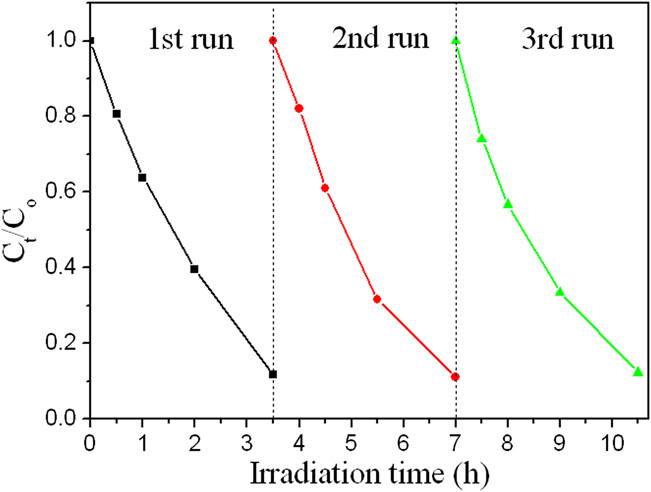
To investigate the reusable stability of the ZrO2/g-C3N4 composite photocatalysts, the recycling experiments on the ZrO2/g-C3N4 sample were also carried out under the same reaction conditions, as shown in Fig. 9. The catalyst was separated from the reaction mixture by centrifugation after each reaction cycle. It was found that there was no significant reduction in the photocatalytic activity even after three photocatalytic cycles, reflecting the viable potential of the current system for practical application.
Cycling runs in the photocatalytic degradation of MB by ZrO2/g-C3N4 without pH adjustment.

H. Photocatalytic degradation mechanism
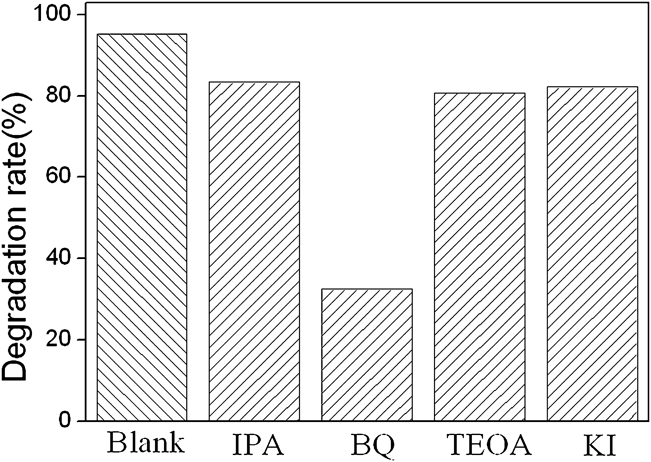
To investigate the mechanism for the photodegradation of MB over ZrO2/g-C3N4, the study on the main oxidative species in the photocatalytic process is essential. The main oxidative species formed in the photocatalytic process could be detected through the trapping experiments of carriers. The effects of p-benzoquinone (BQ, •O2 − scavenger), isopropyl alcohol (IPA, •OH scavenger), triethanolamine (TEOA, electron scavenger), and KI (h+ and •OH scavenger) on the photodegradation rate of MB under visible light irradiation were investigated and the results are shown in Fig. 10. The results reveal that the MB photodegradation was significantly suppressed by BQ and slightly decreased by IPA, TEOA, and KI, indicating that the •O2 − might be the main active species in MB photodegradation, and the •OH, photogenerated electrons and h+ are also partly involved in the process of photocatalytic degradation.
Photocatalytic mechanism for ZrO2/g-C3N4 trapping experiment of the active species during the photocatalytic reaction (dose of photocatalyst: 1 g/L; initial concentration of dyes: 5 mg/L; volume: 100 mL; initial pH was used; active species concentration: 4 × 10⁻⁴ mol/L, time: 3.5 h).

To further verify the role of the •OH in the photocatalytic degradation, the determination of •OH radical in the process of photocatalytic degradation was also studied.
The determination of •OH radical's formation in the process of photocatalytic degradation under visible light irradiation was performed by fluorescence technique using terephthalic acid (TA), which readily reacted with •OH radicals to produce highly fluorescent product, 2-hydroxyterephthalic acid (HTA). Reference Guo, Lin, Zheng, Xiao and Li34 The intensity of the peak attributed to HTA was known to be proportional to the amount of •OH radicals formed.
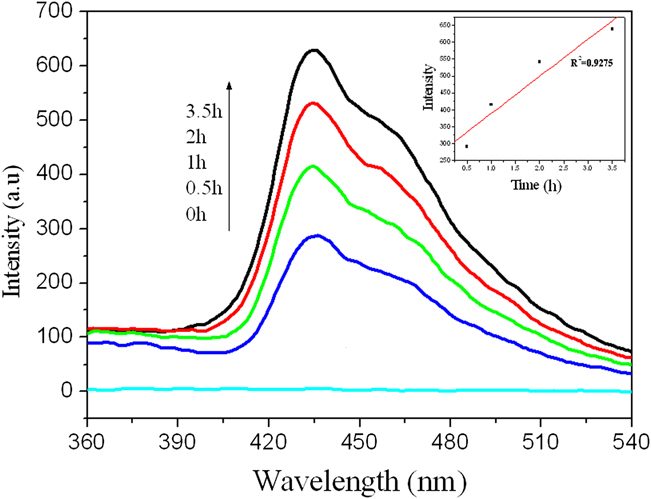
As shown in Fig. 11, gradual increase in the fluorescence moderate-intensity at about 425 nm was observed with increasing illumination time, indicating that the •OH played an important part in the photocatalytic process. The plot of increase in fluorescence intensity against illumination time at 425 nm has been also discussed (see Fig. 11, inset). The fluorescence intensity by visible light illumination in TA solutions increased almost linearly against time. Consequently, it can be concluded that the •OH radicals formed at the ZrO2/g-C3N4 powder interfaces were in proportional to the light illumination time obeying zero-order reaction rate kinetics.
PL spectral changes with visible light irradiation time for ZrO2/g-C3N4.

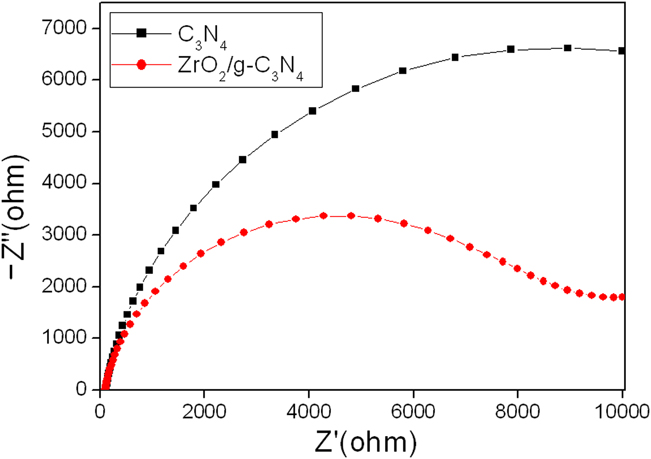
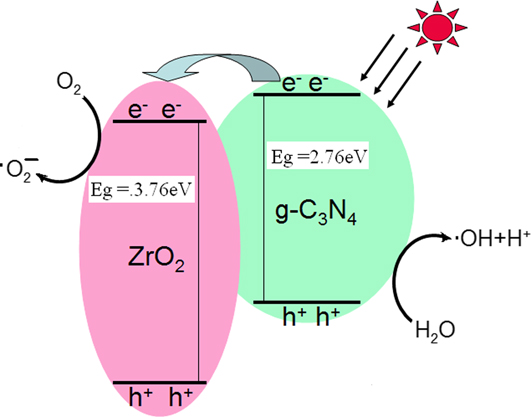
To further investigate the charge transfer and recombination processes at solid/electrolyte interfaces of the ZrO2/g-C3N4 samples, electrochemical impedance spectroscopy (EIS) Nyquist plots of pure g-C3N4 and ZrO2/g-C3N4 sample has been carried out. As shown in Fig. 12, the Nyquist impedance plots of pure g-C3N4 and ZrO2/g-C3N4 samples electrode materials cycled in 1 mM Fe(CN)6 3−/Fe(CN)6 4− (1:1) electrolyte solution both exhibit semicycles at high frequencies. The diameter of the arc radius on the EIS Nyquist plot of the ZrO2/g-C3N4 composite electrode is much smaller than that of the bare g-C3N4 electrode under visible light irradiation, which indicates a more effective separation of photogenerated electron–hole pairs and fast interface charge transfer occurred in the ZrO2/g-C3N4 composites. Reference Zhao, Yu, Quan, Chen, Zhang, Zhao and Wang35 Clearly, the introduction of a small amount of ZrO2 can lead to a significant increase for the photocatalytic degradation onto g-C3N4. Based on the above results and analysis, the possible mechanisms for the photocatalytic performance enhancement of the ZrO2/g-C3N4 composite photocatalyst are proposed as shown in Fig. 13. Based on the DRS results, ZrO2 cannot absorb the visible light. When g-C3N4 absorbs the visible light, it can induce π–π* transition and transfer the excited-state electrons from the VB to the CB. The CB potential of g-C3N4 (−1.12 eV) is more negative than the CB edge of ZrO2 (−1.09 eV), so the excited electrons would subsequently transfer to the surface of photocatalyst to react with oxygen to from •O2 − and •OH, which can photo-oxidize the organic pollutant in solution.
EIS Nyquist plots of the g-C3N4 and ZrO2/g-C3N4 sample electrodes under visible light irradiation (λ ≥ 400 nm).

The proposed mechanism of the photocatalytic degradation process.

IV. CONCLUSIONS
In conclusion, a novel ZrO2/g-C3N4 composite photocatalyst has been prepared via calcination and hydrothermal treatment for the first time. The as-prepared ZrO2/g-C3N4 photocatalyst has been characterized by XRD, FTIR, SEM, XPS, DRS, BET, and PL spectra. The photocatalytic activity of the as-prepared photocatalyst was evaluated by degradation of methylene blue under visible light irradiation. The results showed that the activity of the composite photocatalyst ZrO2/g-C3N4 for photodegradation of MB is much higher than that of either pure g-C3N4 or ZrO2, which is ascribed to the effective electron–hole separation based on the PL spectra and EIS. The •O2 − might be the main active species in MB photodegradation, and the •OH and photogenerated electrons are also partly involved in the process of photocatalytic degradation.
ACKNOWLEDGMENTS
This work was supported by the Natural Science Foundation of Fujian, P.R. China (2013H0053 and 2012J06005), the Natural Science Foundation of Zhangzhou (ZZ2012J01), the Key Laboratory of Urban Environment and Health, Institute of Urban Environment, Chinese Academy of Sciences (KLUEH201305), and Innovation Team of Minnan Normal University.