

1 Introduction
South Africa is currently considering embarking on a major restructuring of its health system, with the intention of moving towards a universal health system. This has been prompted by the decision of the ruling party at its 2007 Polokwane Policy Conference to implement a National Health Insurance (NHI). A useful starting point for considering what future health system changes may be appropriate is to understand existing health system challenges. If there are to be fundamental changes in a health system, these should be designed to address current problems and contribute to health system improvements.
This paper evaluates one important aspect of current health system performance in South Africa, namely the benefit incidence of health services. It addresses the question ‘which socio-economic groups are receiving what benefits from using health services in South Africa and is this distribution of benefits appropriate?’ Health service benefits are traditionally measured in monetary terms, based on the utilisation and cost of different types of health services.
Historically, health care benefit incidence analyses (BIAs) have focused primarily on the distribution of benefits from publicly funded health services (Castro-Leal et al., Reference Castro-Leal, Dayton, Demery and Mehra1999; Castro-Leal et al., Reference Castro-Leal, Dayton, Demery and Mehra2000; Demery, Reference Demery2000; Pearson, Reference Pearson2002; EQUITAP, 2005; O'Donnell et al., Reference O'Donnell, Van Doorslaer, Wagstaff and Lindelow2008). The underlying premise was that government funds should disproportionately benefit lower socio-economic groups and BIA was conducted to assess whether government spending was in fact ‘pro-poor’. However, in the context of the growing international emphasis on striving for universality, epitomised by the World Health Assembly's 2005 resolution on sustainable health financing and universal coverage (World Health Organization, 2005) and again highlighted in the 2010 World Health Report (World Health Organization, 2010), it is becoming important to consider the benefit incidence in the overall health system. Universal systems require cross-subsidies; in the case of health service benefits, this would require risk cross-subsidies from the healthy to those in poor health and in the case of health care financing, income cross-subsidies from the wealthy to the less well-off. In other words, everyone should benefit from health services according to their need for care, and not on the basis of their ability to pay (ATP) (Wagstaff and van Doorslaer, Reference Wagstaff and van Doorslaer1993). To assess the extent of cross-subsidy in the overall health system, one needs to quantify benefit incidence of both public and private sector health services. In a universal health system, private providers are a resource that could potentially be drawn on for the benefit of all citizens (in terms of health professional resources, hospital beds, diagnostic equipment, etc.) For this reason, this paper considers the benefit incidence of both publicly funded services and all health services in South Africa.
As indicated previously, in the international literature, it is generally accepted that health service benefits should be distributed across individuals according to their relative need for services (Wagstaff and van Doorslaer, Reference Wagstaff and van Doorslaer1993). This paper, therefore, considers not only the distribution of benefits across socio-economic groups, but also compares this distribution with that of health care needs, according to a range of indicators of need.
The next section describes the methods that were used, including how the data sources used in this analysis differ from those in previous BIA studies. Thereafter the results are presented, in the form of both the ‘traditional public subsidy’ BIA and the more comprehensive overall health system BIA. These are compared with the distribution of need for health services. The discussion first considers our findings before focusing on the reasons for differences between these findings and those in previous studies.
2 Methods
2.1 Source of service utilisation data
A household survey dataset that incorporates both information on health service utilisation and some measure of socio-economic status is required for a BIA. This study uses data obtained from a nationally representative household survey undertaken specifically to obtain accurate data on health service utilisation (called the South African Consortium for Benefit Incidence Analysis, SACBIA survey)Footnote 1 for all members of the household. Data collection for the SACBIA survey was conducted largely in May and June 2008 covering all of the nine provinces. There were two major stages in the sampling. The first stage selected Enumerator Areas (EAs) as the primary sampling units. These EAs are small area units with a population size of about 750 people each and between 150–200 households on average. To ensure a nationally representative sample, the EAs were stratified by province, type of settlement (farm, informal settlement, tribal settlement, small holding and urban settlement) and population group (Black African, Coloured, Indian and White). In total, 960 EAs were selected across the nine provinces with a probability proportional to the size of the EA in each stratum. In the second stage, five randomly selected households were interviewed within each EA such that the total sample size was 4800 households (∼22,000 individuals). The respondent was the person who is responsible for making health care decisions. Due to variations in the EAs, EAs were selected pro rata with their population sizes across provinces and population groupings. Twenty per cent of completed questionnaires were subjected to telephonic ‘check-backs’ for verification and there was double-entry data capture to reduce errors. The data were appropriately weighted to national population levels taking into account the sample design. The questionnaire and study protocol were subjected to ethical review by the University of Cape Town, and all respondents provided signed informed consent.
2.2 Core benefit incidence methods
The methodology for a BIA study involves the following steps:
• dividing households into socio-economic groups (e.g. quintiles);
• estimating health service utilisation for individuals within each socio-economic group;
• each individual's utilisation is weighted by the cost of that service (i.e. benefit = service utilisation × unit cost of service); and
• the distribution of benefits is compared across socio-economic groups and relative to the need for care in each group (O'Donnell et al., Reference O'Donnell, Van Doorslaer, Wagstaff and Lindelow2008).
Each of these steps is described in detail below.
2.3 Measuring socio-economic status
To assess whether or not benefits from using health care services are fairly distributed requires a target distribution against which fairness can be assessed. Such a target distribution could be linked to race, sex, geographical location or a measure of socio-economic status. Various approaches may be used to measure socio-economic status of households: reported income, consumption expenditure or a composite index of socio-economic status or assets (O'Donnell et al., Reference O'Donnell, Van Doorslaer, Wagstaff and Lindelow2008). Because of the inherent deficiencies in income being reported accurately, we did not collect this information. Asset indices offer an alternative socio-economic measure in developing countries BIA (O'Donnell et al., Reference O'Donnell, Van Doorslaer, Wagstaff and Lindelow2008). However, in this paper, we measure socio-economic status using reported monthly household expenditure. Here fairness implies that the distribution of benefits follow socio-economic gradients of the need for health care services.
Due to monthly expenditure variations, however, monthly expenditure may not adequately measure household living standards. Annual consumption expenditure was therefore generated using the consumption regression approach (see O'Donnell et al., Reference O'Donnell, Van Doorslaer, Wagstaff and Lindelow2008: 72 for further details). Basically, we link the SACBIA survey to the Income and Expenditure Survey (IES) 2005/2006. Aggregate annual consumption in the IES is regressed on a set of selected variables – frequent monthly expenditure and a set of significant household characteristics (such as rural/urban location, province of residence, population group, age of household head and household size) common to both the SACBIA and the IES survey and measured in the same way. The resulting estimated coefficients are used as weights to predict total annual consumption expenditure in the SACBIA survey (O'Donnell et al., Reference O'Donnell, Van Doorslaer, Wagstaff and Lindelow2008). To confirm the validity of the predicted consumption expenditure, it was compared with that reported in the IES and also its consistency was assessed across provinces and population groups. Per capita consumption expenditure was generated from the predicted annual consumption expenditure in the SACBIA survey. This was used to categorise households into socio-economic quintiles.
2.4 Calculating utilisation rates
The questionnaire used in the SACBIA household survey had a number of innovations compared with existing household surveys in South Africa. To date, all BIA studies undertaken in South Africa (which have focused only on public sector health services and which, for that reason, have sometimes been called fiscal incidence studies) have drawn on either the 1993 Living Standards and Development Survey (LSDS) (Castro-Leal, Reference Castro-Leal1996) or the annual General Household Survey (GHS) (van der Berg, Reference van der Berg2000, Reference van der Berg2009; van den Heever, Reference van den Heever2009). Both the LSDS and the GHS have a number of deficiencies in the way they measure health service utilisation. In particular, they under-report actual utilisation levels. Utilisation information in these surveys is conditional on self-reporting a recent illness. This means that such information is collected only if a respondent indicates that he or she or another household member has been ill or injured within a specified recall period. Health service use for other reasons (e.g. for ante-natal care, other preventive services, to collect medication or for a check-up in the case of chronic illness and deliveries) is not reported. In addition, these surveys ask only if a service has been used but fail to capture multiple visits. Therefore, the data in these surveys do not allow one to calculate utilisation rates, for example, the number of outpatient visits per person or hospital admissions or inpatient days per 1000 people per year. Instead, they indicate the percentage of the population that visited a health service at least once within the specified recall period (usually either two weeks or a month). To overcome these deficiencies, the SACBIA survey asked about any outpatient health service utilisation in the preceding month (i.e. not restricted to use in relation to self-reported illness) and obtained information on all visits (i.e. multiple visits to the same provider and visits to more than one service provider) and, likewise, for hospital admissions in the preceding year.
From a BIA perspective another limitation in existing household surveys is the fact that the categories of service provider are not sufficiently disaggregated to identify exactly what type of service was used. For example, both the LSDS and GHS record only whether or not a public hospital was used but not the type of public hospital. Hence the differential benefits arising from the use of different types of public hospitals (which can vary markedly in their unit costs) (Lombard et al., Reference Lombard, Stegman and Barnard1991) cannot be calculated. The SACBIA survey asked for the name of the hospital visited or to which an individual was admitted. This was later coded into the three main categories of public hospital: district, regional or provincial/central. The main types of health care providers for outpatient services included in the SACBIA survey were:
• Public hospitals (disaggregated into district, regional and provincial or central hospitals)
• Public clinics or community health centres (CHCs)
• Private general practitioners (GPs)
• Private specialists
• Private dentists
• Private retail pharmacies
• Private hospitals
• Traditional or spiritual healers
• Other private providers (i.e. those that are not explicitly listed in the questionnaire, such as physiotherapists, psychologists, midwives, etc.).
In this paper, we only considered the utilisation patterns for what are generally termed formal providers (or some may prefer to term ‘Western medical practitioners’). This is consistent with international practice on health services utilisation (Sarma and Simpson, Reference Sarma and Simpson2006; Björn, Reference Björn2007). Thus, we exclude visits to traditional and faith based healers and traditional birth attendants. We also excluded visits to workplace or occupational health services, due to low reported use of these services. The recall period for outpatient visits in the SACBIA survey is one month, which is again consistent with international practice (O'Donnell et al., Reference O'Donnell, Van Doorslaer, Wagstaff and Lindelow2008). However, for our BIA, seasonality indices were applied to outpatient visit data to generate annual utilisation rates, taking account of seasonal variations in visits based on the month and the province in which the survey was conducted rather than the traditional use of a fixed multiplicative scalar of 12 (or 13) if the recall period is one month (or four weeks) (O'Donnell et al., Reference O'Donnell, Van Doorslaer, Wagstaff and Lindelow2008). This is because there are seasonal patterns in both disease incidence and the health seeking patterns of households (Jolly, Reference Jolly1988; Sauerborn et al., Reference Sauerborn, Nougtara, Hien and Diesfeld1996; Briet, Reference Briet2002).
For visits to public facilities, the seasonality indices were generated from the District Health Information System (DHIS). This documents total visits to individual public sector facilities in each month. For private services, the indices were generated from data on utilisation patterns in each month, as provided by the largest medical scheme administrators.Footnote 2 This is because the use of private sector services is heavily skewed towards medical scheme members (Borghi et al., Reference Borghi, Ataguba, Mtei, Akazili, Meheus, Rehnberg and McIntyre2009; Harris et al., Reference Harris, Goudge, Ataguba, McIntyre, Nxumalo, Jikwana and Chersich2011). The index compares utilisation of each type of service in the month(s) in which the household survey data were collected, with the average monthly utilisation over a full year. We apply the seasonality indices to the utilisation data from the household survey to obtain seasonally adjusted annual utilisation rates of the specified health facility or service. Each seasonality index is calculated as follows:
 $$S{{I}_{jk}}\, = \,\left( {\mathop{\sum}\limits_{i\, = \,1}^{12} {{{U}_{ik}}} } \right)/\left( {{{U}_{jk}}} \right)\;{\rm{for}}\;{\rm{each}}\;k\;{\rm{and}}\;{{U}_{jk}}\, \gt \,0{}$$
where SIjk is the seasonality index for month j, Uik is the total visits to a specified facility k in month i, Ujk is the total visits to facility k in month j – that is, the month of interest. In addition for all public facilities, the seasonality index is province specific.
2.5 Calculating unit costs
Although weighting utilisation by unit costs according to the type of service used is standard practice in health sector benefit incidence studies (Castro-Leal et al., Reference Castro-Leal, Dayton, Demery and Mehra2000; Demery, Reference Demery2000; Pearson, Reference Pearson2002; O'Donnell et al., Reference O'Donnell, Van Doorslaer, Wagstaff and Lindelow2008), and was undertaken in the first health benefit incidence study in South Africa (Castro-Leal, Reference Castro-Leal1996), this weighting has not been used in more recent South African studies (van der Berg, Reference van der Berg2000, Reference van der Berg2009; van den Heever, Reference van den Heever2009). The main reason for this is that the GHS data do not disaggregate utilisation between different categories of public hospitals. Utilisation incidence (i.e. using simply utilisation data) and benefit incidence (i.e. weighting utilisation by unit costs) will be identical within a service or facility category (e.g. for clinics) when the assumption of same unit cost per province is used. Difficulty arises, however, when combining incidence estimates across facility categories (e.g. clinics and hospital outpatient departments). As unit costs of hospital-based outpatient services are considerably higher than at clinics or CHCs, the benefit of using hospital services will be substantially understated by the assumption of “a uniform unit cost for a service” (van den Heever, Reference van den Heever2009).
To calculate the unit costs of public sector services, data on recurrent expenditure for each type of facility were obtained from National Treasury. In addition, total utilisation data of public sector facilities were obtained from the National Department of Health's DHIS dataset.Footnote 3 In the case of clinics and CHCs, the unit cost was simply calculated as expenditure divided by number of visits. In the case of hospitals, unit costs are calculated as the total recurrent expenditure in a facility divided by the ‘weighted’ total number of users (inpatients and outpatients). Frequently, the assumption made is that the cost of an outpatient visit is a fixed proportion of the cost of an inpatient day (Lombard et al., Reference Lombard, Stegman and Barnard1991; Adam and Evans, Reference Adam and Evans2006). An outpatient visit for instance is sometimes considered to be one-third or one-fourth of the cost of an inpatient day (Adam and Evans, Reference Adam and Evans2006) across all hospitals. However, this assumption is not based on solid empirical evidence; previous research has shown that the ratio of expenditure per inpatient day to expenditure per outpatient visit varies considerably across hospitals at different levels of care (Lombard et al., Reference Lombard, Stegman and Barnard1991).
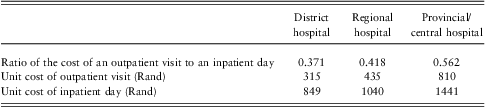
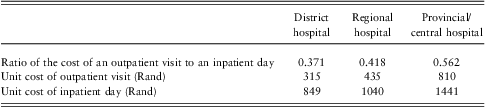
For this reason, using statistical methods, we calculated the ratio of the unit costs for inpatient care and outpatient visits for different categories of public sector hospitals. Data on total outpatient and inpatient utilisation by type of hospital and by province were extracted from the DHIS, as well as the total number of nurses and medical doctors – as a proxy for the relative size of the facility. These data were combined with those on recurrent expenditure at each public sector hospital in South Africa, provided by the National Treasury. A simple regression model was fitted to generate the ratio of variation between the cost of an outpatient visit and an inpatient day across various public facilities. This ratio was then used to estimate the unit costs for inpatient and outpatient services for each hospital category. The ratios and unit costs calculated through this method are summarised in Table 1. These unit costs per inpatient day were converted into the unit costs per admission by estimating the average number of patient days per admission for each category of hospital.
Cost ratios and unit costs for inpatient days and outpatient visits to public sector hospitals (2006)
Source: Ataguba (forthcoming).
For private sector services, unit cost estimates were based on data provided by the largest medical scheme administrators. The total value of claims (as opposed to amount paid by the scheme) was divided by the total number of visits or hospital admissions for each type of service (e.g. visit to a private dentist, GP or specialist).
2.6 Computing health service benefits and evaluating its distribution
The unit costs estimated indicate the average cost of providing the services at different levels of care. The benefit from using service/facility k accruing to an individual i can be computed as
 $${{B}_{ik}}\, = \,{{q}_{ik}}{{c}_k}$$
where k represents facility/service type such as a visit to the district hospital or a private pharmacy visit; qik is individual i's utilisation rate of facility/service k; and ck is the unit cost (or price in the case of private services) of a visit or admission to facility k. The total benefits accruing to an individual are obtained analogously by summing up all facility/service specific benefits received. This is represented as
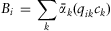 $${{B}_i}\, = \,\mathop{\sum}\limits_k {{{{\bar{\alpha }}}_k}({{q}_{ik}}{{c}_k})} $$
where  $$\[-->$<>{{\bar{\alpha }}_k}<$>
<!--\]$$ is a scalar used to adjust or standardize the total benefits to annual benefits. For inpatient stays,
 $$\[-->$<>{{\bar{\alpha }}_k}\, = \,1<$>
<!--\]$$ while for outpatient visits,
 $$\[-->$<>{{\bar{\alpha }}_k}<$>
<!--\]$$ is the seasonality index obtained as in equation (1.1).
It is important to note that for the ‘traditional’ public subsidies BIA, user fees paid at public facilities are deducted from the benefits of public sector services obtained in equation (1.3). However, because we are concerned about a system-wide BIA based on expenditure financed from all sources, such user fees are ignored. As user fee revenue is very small in South Africa, it is reasonable to also assume that the results, particularly the BIA results of individual facility levels (e.g. district hospitals and regional hospitals), will be little changed.
After computing the benefits accruing to users as well as categorising households using per capita consumption, we evaluate the distribution of benefits across the various quintiles. Specifically, we are interested in the proportion of benefits that accrues to each quintile from the use of each type of service. This information can also be represented using concentration curves and indices. Using the concentration curve, we could assess whether the poorest 20% of the population, for instance, are receiving their population share (20%) of benefits by comparing the concentration curve with the 45-degree line (line of equality).
The computation of concentration indices can be done using several methods. We derive the indices using the methodology of a regression (Kakwani et al., Reference Kakwani, Wagstaff and van Doorslaer1997) as
 $$2\sigma _{r}^{2} ({{y}_i}/\mu )\, = \,\alpha \, + \,\beta {{r}_i}\, + \,{{{\epsilon}}_i}$$
where yi is value of the variable of interest (i.e. the benefit variable) for individual i, μ is the average of the variable of interest, ri is the weighted fractional rank of individuals,  $$\[-->$<>\sigma _{r}^{2} <$>
<!--\]$$ is the variance of the fractional rank, β (the ordinary least squares estimate) is the parameter of interest – the concentration index. The weighted fractional rank (Lerman and Yitzhaki, Reference Lerman and Yitzhaki1989) is computed as follows:
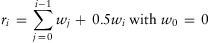 $${{r}_i}\, = \,\mathop{\sum}\limits_{j\, = \,0}^{i{\rm{ - }}1} {{{w}_j}\, + \,0.5{{w}_i}\;} {\rm{with}}\;{{w}_0}\, = \,0$$
where wi is the relative sample weight (i.e. scaled to sum up to 1) and observations are sorted in ascending order of living standards or ATP.
Because of the possibility of an ambiguous conclusion based on the concentration indices, dominance tests were performed using the Distributive Analysis Stata Package (Adbelkrim and Duclos, Reference Adbelkrim and Duclos2007).
2.7 Estimating need for health care
It is difficult to measure accurately the need for health care and also its distribution across socio-economic groups. Mortality statistics rarely have socio-economic information associated with them. Morbidity data are usually collated from health facilities and thus are more representative of service use than of need for health care. For this reason, the distribution of health need is usually estimated by including questions on health status in household surveys.
Household surveys in high-income countries that aim to measure health need rely on self-assessed health (SAH) status measures. This can take the form of a ‘crude’ measure of health need (e.g. how would you describe your current health status, with a number of options ranging from excellent to very poor) (van Doorslaer and Gerdtham, Reference van Doorslaer and Gerdtham2003). Another method is to measure a number of aspects of health status (e.g. mobility, ability to care for oneself, and to undertake usual activities, pain and anxiety) and use mathematical algorithms to construct scales that translate these multi-attribute or multi-dimensional measures into a single index. These include the index of independence in activities of daily living, the health utility index, the EQ5D and the SF-36.
The SACBIA survey collected SAH status data, through a simple rating question. Even though the categories in this measure (e.g. excellent, good, fair, poor, very poor) do not tell us that there is equidistance between categories (O'Donnell et al., Reference O'Donnell, Van Doorslaer, Wagstaff and Lindelow2008), the SAH measure is still useful in understanding the disparities that exist between individuals’ perceived health status. In the inequality literature, several methods are used to scale the SAH status. The most frequently used procedure is to recode the responses as a dichotomous variable. This is the approach adopted in this study; individuals were re-coded as having good health if they reported health status above ‘fair’ and as bad health if they reported health status of ‘fair’ or below. This procedure was adopted because of its simplicity and also because studies that have standardised the measure of need often come up with very similar results (ibid).
SAH measures are routinely used internationally in studies such as this. However, because they are subjective measures, we also present information on the relative distribution of other indicators of need for health services across socio-economic groups that are available. A search of the literature on morbidity according to socio-economic status for South Africa was undertaken. Several studies were identified that use data mainly from the 1998 South African Demographic and Health Survey and similar household surveys and consider the distribution of diseases such as tuberculosis (TB), hypertension and malnutrition. The distribution patterns from these studies are compared with the distribution of the SAH measure to provide a more comprehensive and rigorous overview of the distribution of burden of ill-health across socio-economic groups in South Africa.
2.8 Limitations
There are a number of limitations in the research presented in this study. First, the unit cost data used for the private sector are in effect a unit price (i.e. includes actual costs of providing the service plus a profit, or return on investment, component). While this is different from the case of the public sector (which is based simply on recurrent costs actually incurred), the measures of unit ‘cost’ we have used for the public and private sectors do accurately reflect the financial resources that are expended, whether through tax funding, in the form of out-of-pocket payments, or through contributions to and spending on services by private medical schemes. Second, we do not include traditional healer services in the analysis, but this is in line with international practice. Third, the prediction of annual household consumption expenditure assumes that the estimated coefficients will remain constant between the two time periods. Even though there may be variations, the preliminary checks suggest a very close prediction. Finally, the key measure of health status is a self-assessed measure. While there may be differences in socio-economic gradients across different types of measures, there is general consistency of negative gradient in the reporting of SAH status.
3 Results
3.1 Benefit incidence of public sector health services
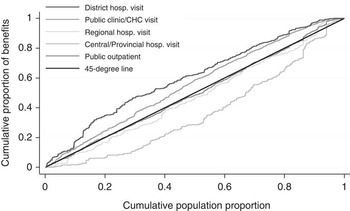
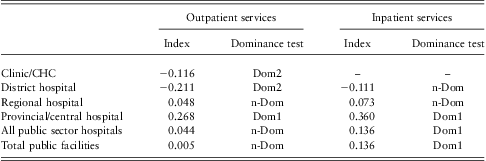
Figure 1 provides an overview of the concentration curves of benefits for public sector outpatient services. Outpatient services at lower levels of care within the public sector, particularly clinics, CHCs and district hospital outpatient departments can be described as pro-poor with negative concentration indices (see Table 2). In contrast, outpatient services provided at the highest level public sector hospitals (provincial and central hospitals) are strongly pro-rich with positive concentration indices. Specifically, the concentration curves for higher level outpatient services (regional hospitals, provincial and central hospitals) lie below the 45-degree line while the concentration curves for lower level outpatient services (district hospitals, public clinics and CHCs) lie above the 45-degree line. When all public sector outpatient services are combined, there is an almost equal distribution of benefits across the different socio-economic groups and the concentration index is close to zero.
Concentration curves of public outpatient visits. CHC = community health centre

Concentration indices for public sector health services
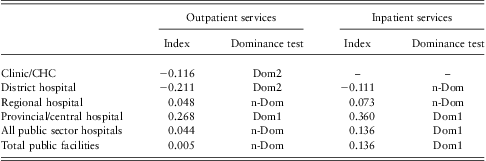
CHC = community health centre.
Dom1 = the 45-degree line dominates the concentration curve.
Dom2 = the concentration curve dominates the 45-degree line.
n-Dom = non-dominance or curves crossing.
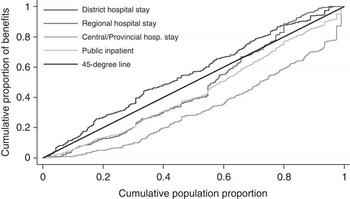
For inpatient care at public sector hospitals, as shown in Figure 2, only the district hospital, representing the lowest level of care, shows a pro-poor distribution. Regional, and provincial and central hospitals are pro-rich. The concentration curve of regional hospital inpatient stays does not show a clear sign of pro-richness across the entire distribution. It is pro-rich at lower quintiles and pro-poor at upper quintiles even though the combined effect is pro-rich.
Concentration curves of public inpatient stays

The concentration indices summarised in Table 2 clearly indicate that the only public sector services that can be defined as pro-poor are clinic, CHC and district hospital inpatient and outpatient services. All other public sector outpatient and inpatient services are pro-rich. This is particularly the case in relation to provincial and central hospital services as also confirmed by the dominance test results. The test of dominance statistically indicates that for outpatient services, only benefits from clinics/CHCs and district services are pro-poor. Provincial and central hospital services are pro-rich. For inpatient services, benefits from all public sector hospitals and facilities combined, as well as provincial and central hospitals, are pro-rich.
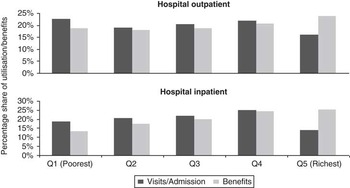
In order to compare the results of the benefit incidence with that of utilisation incidence (i.e. utilisation vs utilisation weighted by unit costs for different facility types), we present in Figure 3 the distribution of outpatient and inpatient utilisation and benefits across socio-economic groups when all public hospitals are aggregated. The share of the benefits accruing to the top (bottom) quintile is higher (lower) than their utilisation share because those in the top (bottom) quintile utilise higher (lower) level hospitals more, which have higher (lower) unit costs. While Table 2 clearly indicates that the benefit incidence of public sector hospital outpatient and inpatient services are pro-rich, using utilisation data only (unweighted for differential unit costs for different levels of care) results in an incidence pattern that is pro-poor.
Utilisation vs benefit incidence of aggregated public hospital services

3.2 Benefit incidence of private sector health services
The benefits from private sector services were found to be heavily concentrated among the top quintiles, particularly in terms of inpatient care (see Figure 4). This generated the pro-rich pattern of concentration curves found in Figure 4. This is not surprising, given that medical scheme members are almost exclusively in the highest socio-economic groups. In fact over 50% of the population in the top quintile are medical scheme members as are nearly 13% of those in quintile 4, while scheme membership is almost non-existent in the other quintiles.
Concentration curves of private sector services

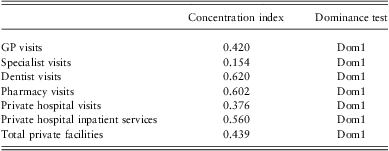
Individually, all the private sector outpatient health services considered showed pro-rich patterns (see Figure 5).
Concentration curves of private outpatient visits. GP = general practitioner

These are also confirmed by the concentration indices as well as the dominance test results presented in Table 3. From the concentration indices, the most pro-rich distributions of benefits are visits to dentists, retail pharmacies and private hospital inpatient services. The statistical test of dominance concludes that the pro-rich pattern is statistically significant.
Concentration indices for private sector health services
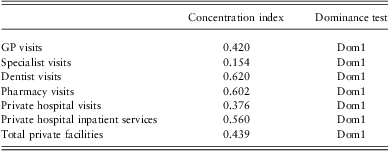
GP = general practitioner.
Dom1 = the 45-degree line dominates the concentration curve.
3.3 Benefit incidence of overall health services
Given that benefits from both public regional, provincial and central hospitals and private health sector services are pro-rich, it is unsurprising that overall health service benefits are strongly pro-rich (see Figure 6). This applies to both outpatient and inpatient services when the combination of public and private sector services is considered.
Percentage share of total health service benefits

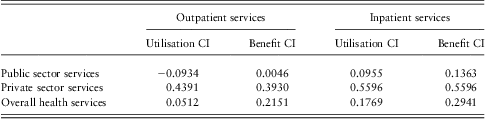
The concentration curves (see Figure 7) as well as the concentration indices (see Table 4) also show that the distribution of overall benefits is pro-rich. This pattern is the same for both total public and total private benefits. However, from the concentration indices, private health sector services are the most pro-rich while public outpatient services are the least pro-rich.
Concentration curves of public and private services

Concentration indices of utilisation and benefits for health services overall
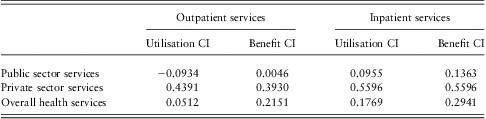
CI = concentration index.
In order to see the impact of failing to weight utilisation by the unit costs of different types of services, we present in Table 4 the concentration indices for both the utilisation analysis (i.e. ignoring the unit costs) and the benefit analysis (taking account of utilisation and unit costs). As expected, especially for public sector services, there are marked differences between the utilisation concentration index and the benefit incidence concentration index.
For public sector outpatient services, for instance, the utilisation concentration index shows that the distribution is pro-poor but the benefit incidence results show that it is pro-rich. For inpatient care, the extent of pro-richness is higher for the benefit incidence results compared with those from the utilisation incidence analysis.
3.4 Benefit incidence according to medical scheme membership status
The benefits obtained from both public and private services across the insured and uninsured are presented in Figure 8, which clearly indicates that medical scheme members seldom use and derive benefits from public sector health services. Apart from public services, the distribution of benefits is biased towards the insured as the insured receive more than their population share of benefits (horizontal line in figure indicating that only 16% of the population are medical scheme members and 84% of the population is uninsured). The insured derive 32% of the total benefits from health services in South Africa, which is far greater than (double) their 16% population share.
Distribution of benefits by insurance status

3.5 Benefit incidence relative to measure of need for health care
In assessing equity in benefit incidence, we argue that it is insufficient to compare simply the distribution of benefits across socio-economic quintiles. As indicated previously, fairness and equity imply that the benefits of using services should be distributed according to the need for health care and not ATP. The figure below (Figure 9) compares each socio-economic group's share of benefits from using health services (public sector and both public and private sectors) with their relative share of need for health services, measured through SAH status. Both sets of data (service use and SAH status) are drawn from the same household survey dataset and thus, this is a comparison across the same sample. It indicates that health care benefits are not distributed in line with need for health services; although more people in the poorest groups report being in bad health than in the richest groups, the poor receive a much lower share of benefits from health services than the rich. This is also true for public health services.
Comparison of share of benefits with share of need for health care across socio-economic groups

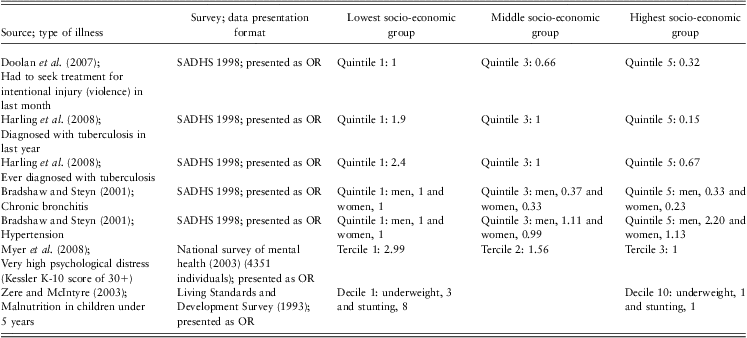
Although SAH status is used internationally in studies such as this, in assessing the need for care, some readers may be concerned about the use of a ‘subjective’ indicator of need for health care. For this reason, Table 5 summarises findings on the socio-economic distribution of ill-health from other South African studies. Though none of the studies presents data in terms of the percentage share of ill-health for each socio-economic group, using odds ratios (OR) and these ‘more objective’ measures of ill-health still indicate that the poor bear a greater burden of ill-health. This is particularly the case for malnutrition, communicable diseases (such as TB), injuries and mental health conditions. The only disease included in previous studies where the burden was greater on higher income groups was hypertension, and this was only the case for men (hypertension was quite evenly distributed across socio-economic groups for women).
Overview of the burden of disease across socio-economic groups in South Africa
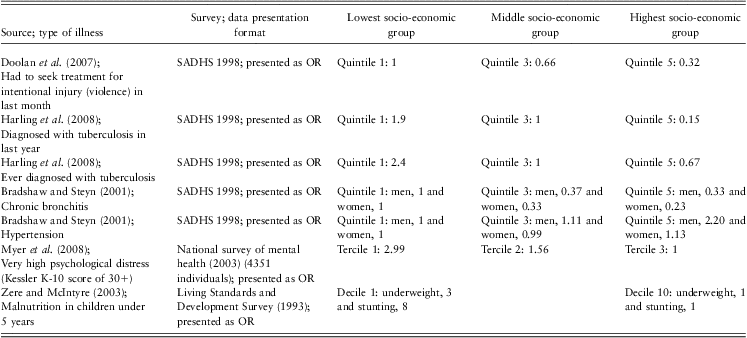
SADHS = South African Demographic and Health Survey; OR = odds ratios.
4 Discussion
The findings of this study show that, in general, lower income groups in South Africa do not benefit as much from public sector health services as higher income groups. Such distribution is more marked at higher levels of care than at lower levels. Comparing this distribution of service benefits with that of need for care, we also observed that a smaller share of benefits accrue to those who need relatively more health care services compared with those who need relatively less.
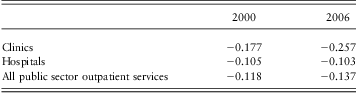
The extent of the distribution of public benefits across income groups in our study differs from that estimated in other South African studies. In particular, van der Berg (Reference van der Berg2000, Reference van der Berg2009) estimated that utilisation of all public sector outpatient health services was pro-poor (see Table 6). Both the van der Berg study and our study find that visits to clinics and CHCs are pro-poor. However, while the van der Berg study estimates that public sector hospital outpatient services are pro-poor (having a utilisation concentration index of −0.103 in 2006), our study finds that they are only pro-poor when using unweighted utilisation data (having a utilisation concentration index of −0.033) but are pro-rich for the benefit, or cost-weighted utilisation, data (with a concentration index of 0.044; see Table 2). In this case, the difference in the findings is largely due to the fact that visits to higher level hospitals, utilised more by the rich, cost more than those at lower levels that the poor use most often. The other factor that is likely to have contributed to these differences is that the van der Berg study used data from the GHS which, as highlighted in the methods section, under-estimates utilisation and does not allow for the calculation of total utilisation rates.
Concentration indices for public sector outpatient health service utilisation from previous studies
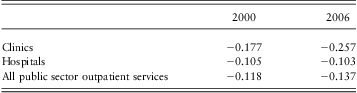
Source: van der Berg (Reference van der Berg2009).
In van den Heever (Reference van den Heever2009), unit costs are ignored with the argument that incorporating unit costs of district, regional and provincial/central hospitals will distort results as “[m]any central hospitals provide services found in district and regional hospitals”. We adopted a different position. Considerable effort has been invested in improving referral patterns and promoting treatment at the appropriate level of care. Even with remaining provision of ‘lower levels of care’ within ‘higher level category hospitals’, the unit cost of providing this care is greater at higher level facilities than if they were treated at lower level facilities due to factors such as higher cost staff. This impacts on the distribution of (in this case) government-funded service benefits and thus should be taken into account. We would argue that, given that we have access to utilisation disaggregated by type of facility, weighting utilisation by the unit cost of each type of facility will result in less ‘distortion’ than ignoring these cost differentials as our results have shown (see Table 4).
Another potential contributory factor to the different findings is that only visits to public sector facilities by those who are not members of medical schemes are included in the van der Berg study. “Visits by members of Medical Aid schemes were ignored, on the basis that such recorded visits may have reflected confusion between public and private health facilities, or often were fully paid for by the patients concerned, i.e. were not subsidised by the state” (van der Berg, Reference van der Berg2009). While medical scheme members generally use private sector services, it is shown in Figure 8 that they also sometimes use public sector services, particularly those provided at provincial and central hospitals. We are confident that ‘confusion between public and private health facilities’ did not occur to any great extent in our survey as respondents were asked to provide the name of the hospital used, which was cross-checked to lists of public and private hospitals and further coded into the specific hospital category. Moreover, in contrast to the above assumption, these services are seldom paid for, largely due to inefficient billing systems within public sector hospitals. For example, in 2008, less than R226 million was paid by medical schemes to public sector hospitals (Council for Medical Schemes, 2009), that is, user fee revenue for public sector services attributable to medical schemes was less than 0.3% of total government spending on health services in that year.
These are the major reasons for the differences in findings between our study and other recent studies of this nature. Even without weighting utilisation by the unit cost of services at different categories of public sector facilities, our utilisation concentration index reflects a pro-rich utilisation pattern in public sector hospital outpatient departments (except in the case of district hospitals). However, overall utilisation of public sector outpatient services (including clinics and CHCs) is pro-poor [which is in line with van der Berg's (Reference van der Berg2009) findings, but our utilisation concentration index was −0.093 compared with van der Berg's −0.137]. Weighting this utilisation by unit costs translates into a mildly pro-rich distribution, with a benefit incidence concentration index of 0.005.
Other recent studies of public sector health services have not considered the distribution of benefits from inpatient care, which accounts for the majority of public spending on health care. Our study shows that inpatient services in all categories of public hospitals are pro-rich except for district hospitals where it is pro-poor (even though the test of dominance was not conclusive). Overall, for outpatient and inpatient care combined, public sector health care facilities in South Africa benefit higher income groups more than lower income groups (benefit concentration index of 0.062).
A key finding in the current study, which had the benefit of far more extensive and detailed utilisation data, is that the public health sector is not performing as well in terms of equity as suggested by the findings of previous studies. This highlights the importance of improving routine household survey data collection, with one of the most important necessary changes being collection of information on all outpatient visits within the recall period and on number of hospital admissions.
While it is encouraging that those services closest to the population, namely clinics, CHCs and district hospitals are pro-poor, it is of considerable concern that the poorest South Africans are not able to use referral services, particularly at provincial and central hospitals but also regional hospitals in relation to inpatient care, to the same extent as the richest groups. Higher level hospitals account for a greater share of publicly funded health care expenditure than lower level facilities. In 2009/10, ∼R6.2 billion was devoted to clinics and health centres, R14.4 billion to district hospitals, R15.1 billion to regional hospitals and R12.2 billion to central and provincial hospitals (National Treasury, 2009). To explore ways in which the performance of public sector health services can be improved, we need to understand better the reasons for the current distribution of service benefits. The findings presented here indicate that it is important to recognise that even the richest groups use public sector hospitals in South Africa. This makes intuitive sense given that it is extremely difficult to afford private hospital services without insurance coverage and nearly 50% of the population in quintile 5 and 87% of the population in quintile 4 are not members of medical schemes. Figure 8 shows that medical scheme members seldom use public sector services, but evidently the non-insured in the richest two quintiles use far more than what would be considered to be their ‘fair share’ of public sector services. As these income groups are concentrated in urban areas, they have better physical access to public sector hospitals than rural dwellers, particularly to provincial and central hospitals. From a policy perspective on equity, improving access to public sector health care facilities outside of the largest urban centres is particularly important. Clinics and CHCs as well as district hospitals are reaching lower income groups suggesting that, to promote equity, these district level services should continue to be strengthened.
In this study, we have also considered the distribution of benefits from private sector health services. While a key policy concern may be ensuring that government health care resources are ‘well targeted’, within the context of the growing emphasis on promoting universal health systems, it is also important to consider how well the overall health system is performing in terms of the distribution of service benefits relative to need. In many ways, the scarcest resource available for health service provision is that of human resources. Given that a high proportion of most categories of health professionals work in the private sector in South Africa, it is also important to assess how the benefits from utilisation of the services they provide is distributed. The recently released Green Paper on the proposed NHI indicates that the service delivery resources of both the public and private providers will be drawn on to respond to the health care needs of the whole population; that is, the NHI will purchase services from both the public and private sectors (Department of Health, 2011). Thus, combining the benefit incidence of public and private sector services enables us to consider how well the overall health system is performing at present and serves as a baseline for evaluating whether the proposed NHI changes the distribution of public and private service benefits over time.
Private sector health services in South Africa are strongly pro-rich, particularly in relation to inpatient care (which has a concentration index of 0.56). Given this pattern, combined with public sector services also being pro-rich overall although to a much lesser extent, health services overall are very pro-rich in South Africa. This is the situation whether utilisation only is considered or utilisation weighted by unit costs is considered (see Table 4).
The pro-rich pattern of private sector services is not surprising and some may argue that this can be expected in any country of the world. The feature that makes the South African health system exceptional is that funding via private insurance schemes as a percentage of total health care expenditure is the highest in the world. The World Health Organization's National Health Accounts dataset (http://www.who.int/nha/country/en/) puts South Africa's private insurance scheme share of total health care expenditure at 39% (which is an underestimate of the actual share of 44%). The only other countries with a share exceeding 30% are Namibia (at 37%) and the United States of America (at 35%), both of which have similarly fragmented health systems with South Africa. Three countries (Brazil, the Bahamas and Argentina) have private insurance levels exceeding 20% but less than 30% of total health care expenditure while a further seven countries exceed 10% but less than 20%. Spending via private insurance schemes is less than 10% (and generally less than 5%) in all other countries (with 193 countries in the dataset). As indicated in Figure 8, private insurance coverage strongly influences the use of private sector services. The analysis of the distribution of benefits from private sector services and from overall health services points to the role that the large private insurance scheme sector (large in terms of expenditure share of 44% rather than population coverage share of only 16%) plays in contributing to a disjuncture between the distribution of service benefits and that of need for health care.
Not only are the poorer sections of the population not benefiting from public (and private) sector health services to the extent that higher income groups are, they bear a far greater burden of ill-health than the rich. This is demonstrated by both the SAH status measure and ‘more objective’ measures of ill-health.
Unfortunately, the data on the distribution of ill-health across socio-economic groups summarised in Table 5 suffer from several deficiencies, including:
• These data are somewhat dated (but there are no published analyses of more recent data).
• The published analyses use different techniques of measuring socio-economic status; although most use composite asset indices, different variables are included in some of the indices.
• Although they all use OR, they use different socio-economic groups as the reference group.
• Some of these measures are also self-reported and although more ‘objective’ in that they are based on reported diagnoses of illness, they are unlikely to reflect fully differences in morbidity. This is because some respondents may suffer from an illness but have not yet presented at a health service for diagnosis. Only two of the studies are based on actual measurement of ill-health as part of the household survey (malnutrition based on anthropometric measures and mental illness based on a standardised questionnaire).
In essence, the data are not directly comparable to those we used in assessing need for care. Nevertheless, they do add to our understanding of the relative distribution of ill-health across socio-economic groups.
Apart from hypertension, all other causes of ill-health for which data are available were considerably higher in poorer than richer groups. For example: “Living in a household in the wealthiest quintile compared to living in a household in the poorest quintile was significantly protective against experience of violence” (Doolan et al., Reference Doolan, Ehrlich and Myer2007). Violence requiring health care interventions was more than 3 times greater in the poorest than richest quintile. Cases of TB diagnosed in the past year or over one's lifetime were nearly 13 times and 3.6 times greater in the poorest than richest quintile, respectively. Chronic bronchitis was more than 3 and 4.3 times greater for men and women, respectively, in the poorest compared with the richest quintiles. Psychological distress is 3 times greater amongst the poorest than richest third of the population. Children from the poorest 10% of households have rates of underweight (low weight-for-age) and stunting (low height-for-age), which are about three and eight times those of the richest 10%, respectively (having a concentration index of −0.152 for underweight and −0.215 for stunting) (Zere and McIntyre, Reference Zere and McIntyre2003).
What these data demonstrate is that there is overwhelming evidence that the poor in South Africa bear a far greater burden of ill-health than the rich. While there may be a greater incidence of certain non-communicable chronic diseases among the rich than the poor, the differential is far smaller (two-fold in the case of hypertension) than the differential in favour of the rich for other causes of ill-health (ranging from a three-fold higher incidence in the poor than the rich for psychological distress and violence to a thirteen-fold difference for TB). This corroborates the finding based on SAH status that there is a greater need for health care among the poor than the rich.
Therefore from our findings, what is known as the ‘inverse care law’ (Hart, Reference Hart1971) clearly applies in South Africa; those with the greatest need for health care services use and benefit from fewer services than those with relatively less need for health care.
5 Conclusions
In general, health services in South Africa are strongly pro-rich, in both the public and the private health sectors. The only exception is the lowest level of public sector health services: clinics, CHCs and district hospitals. The highest socio-economic quintile derives a greater share of the benefits from using health services, both within the public and private health sectors, than the lowest socio-economic quintile, despite the heavier burden of ill-health among the poorest groups. From an equity perspective, where benefits from health services should be distributed according to each group's relative need for care rather than their ATP, the current health system (both the public and overall health system) cannot be considered to be equitable.
Other recent studies of the distribution of benefits from public sector services suggested that there was a pro-poor distribution. However, these studies only considered outpatient services, were based on household survey data that underestimates utilisation and did not take into account the differential costs of different levels of care. This highlights the importance of improving the quality of the data on health service utilisation that is routinely collected in household surveys so that we can accurately assess health sector performance and to monitor this over time.
The findings of this study draw attention to the urgency of transforming the South African health system into one that more adequately meets the health care needs of our population. We need to understand better the factors contributing to the pattern of benefit incidence identified in this study (e.g. the range of health service access barriers faced by lowest socio-economic groups) so that these specific access barriers can be addressed (e.g. through measures such as providing patient transport to referral facilities). We also need to explore ways in which the human resources in both the public and private health sectors can be drawn on to meet the health care needs of all South Africans better.
Acknowledgements
This research was funded by the European Commission (Sixth Framework Programme; Specific Targeted Research Project no: 32289) and IDRC (Grant number 103457). DM is supported by the South African Research Chairs Initiative of the Department of Science and Technology and National Research Foundation. The University of Cape Town research office funded the writing workshop at which this article was first drafted. We also acknowledge the helpful comments of Gavin Mooney on an earlier draft. The usual disclaimer applies.