1. Introduction
The study of instabilities has been a driving force in fluid mechanics for the last two hundred years, and is part of virtually every modern course in fluid mechanics. Understanding the nature of various observed instabilities is the basis for their control, be it with the aim of suppressing or on the contrary exploiting them. This has led to the distinction of several archetypes of instability scenarios, which the instability described in this paper combines in a way that, as we discuss below, is uncommon yet likely relevant in other systems. Specifically the present system generalizes Faraday-type parametric instabilities to the systems where two types of waves coexist.
In this paper, we present an experimental report and theoretical model for a recently discovered instability that arises when a liquid rivulet in an air-filled Hele-Shaw cell is forced acoustically (Le Lay & Daerr Reference Le Lay and Daerr2025b ). A thin gravity-driven filament of liquid in a Hele-Shaw cell usually flows down vertically, but when a spatially invariant horizontal forcing is applied, it destabilizes and forms a complex spatiotemporal pattern. This pattern has a finite wavelength, while the forcing is spatially homogeneous, and it can be seen as a phase-locked superposition of transverse and longitudinal waves propagating on the rivulet. Explaining the mechanism behind this pattern-forming instability and its consequences is the main motivation of this article
In dynamical systems theory, it is common to distinguish additive, forcing and parametric, or multiplicative, forcing. When forcing a system additively, one usually expects a linear response composed of the same space spatial and temporal frequency components as the excitation. On the contrary, exciting a system parametrically leads to more complex, nonlinear behaviour: this is notably illustrated in fluid dynamics by the much-studied Faraday instability (Faraday Reference Faraday1831; Douady Reference Douady1990; Kumar & Tuckerman Reference Kumar and Tuckerman1994; Bongarzone et al. Reference Bongarzone, Viola, Camarri and Gallaire2022) where the control parameter is the gravitational acceleration. Indeed, vibrating a liquid vertically will famously lead to secondary instabilities (Tufillaro, Ramshankar & Gollub Reference Tufillaro, Ramshankar and Gollub1989; Fauve, Douady & Thual Reference Fauve, Douady and Thual1991; Daudet et al. Reference Daudet, Ego, Manneville and Bechhoefer1995), complex interactions between modes (Residori, Guarino & Bortolozzo Reference Residori, Guarino and Bortolozzo2007), partially stationary patterns when the forcing is localized (Moisy et al. Reference Moisy, Michon, Rabaud and Sultan2012), intricate spatiotemporal patterns (Edwards & Fauve Reference Edwards and Fauve1994), mean flows (Guan et al. Reference Guan, Magoon, Durey, Camassa and Sáenz2023) – it can also prevent coalescence of droplets (Couder et al. Reference Couder, Fort, Gautier and Boudaoud2005) or can even be used to parametrically stabilize unstable fluid configurations (Apffel et al. Reference Apffel, Novkoski, Eddi and Fort2020).
In our system we apply an additive, acoustic forcing. This forcing, which is homogeneous in space and harmonic in time, leads to a linear response of the rivulet with the same spatiotemporal characteristics. However, this linear response effectively behaves as a multiplicative parameter coupling longitudinal and transverse waves on the rivulet. When the forcing is strong enough, this leads to the seemingly paradoxical parametric destabilization of a system that is forced additively. This original mechanism allows an initially homogeneous rivulet to display a pattern presenting a well-defined wavelength although the forcing does not depend on space.
Moreover, this instability relies on the coamplification of two waves that cooperate by interacting constructively instead of competing for the available energy. This constructive interaction takes the form of a triadic resonant nonlinear interaction between the two coamplified waves and the linear response to forcing. Such an interaction is reminiscent of the case of Faraday waves in a Hele-Shaw cell (Douady, Fauve & Thual Reference Douady, Fauve and Thual1989; Li, Li & Liao Reference Li, Li and Liao2019; Bongarzone et al. Reference Bongarzone, Jouron, Viola and Gallaire2023), and of other physical systems where a parametric coupling between waves allows for their amplification: for example internal waves in a variable-depth container (De Szoeke Reference De Szoeke1983; Benilov Reference Benilov1987), the elliptical instability in rotating flows (Kerswell Reference Kerswell2002; Le Bars et al. Reference Le Bars, Cébron and Le Gal2015; Lemasquerier et al. Reference Lemasquerier, Grannan, Vidal, Cébron, Favier, Le Bars and Aurnou2017; Le Bars & Lecoanet Reference Le Bars and Lecoanet2020) or even, in a different field outside of fluid mechanics, the biphoton mode in optical parametric oscillators (Amon et al. Reference Amon, Suret, Bielawski, Derozier and Lefranc2009); with the notable difference that contrary to the previously cited example, in our system the coamplifying waves are different in nature, having distinct propagation mechanisms and thus very different dispersion relations. Discussing the emergence of a parametric instability as a limit case of triadic wave interaction where the forcing acts by producing a response in the form of a wave with zero wavenumber, provides a second motivation for this work.
In the system we study, we inject a small stream of liquid inbetween two close by, parallel and vertical glass plates (forming a Hele-Shaw cell). Since the liquid we use perfectly wets the glass, it forms a liquid bridge spanning the cell thickness, delimited by two semicircular menisci. Under the influence of gravity, the liquid forms a thin elongated filament along the entire height of the cell, henceforth termed a rivulet.
The gravity-driven vertical base flow displays a Poiseuille velocity profile with zero slip on the bounding glass plates. At low flow rate this base state is stable, and it destabilizes when the flow rate exceeds a critical value
 $Q^*$
(Daerr et al. Reference Daerr, Eggers, Limat and Valade2011). In this study, we will only consider the case
 $Q \lt Q^*$
where the straight rivulet of constant width is linearly stable.
Capillarity acts as a restoring force towards the straight rivulet state, allowing waves to propagate. These small deformations propagate in the reference frame advected downwards at the mean flow speed inside the rivulet
 $u_0$
. Waves on the rivulet are systematically damped by viscosity, which acts on two different level: in the bulk of the rivulet, and near the edges of the menisci when they are displaced. Indeed, moving the rivulet transversally at a finite speed implies displacing the fluid layer of vanishing thickness near the menisci edges, which induces important dissipation.
In order to excite the system, we apply a pressure gradient between the right- and left-hand sides of the cell, generating a transverse force on the rivulet that does not depend on the vertical coordinate. The rivulet responds linearly to this forcing, and displays a pattern-forming instability when the excitation amplitude is above a certain threshold.
The main purpose of this paper is to describe experimentally and explain theoretically the features of this instability, the conditions under which it can develop and the way it saturates. We start in § 2 by explaining our experimental method, we recall the physics ingredients at play and we describe the waves that can propagate on a rivulet. In § 3, we provide a qualitative experimental description of the phenomenon, we show how parametric coupling waves leads to amplification of perturbations and we identify the mathematical resonance condition that selects the pattern. In § 4 we then analyse the pattern growth in detail, calculating the excitation threshold, the relative amplitudes of the interacting waves, the saturation mechanism and the maximum forcing before rivulet breakup. In the conclusive § 5 we revisit experimental observations in the light of our analysis, before providing a brief summary and presenting several promising future research directions.
2. Fluid rivulets
2.1. Experimental set-up
A schematic diagram of the experimental set-up is shown in figure 1. The Hele-Shaw cell consists of two parallel float glass plates of dimensions
 ${1}\,\textrm {m}\times {10}\,\textrm {cm}\times {6}\,\textrm {mm}$
forming an air-filled gap
 $b$
, 0.5–0.6 mm-thick, depending on the experiments. The gap thickness is imposed by mylar polyethylene terephthalate spacers of known thickness. Perfluoropolyether (PFPE) oil is injected locally at the top of the vertically set cell, through a syringe tip fed by a gear pump from the main liquid reservoir. Under the cell, a recovery tank placed on a laboratory scale collects the oil. By reading the weight of the tank as a function of time, we are able to recover the flow rate
 $Q$
that we inject in the cell. The recovery tank is automatically flushed to the main reservoir whenever its weight exceeds a given threshold. On opposite sides of the cell, two loudspeakers (Monacor SP-60/4) are connected to the air gap via adapter plates that seal the speaker front save for a small opening. The speakers are in antiparallel configuration (push–pull), the movement of the membranes being antisymmetric with respect to the cell centreline.
(a) Experimental apparatus (not to scale, schematic view). The measuring scale and the pump are not shown. (b) Typical image, with detection of path and width of the rivulet. The path is defined as the centreline of the bright zone, which corresponds to the interior of the rivulet. The width is the distance between the detected menisci (blue lines in the figure). (c i) Illustration of the fact that light refracted by the menisci does not reach the camera. (c ii) Definition of the cell spacing
 $b$
and rivulet width
 $w$
.

The liquid we used (PFPE oil Galden HT135, density
 $\rho ={1.71}\,\textrm {g}\,\textrm {ml}^{-1}$
, surface tension
 $\gamma = {17}\,\textrm {mN}\,\textrm {m}^{-1}$
, kinematic viscosity
 $\nu = {1}\,\textrm {mm}^{2}\,\textrm {s}^{-1}$
) meets the glass at a vanishing contact angle, measured in a drop spreading experiment to be smaller than 0.5
 $^\circ$
. The oil therefore readily wets both plates of the Hele-Shaw cell, and forms a liquid bridge between them. A centimetre-sized obstacle near the injection point breaks the initial jet, reducing the fluid velocity to near zero independent of the injection diameter, and ensuring wetting. Under the action of gravity, the oil flows around the obstacle and detaches from its lower tip to form a continuous liquid stream spanning the entire cell height (1 m), henceforth termed a rivulet. This thin liquid filament is delimited by two menisci on the sides, between which the falling fluid flows downwards. Near the top of the cell the rivulet thins as the fluid accelerates, and reaches an equilibrium width when friction forces balance gravity. The equilibrium flow speed inside the rivulet is noted
 $u_0 = g /\mu$
, where
 $g$
is the acceleration of gravity, and
 $\mu = 12\,\nu /b^2$
is a friction coefficient which depends on the velocity profile in the rivulet (here a parabolic Poiseuille flow is assumed). The equilibrium flow speed is attained at a distance
 $u_0/\mu = g b^4/(12\nu )^2 \approx {10}\,\textrm {mm}$
from the injection site. All the measurements presented in this study are made below this point, where the rivulet width is assumed to have reached its equilibrium value
 $w_0$
.
The positions of the menisci bordering the rivulet are readily determined experimentally. In order to visualize these borders with high contrast, we position the camera normal to the plates, and a bright back-lighting panel at a distance much larger than the field of view. The light of the light-emitting-diode panel passes through the air and the (transparent) oil, but it is refracted at the menisci. The rivulet borders thus appear black on a bright background on experimental images.
Most of the experimental images are obtained using a gigabit-Ethernet industrial camera (AVT Manta G-223 B, max framerate 400 Hz, full resolution 1024
 $\times$
2088 pixel, i.e. 2 megapixel) controlled by the open-source software Limrendir. When recording periodic phenomena, we use a well-controlled frequency mismatch between the camera frame rate and the excitation period. This technique allows us to visualize the rivulet with high temporal resolution, even when the excitation frequency exceeds the maximum frame rate of the camera. When true high time resolution is needed (i.e. when visualizing non-periodic phenomena), we employ a high-speed camera (Chronos 1.4 8 GB, max. framerate 20 kHz, max. resolution 1080
 $\times$
1920 pixel, i.e. 2 megapixel). For the experiments presented in this paper, we used forcing frequencies between 10 and 2000 Hz. The sampling frequency is always chosen so that we have more than 10 images per forcing period.
The videos acquisitions are exploited using in-house Python routines, which automatically detect the position
 $z(x,t)$
and width
 $w(x,t)$
of the rivulet. The position of the rivulet corresponds to the centreline of the liquid bridge, while its width is defined as the distance between the two menisci. We proceed as follows: (i) the image is filtered (Gaussian smoothing, vignetting correction, contrast optimization by normalization); (ii) for each (horizontal) line of the image, the two local minima of luminosity are associated with the menisci borders, and the zone between these minima is the rivulet interior (the minimum value in this zone is subtracted from the luminosity in the following computations); (iii) we estimate the position of the rivulet by computing the barycentre of the luminosity inside the rivulet, and the width by computing the full-width at half-maximum of the luminosity profile in the rivulet interior. These two quantities, position and width, correspond to different kind of perturbations of the rivulet base state. The reference situation corresponds to a straight rivulet of constant width flowing vertically. A non-zero position corresponds to a transverse perturbation of the rivulet, while a width different from the rest width
 $w_0$
corresponds to a longitudinal perturbation.
2.2. Dynamical equations
In this section we establish the mathematical model we use to describe the evolution of the rivulet. Throughout this study we assume that the rivulets remain slender in the
 $(x,z)$
plane, meaning that their position
 $z$
and width
 $w$
vary on scales that are large compared with the base width
 $w_0$
of the rivulet. Mathematically, this translates as
 $|{\partial _x z}| \ll 1$
and
 $|{\partial _x w}| \ll 1$
.
In order to describe the dynamics of the system we start from first principles, i.e. the Navier–Stokes equations. We perform a depth-averaging (along the
 $y$
direction, normal to the plates), assuming a parabolic profile (corresponding to a Poiseuille flow) for the velocity. This laminar flow hypothesis is largely relevant, as the typical Reynolds number associated with the flow inside the rivulet is of order
 $b u_0 / \nu \approx 150$
. We then integrate the result along the direction transverse to the rivulet path. After dividing by the liquid density
 $\rho$
, we obtain the following equations for the depth-averaged fluid velocity
 $\boldsymbol {u}={u}\,\boldsymbol {e}_x + {v}\,\boldsymbol {e}_z$
:
 \begin{align} w\,(\partial _t + \beta \boldsymbol {u}\boldsymbol{\cdot }\boldsymbol{\nabla }) \boldsymbol {u} =& w\,\boldsymbol {g} - w\,\mu \,\boldsymbol {u} + w\,\varGamma \,\boldsymbol{\nabla }\kappa _w + (\varGamma \,\kappa _z - {\mu _{{cl}}}\,\boldsymbol {u}\boldsymbol{\cdot }\boldsymbol {n} + \varPi )\,\boldsymbol {n},\end{align}
where
 $\boldsymbol {n}$
is a unit vector normal to the rivulet path
 $z(x,t)$
. We also take into account mass conservation,
 \begin{align} (\partial _t + \boldsymbol {u}\boldsymbol{\cdot }&\boldsymbol{\nabla }) w = -w\,\boldsymbol{\nabla } \boldsymbol{\cdot }\boldsymbol {u}, \end{align}
where
 $w(x,t)$
is the width of the rivulet. The system is closed using the kinematic boundary condition
 ${v} = (\partial _t + \boldsymbol {u}\boldsymbol{\cdot }\boldsymbol{\nabla })z$
.
The dynamical (2.1) represent the competition between several physical effects: inertia, gravity, internal friction, streamwise pressure gradients inside the rivulet and transverse pressure forces.
The leftmost, inertial term features the numerical prefactor
 $\beta \simeq 1$
accounting for the velocity’s
 $y$
-profile. As in Gondret & Rabaud (Reference Gondret and Rabaud1997), we set this prefactor to unity in the following, as it has only minor effects. The internal friction term originates from the viscosity of the fluid and is given by Darcy’s law, with
 $\mu = 12\,\nu /b^2$
(assuming a parabolic velocity profile). The streamwise pressure gradient term is due to inhomogeneities of Laplace pressure along the path of the rivulet when its width is uneven. It acts as a restoring force towards the constant-width situation. This mechanism is at the origin of the propagation of longitudinal capillary waves along the rivulet, as discussed in the next section. Here
 $\varGamma = \pi \,\gamma /(2\,\rho )$
, incorporating the
 $\pi /4$
corrective factor from Park & Homsy (Reference Park and Homsy1984); and
 $\kappa _w$
is the curvature of the width profile of the rivulet
 $w(x,t)$
(at first approximation,
 $\kappa _w \approx \partial _{xx}w$
).
The transverse pressure forces normal to the interface are directed along
 $\boldsymbol {n}$
. There are three distinct mechanisms which generate a pressure gradient transverse to the rivulet.
-
(i) The first contribution is the Laplace pressure due to the effective curvature of the path
 $\kappa _z \approx \partial _{xx}z$
. Indeed, when the rivulet is curved, a restoring force acts to straighten it back. This force originates in the change of Laplace pressure due to the deformation of the menisci caused by the curvature of the rivulet path (Park & Homsy Reference Park and Homsy1984). This mechanism is at the origin of the propagation of transverse capillary waves along the rivulet, as discussed in the next section.
-
(ii) The second contribution corresponds to the stress due to the important dissipation at the moving contact line. This term translates the fact that moving the rivulet in the direction normal to its path is energetically costly, since it involves the displacement of a vanishingly thin film on the meniscus border. The additional dissipation associated with transverse movement depends notably on the height of the film already present on the glass plates ahead of the moving meniscus. This film being the result of previous wetting events, rigorously, its local height depends the history of rivulet movement. We make the simplifying assumption that the rivulet is sliding on a film of constant effective thickness, neglecting potential spatial or temporal variations of the contact line friction coefficient
$\mu _{{cl}}$
. The effective depth
$h$
is estimated to be approximately several micrometres, in accordance with recent measurements on this system (Le Lay & Daerr Reference Le Lay and Daerr2025a
). -
(iii) Last, the
$\varPi$
term corresponds to the transverse force induced by a pressure difference
$\pm ( 1/2 )\rho \varPi$
between the two halves of the cell separated by the rivulet. The rivulet acts as a membrane separating the left- and right-hand sides of the cell in an airtight manner: this means it is sensitive to pressure differences between the air masses on its right- and left-hand sides. Such a pressure difference drives the rivulet transversally. Using loudspeakers at the side of the cell, we are able to impose an arbitrary pressure difference
$\varPi (t) \neq 0$
.


2.3. Wave propagation on rivulets
In the absence of forcing, the rivulet is in its base state, corresponding to a straight downwards flowing filament of constant width:
 $z = z_0 = 0$
,
 $w = w_0$
and
 $\boldsymbol {u} = u_0\,\boldsymbol {e}_x$
with
 $u_0 =g/\mu$
. Let us now consider a perturbation to this state, and see how it evolves.
We introduce a small non-dimensional number
 ${{\epsilon }} \ll 1$
in the problem, so that we can develop all the dynamic variables in successive powers of this small parameter, in the fashion
 $a = a_0 + {{\epsilon }} a_1 + {{\epsilon }}^{2}a_2 \ldots$
for
 $a=z, w, {u}, {v},\ldots$
. The perturbation amplitude of the midsurface position, for example, is then
 ${{\epsilon }} z_1$
, and the fact that
 ${{\epsilon }} \ll 1$
implies that this perturbation amplitude is small compared with the typical wavelength
 $\lambda$
of the perturbation.
Moreover, in the following we make the assumption of low damping, that is of small
 $\mu$
and
 $\mu _{{cl}}$
of order
 ${{\epsilon }}^2$
. This assumption allows us to focus on the undamped propagation and interaction of waves. Since
 ${{\epsilon }} \ll 1$
, this means that we are considering phenomena with typical frequencies
 $\omega$
that are very large compared with the damping frequencies
 $\mu$
and
 ${\mu _{{cl}}}/w_0$
. Note that despite the small damping assumption, we still consider the base flow speed
 $u_0$
to be of order unity.
The linear (first order in
 ${\epsilon }$
) approximation of the main (2.1) and (2.2) reads
 \begin{align} w_0(\partial _t + u_0\partial _x) {v}_1 =& \varGamma \, \partial _{xx}z_1 , \\[-9pt] \nonumber \end{align}
 \begin{align} w_0(\partial _t + u_0\partial _x) {u}_1 =& w_0\,\varGamma \,\partial _{xxx}w_1, \\[-9pt] \nonumber \end{align}
 \begin{align} (\partial _t + u_0\partial _x) w_1 =& -w_0 \partial _x {u}_1 . \\[9pt] \nonumber \end{align}
Using the kinematic condition
 ${v}_1 = (\partial _t + u_0\partial _x)z_1$
to eliminate
 ${v}_1$
, this system can be recast in terms of two linear evolution operators
 ${\mathcal{L}_z}$
and
 ${\mathcal{L}_w}$
,
 \begin{align} 0 &= \big((\partial _t + u_0\partial _x)^2 - {v_{{c}}}^2 \partial _{xx} \big) z_1 =: {{\mathcal{L}_z}} z_1 ,\\[-9pt] \nonumber \end{align}
 \begin{align} 0 &= \big( (\partial _t + u_0\partial _x)^2 + {v_{{c}}}^2 {w_0}^2 \partial _{xxxx} \big)w_1 =: {{\mathcal{L}_w}} w_1, \\[9pt] \nonumber \end{align}
where we introduced the capillary velocity
 ${v_{{c}}} = \sqrt {\varGamma /w_0}$
. This velocity can be interpreted as the displacement speed of purely capillary transverse deformations along the rivulet at rest. It corresponds to the phase speed of the sinuous waves in the reference frame of the falling liquid.
The propagation operators
 ${\mathcal{L}_z}$
and
 ${\mathcal{L}_w}$
correspond to two distinct types of waves that can exist on the surface of the rivulet. These waves are linearly independent of one another. The
 $z$
-waves correspond to transverse waves, i.e. deformations of the path followed by the rivulet. The
 $w$
-waves correspond to longitudinal waves, i.e. modulations of the rivulet width. These waves are also referred to as sinuous and varicose modes in the literature.
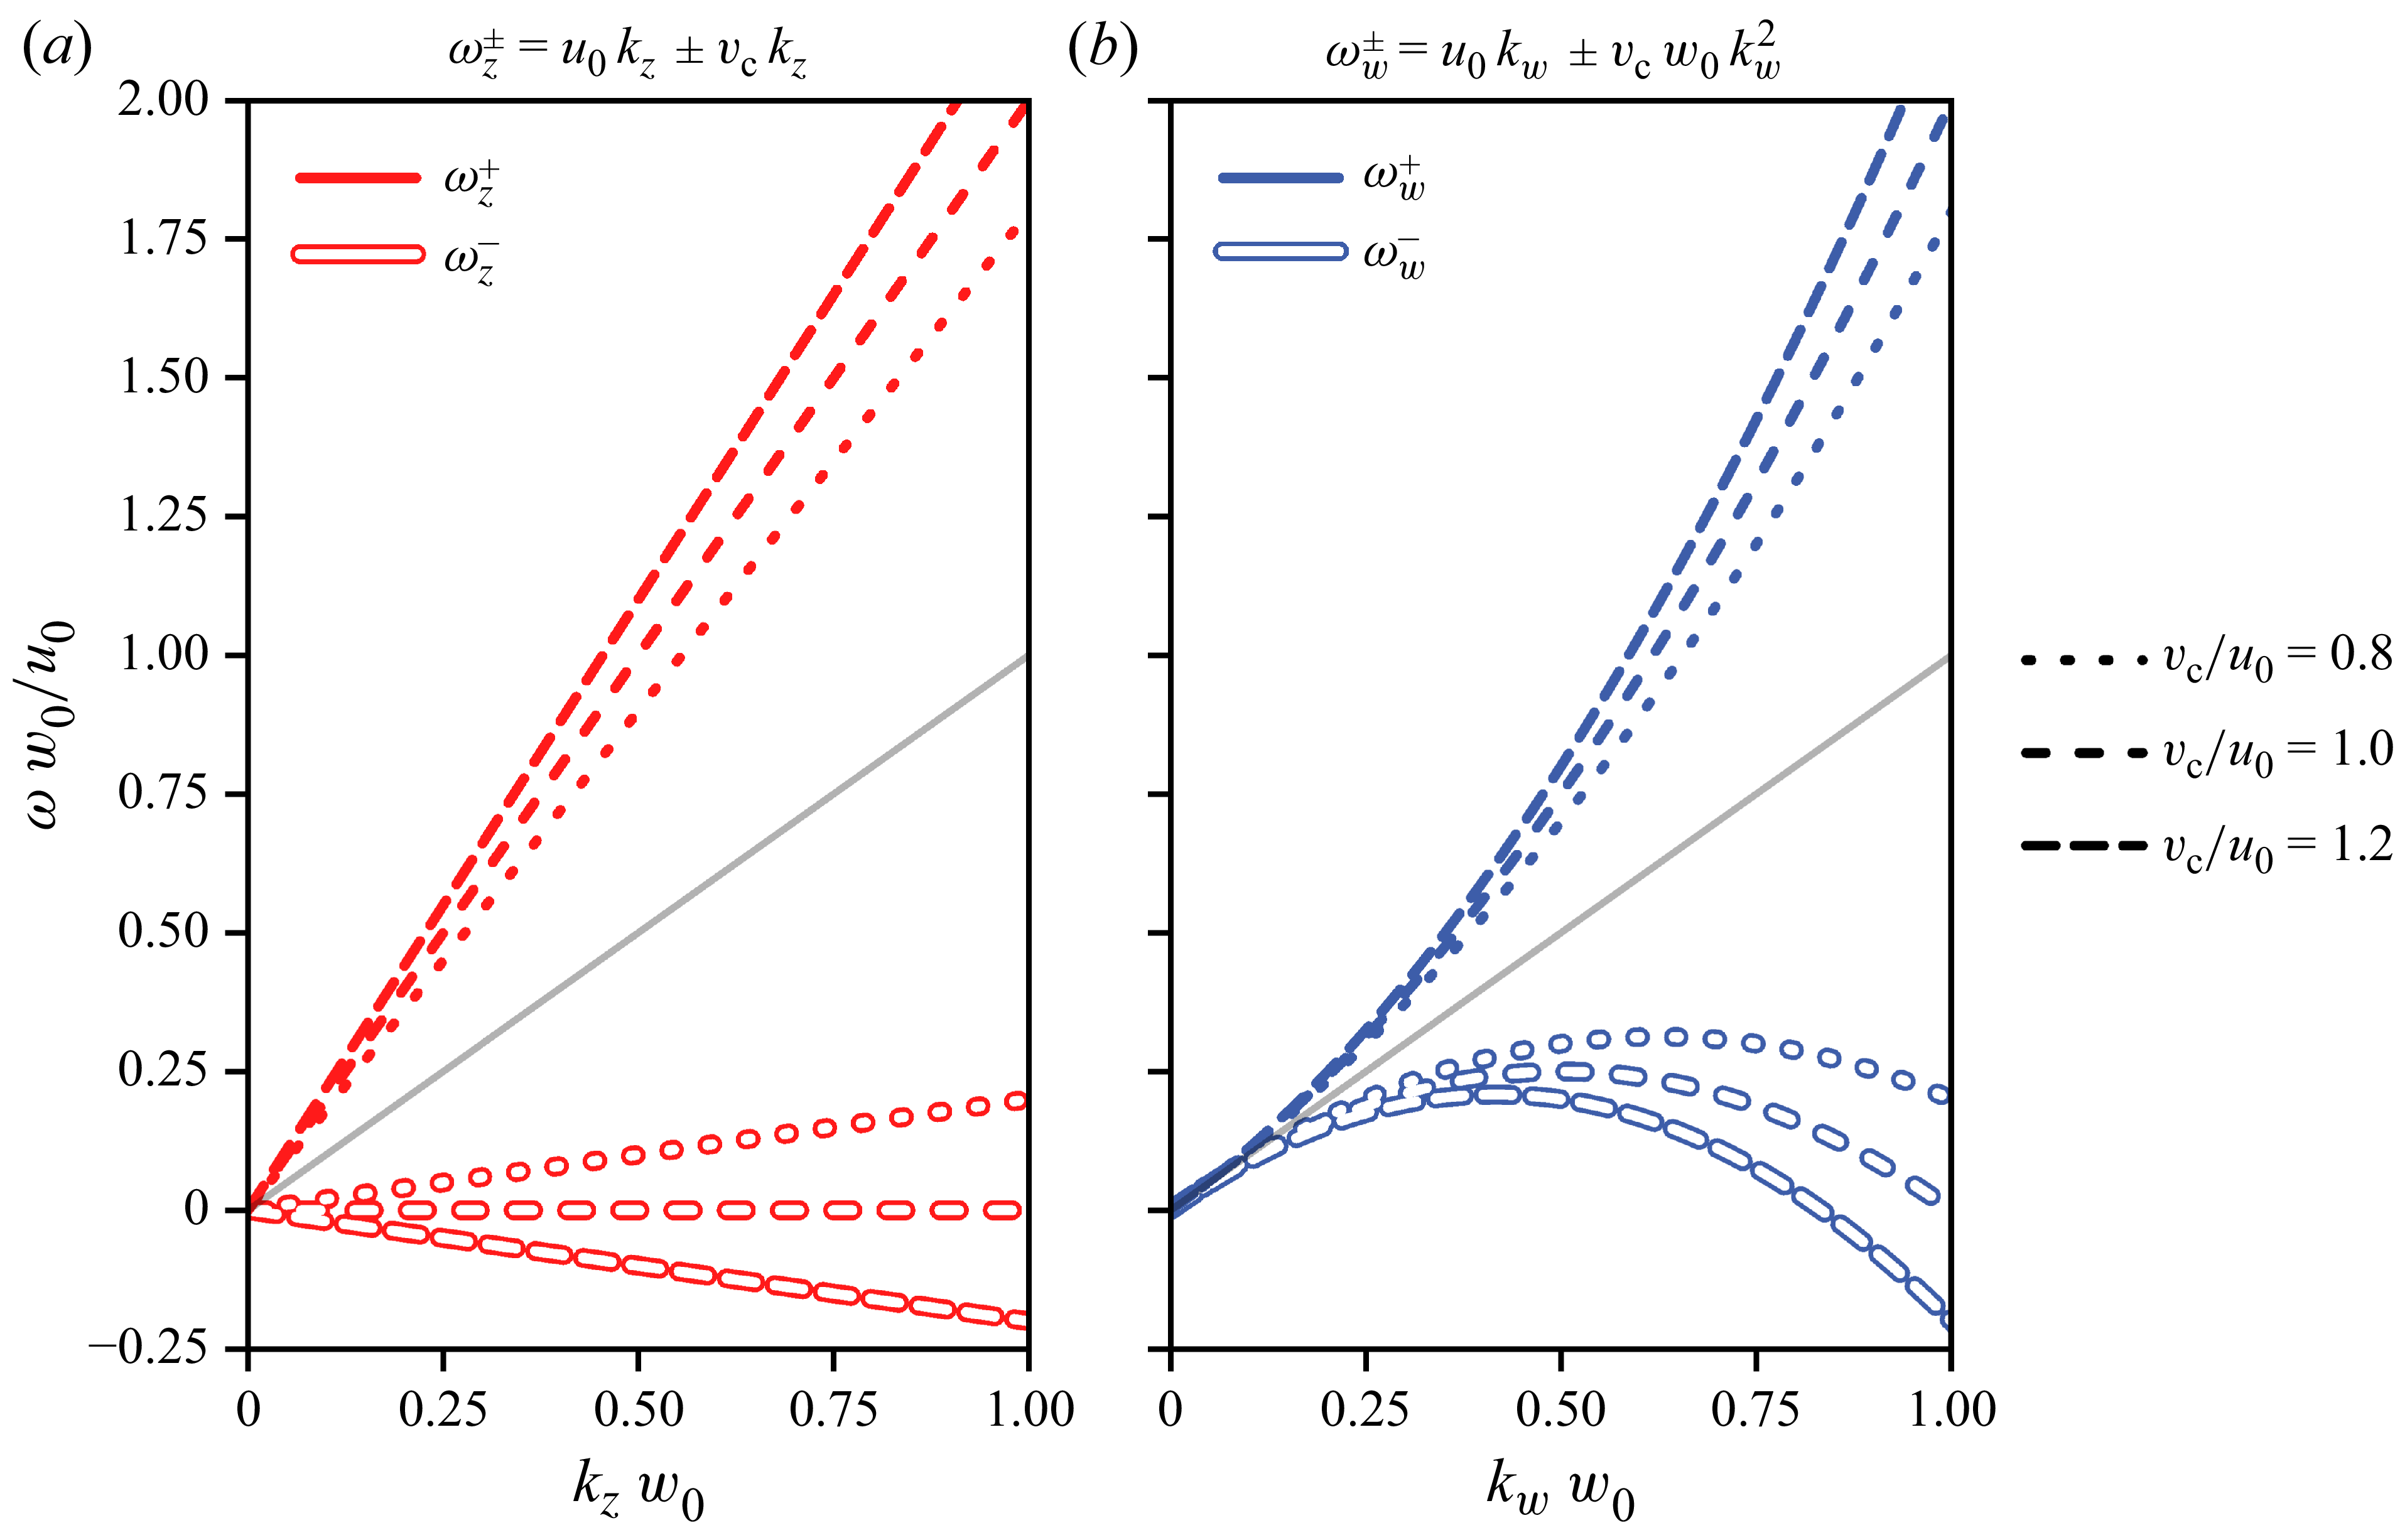
Each type of wave supports two modes, corresponding to the dispersion relations
 \begin{align} \omega _{z}^{\pm } &= (u_0 \pm {v_{{c}}}) k_z ,\\[-9pt] \nonumber \end{align}
 \begin{align} \omega _{w}^{\pm } &= u_0 k_w \pm {v_{{c}}} w_0 {k_w}^2 , \\[9pt] \nonumber\end{align}
which are plotted on figure 2.
Dispersion relations of transverse (a) and longitudinal waves (b), in the absence of damping. The axis is made dimensionless through appropriate scaling. The horizontal axes correspond to the dimensionless wavevector amplitude
 $k\, w_0$
, while vertical axes correspond to the dimensionless angular frequency
 $\omega \, w_0/u_0$
. The grey lines correspond to pure advection
 $\omega = k\, u_0$
.

The transverse waves propagate non-dispersively, while the dispersion relation of the longitudinal waves display a quadratic term. For both waves, two branches coexist: one fast branch for which the phase speed in the laboratory reference frame is faster than the flowing speed
 $u_0$
; and one slow branch which displays phase speeds in the laboratory reference frame inferior to
 $u_0$
(and which can be negative). These branches correspond, respectively, to positive (for fast waves) or negative (for slow waves) phase speed in the reference frame advected with the flow speed
 $u_0$
.
3. Instability mechanism
In the absence of forcing, the rivulet flows straight down, vertically, and since the flow rate is always under the spontaneous meandering threshold
 $Q^*$
, one observes that this base state is very robust. This is because both transverse and longitudinal waves are linearly damped (as can be seen when looking at the dynamical equations presented on § 3.3 and onwards). Experimentally, if a perturbation of any kind is imposed on the rivulet, its amplitude is observed to decrease exponentially within a short time scale (
 $\lt {100}\,\textrm {ms}$
) and over a short spatial distance (
 $\lt {3}\,\textrm {cm}$
).
However, while both transverse and longitudinal waves are linearly attenuated, we discovered recently (Le Lay & Daerr Reference Le Lay and Daerr2025b ) that when a homogeneous, harmonic, acoustic forcing is applied, the base state becomes unstable and the rivulet exhibits a distinct pattern combining both types of waves. The birth of this pattern can be observed on Supplementary movie SM2. The main features of this pattern are that while transverse and longitudinal perturbations travel at different speed, they both share a common spatial wavelength. This should come as a surprise, as since the excitation is homogeneous, no length scale is forced onto the system. The origin of the wavelength, which depends on the excitation frequency, as can be seen on Supplementary movie SM1, must thus be dynamical. If the forcing is turned off, both perturbations decay quickly, as can be seen on Supplementary movie SM3, confirming that both types of waves are attenuated in the absence of forcing.
The main purpose of this paper is to explain the features of this instability, the conditions under which it can develop and how it saturates. Let us start by qualitatively describing the phenomenon, by showing how parametric coupling between longitudinal and transverse waves leads to amplification of perturbations, and by identifying the resonance condition that selects the pattern.
3.1. A pattern-forming instability
Consider the rivulet at rest in the vertical base state. Let us now impose an additive forcing which is homogeneous in space and harmonic in time. If the forcing exceeds a certain threshold, which depends on its frequency, a pattern starts to appear.
The speakers are driven in an antisymmetric configuration, so when one pushes its diaphragm out, the other pulls it in. This creates a pressure difference between both sides of the rivulet, displacing the liquid in the transverse direction. The rivulet thus behaves as a membrane, separating the cell into two airtight compartments. Note that since the speakers are not of infinite size, the forcing is not perfectly homogeneous: it is maximal on the midline joining the two speakers and slowly decreases away from it. All the measurements presented here are made on a 10 cm zone around this midline, where we checked that the forcing inhomogeneities never exceed
 ${10}{\,\%}$
.
The forcing of the rivulet by the pressure difference between its two sides is represented mathematically by the rightmost term in (2.1). This forcing is additive, meaning it induces a linear response from the rivulet. Thus, since the forcing oscillates harmonically in time at angular frequency
 $\omega _0$
, the rivulet adopts a movement that is homogeneous in space, and harmonic in time at angular frequency
 $\omega _0$
. This linear response is always visible on the experimental signal. Below the instability threshold, it is the only measurable evolution of
 $z(x, t)$
, but even when the instability develops, this response can still be seen by looking at
 $\langle {z}\rangle _x(t)$
, the space-averaged value of
 $z$
(see figure 3
a).
Spatiotemporal representation of the experimental position
 $z(x,t)$
of the rivulet as a function of time and space. Cell gap
 $b={(0.58 \pm 0.02)}\,\textrm {mm}$
, flow rate
 $Q={(25.6 \pm 0.9)}\,\textrm {mm}^{3}\,\textrm {s}^{- 1}$
, excitation frequency
 $\omega _0/(2\pi )={40}\,\textrm {Hz}$
. (b) Position
 $z$
of the rivulet (colour scale) as a function of time
 $t$
and position
 $x$
. Darker regions delimited by plain lines correspond to the parts where the rivulet is the heaviest, while lighter regions delimited by dashed lines correspond to parts where the rivulet is the thinnest (see figure 4). (c) Time-averaged position (over 60 ms) of the rivulet as a function of space. Labelled ticks are spaced by
 $\lambda =2\pi /k = {6.74}\,\textrm {mm}$
. (a) Spaced-averaged position (over 17 mm) of the rivulet as a function of time. Labelled ticks are spaced by
 $2\pi /\omega _0 = {25.0}\,\textrm {ms}$
.

Above the instability threshold, the rivulet adopts a pattern composed of both transverse and longitudinal perturbations. As can be seen on figure 3(c), in addition to the time-dependent response to forcing the rivulet exhibits space-dependent transverse oscillations. The spatiotemporal transverse signal
 $z(x,t)$
is a combination of these two contributions. The rivulet also shows longitudinal oscillations, which as can be seen on figure 4 are a function of
 $x - v_w t$
, where
 $v_w = \omega _w^+ / k_w = u_0 + {v_{{c}}} w_0 k_w$
is the phase speed of longitudinal waves predicted by the dispersion relation (2.5b
). The observation of this pattern poses several questions, which motivate the present study. Let us highlight here some surprising key features of the experimental pattern we report, that will be explained theoretically in the following. The first and most obvious feature of the pattern is that, as can be seen for example on figure 3, both
 $z$
and
 $w$
share the same spatial periodicity. While this indicates that the two waves are probably coupled, the nature of such a coupling is not clear a priori. Second, the phase between the transverse and longitudinal patterns is deterministic (figure 3
b), which calls for an explanation. Third, the saturation amplitude of the patterns in
 $z$
and
 $w$
is unexplained, as is the ratio between these different perturbation – rephrased: Why are the transverse variations of greater amplitude than the longitudinal changes?
Spatiotemporal representation of the experimental width
 $w(x,t)$
of the rivulet as a function of time and space. Cell gap
 $b={(0.58 \pm 0.02)}\,\textrm {mm}$
, flow rate
 $Q={(25.6 \pm 0.9)}\,\textrm {mm}^{3}\,\textrm {s}^{- 1}$
, excitation frequency
 $\omega _0/(2\pi )={40}\,\textrm {Hz}$
. (a) Width
 $w$
of the rivulet (colour scale) as a function of time
 $t$
and position
 $x$
. (b) Width of the rivulet interpolated along the plain black line represented on (a). The plain and dashed lines correspond to the width delimiting the darker and lighter regions on figure 3, respectively. The abscissa corresponds to a counter-advected position
 $x - v_w t$
, with
 $v_w={0}\,\textrm {mm}\,\textrm {s}^{- 1}$
the phase speed of longitudinal waves. Labelled ticks are spaced by
 $\sqrt {\lambda ^2 + (v_w T_0)^2}$
.

3.2. Mathematical formulation
In order to understand the instability and the pattern it generates, we write a nonlinear development of equations of (2.1) and (2.2), following a multiple scale approach (Nayfeh Reference Nayfeh2008; Bongarzone et al. Reference Bongarzone, Viola, Camarri and Gallaire2022). We will be using a slow time scale
 ${{ \tilde T }} = t /{{\epsilon }}^2$
, with
 ${{\epsilon }} \ll 1$
the small parameter introduced in the previous section. We also consider the case of weak forcing, that is to say we take the pressure difference imposed by the speakers
 $\varPi (t)$
to be of order
 ${{\epsilon }}^2$
.
At order
 ${\epsilon }$
, the equations read
 \begin{align} {{\mathcal{L}_z}} z_1 &= 0 , \\[-9pt] \nonumber \end{align}
 \begin{align} {{\mathcal{L}_w}} w_1 & = 0, \\[9pt] \nonumber \end{align}
i.e. at leading order
 $z(x,t) = {{\epsilon }} {{ \tilde Z }} e^{i(\omega _z t - k_z x)} + {\text{c.c.}}$
and
 $w(x,t) = {{\epsilon }} {{ \tilde W }} e^{i(\omega _w t - k_w x)} + {\text{c.c.}}$
, where
 $\text{c.c.}$
stands for complex conjugate, with
 $(\omega _z, k_z)$
satisfying the transverse waves dispersion relation (2.5a
) and
 $(\omega _w, k_w)$
satisfying the longitudinal waves dispersion relation (2.5b
).
At second order in
 ${\epsilon }$
, the equations read
 \begin{align} w_0 {{\mathcal{L}_z}} z_2 & = {{\mathcal{N}_{z}}} (z_1, w_1, u_1) + \varPi (t), \\[-9pt] \nonumber \end{align}
 \begin{align} {{\mathcal{L}_w}} w_2 & ={{\mathcal{N}_{w}}} (z_1, w_1, u_1), \\[9pt] \nonumber\end{align}
where
 ${{\mathcal{N}_{z}}} (z_1, w_1, u_1)$
and
 ${{\mathcal{N}_{w}}} (z_1, w_1, u_1)$
are quadratic nonlinear functions, the expression of which is given in Appendix A.2; and
 $\varPi (t) = \tilde {\varPi } e^{i\omega _0 t} + {\text{c.c.}}$
is the externally imposed pressure oscillation, homogeneous in space and harmonic in time, of amplitude
 $\tilde {\varPi }$
. The nonlinear terms
 ${{\mathcal{N}_{z}}} (z_1, w_1, u_1)$
and
 ${{\mathcal{N}_{w}}} (z_1, w_1, u_1)$
contain no contributions able to resonate with
 $z_1$
and
 $w_1$
. This can be seen by looking directly at the expressions or by considering symmetry arguments. Equation (3.2) thus reduce to
 \begin{align} -w_0 {\omega _0}^2 z_2 &= \tilde {\varPi } e^{i\omega _0 t} + {\text{c.c.}}, \\[-9pt] \nonumber \end{align}
 \begin{align} w_2 &= 0, \\[9pt] \nonumber\end{align}
the forcing only adds an additive contribution to the transverse pattern,
 \begin{align} z(x,t) = {{\epsilon }} {{ \tilde Z }} e^{i(\omega _z t - k_z x)} + {{\epsilon }}^2 {{ \tilde F }} e^{ i(\omega _0 t - 0x)}+ {\text{c.c.}} \,\, \text{and}\,\,\, w(x,t) = {{\epsilon }} {{ \tilde W }} e^{i(\omega _w t - k_w x)} + {\text{c.c.}} \end{align}
The term proportional to
 ${{\epsilon }}^2 {{ \tilde F }}$
on the expression of
 $z(x,t)$
corresponds to the linear response to the forcing. The expression of the operator
 ${\mathcal{L}_z}$
allows us to write an explicit expression for
 ${ \tilde F }$
, defined as
 ${{ \tilde F }} := - \tilde {\varPi } / (w_0\,{\omega _0}^2)$
.
At third order in
 ${\epsilon }$
, elimination of the resonant terms leads to the following amplitude equations:
 \begin{align} 2\partial _{{ \tilde T }} {{ \tilde Z }} =& -\mu \left ( 1 + \varepsilon _z \frac {{\mu _{{cl}}}}{w_0 \mu } (1 + \varepsilon _z )\right ) {{ \tilde Z }} - i \varepsilon _z \frac {{\omega _0}^2}{w_0 u_0 k_w} {{ {{{ \tilde F }}}^* }} {{ \tilde W }} \nonumber \\ & + 7 i {k}^3 u_0 |{ \tilde Z }|^2 {{ \tilde Z }} + i {k}^3 u_0 \left (- \varepsilon _z \frac 54 + \frac {4 \varepsilon _w}{kw_0}\right ) |{ \tilde W }|^2 {{ \tilde Z }} , \\[-9pt] \nonumber\end{align}
 \begin{align} 2\partial _{{ \tilde T }} {{ \tilde W }} =& - \mu {{ \tilde W }} - i \varepsilon _w k_w \omega _0 \left ( \frac {{\omega _0}}{k_w {v_{{c}}}} -\varepsilon _w w_0 k_z \right ) {{ \tilde F }} {{ \tilde Z }} \nonumber \\ & -2 i \varepsilon _w w_0 {k_w}^2 {v_{{c}}} |{k_z{{ \tilde Z }}}|^2 {{ \tilde W }} + i \left ( k_w\frac {u_0}{{w_0}^2} -\varepsilon _w \frac 32 w_0 {v_{{c}}} {k_w}^4 \right ) {|{{ \tilde W }}|}^2 {{ \tilde W }}, \\[12pt] \nonumber \end{align}
where
 ${ {A}^* }$
denotes the complex conjugates of
 $A$
and
 $\varepsilon _{z,w}$
are each to be replaced by
 $+1$
or
 $-1$
, depending on the chosen propagation dispersion (
 $\varepsilon _w = \pm 1$
for
 $\omega _w^\pm$
, and similarly for
 $\varepsilon _z$
). The main steps allowing the derivation of (3.5) are shown in Appendix A.3. For the equations presented in the made text we made the simplifying assumption
 ${v_{{c}}} \approx u_0$
, the full expression of
 $\partial _{{ \tilde T }} {{ \tilde Z }}$
and
 $\partial _{{ \tilde T }} {{ \tilde W }}$
in the general case is presented in Appendix A.3. Let us now try to get a physical understanding of these equations. The right-hand side comprises three kinds of terms: dissipative linear damping, nonlinear cross-coupling and third-order nonlinearities, in this order.
For longitudinal waves the linear damping is always the same, while for transverse waves the damping depends on the branch considered. When
 $\varepsilon _z = -1$
(
 $\omega _z^-$
branch) the multiplicative coefficient for the linear term is
 $-\mu$
, but the
 $\varepsilon = +1$
(
 $\omega _z^+$
branch) is subject to a much more important attenuation, with a coefficient
 $-\mu (1 + 2{\mu _{{cl}}}/(w_0\,\mu ))$
. Indeed, since the rivulet is thin, the dissipation due to transverse menisci displacement dominates the bulk dissipation:
 ${\mu _{{cl}}} \gg w_0 \mu$
, meaning that the
 $\omega _z^+$
branch is strongly damped. Let us physically explain this dependence of dissipation with the phase velocity.
In general, since the rivulet is thin, the dissipation due to the displacement of the transverse menisci dominates the dissipation in the volume:
 ${\mu _{{cl}}} \gg w_0 \mu$
, the main part of the energy loss comes from the ‘friction’ of the menisci on the glass plates that delimit the cell. A wave on the
 $\omega _z^-$
branch moves at the velocity
 $u_0 - {v_{{c}}}$
in the laboratory frame, thus with respect to the plates. This velocity is very small (compared with
 $u_0$
or
 $v_{{c}}$
, which are of the same order of magnitude), so the menisci are almost motionless with respect to the plates and therefore generate very little friction. On the contrary, if we consider a wave on the
 $\omega _z^+$
branch, the rivulet slides on the plates at the velocity
 $u_0+{v_{{c}}}$
in the laboratory frame, and the menisci are displaced rapidly with respect to the plates, which is energetically costly. The
 $\omega _z^+$
branch is therefore strongly damped: this is consistent with the fact that transverse waves
 $\omega _z^+$
are never observed experimentally. For the following we will thus only consider the case
 $\varepsilon _z = -1$
. The fact that the damping then becomes exactly the same for transverse and longitudinal waves is a consequence of the simplifying
 ${v_{{c}}} \approx u_0$
assumption.
The most interesting parts of (3.5) are undoubtedly the cross-coupling terms, which imply an interaction between transverse and longitudinal waves. The sign of each nonlinear coupling term is critical for the amplification mechanism, and it can only be obtained through a careful derivation of the third-order equations. As we will show rigorously in § 4.2, the interaction of transverse and longitudinal waves is only constructive if the product of both coupling terms is of positive sign, in the opposite case the interaction only leads to increased damping for both waves. In order to observe an instability, we must thus have
 $(-i \varepsilon _z)(- i \varepsilon _w) = +1$
(assuming
 $\omega _0 \gg {v_{{c}}} w_0 k^2$
, which is always verified in the accessible experimental range). Since
 $\varepsilon _z = -1$
, this forces
 $\varepsilon _w = +1$
to be the branch amplified by the instability.
Looking at figure 3, one can confirm that the prediction
 $(\varepsilon _z, \varepsilon _w) = (-1, +1)$
is well verified experimentally: we can see that
 $\omega _w \gt \omega _z$
, with
 $v_z = \omega _z/k_z \approx 0$
.
Note that the form of the coupling term is a signature that the instability is indeed parametric, as the forcing response
 ${ \tilde F }$
acts as a multiplicative parameter coupling the two waves together. The fact that the linear response to an additive forcing intervenes multiplicatively in the amplitude equations participates in the instability originality. This coupling between two waves mediated by a forcing is analogous to the cross-coupling between progressive and regressive waves in the Faraday instability in an annulus (Douady et al. Reference Douady, Fauve and Thual1989).
The rightmost terms of the (3.5) are nonlinear detuning terms. Indeed in the absence of nonlinear damping, these terms are associated with a purely imaginary prefactor, translating the fact that as the amplitudes of the waves grow, their frequencies shift accordingly. These detuning terms are often responsible for the nonlinear saturation of parametric instabilities, because they shift the oscillation frequency away from resonance.
To conclude this section, note that the general form of (3.5) could have been guessed by using only symmetry arguments. If one assumes that the evolution equations for
 ${ \tilde Z }$
and
 ${ \tilde W }$
contain only third-order terms proportional to
 ${ \tilde Z }$
,
 ${ \tilde W }$
,
 ${ \tilde F }$
and their complex conjugates, then necessarily such terms must be compatible with the invariances and symmetries of the problem.
Let us consider the time translation invariance of the problem, i.e. the fact that the equations should not change when the transformation
 $t\rightarrow t + t_0$
is applied. This transformation corresponds, in terms of our variables, to the phase shift
 ${{ \tilde Z }}, {{ \tilde W }}, {{ \tilde F }} \rightarrow {{ \tilde Z }} e^{i\phi }, {{ \tilde W }} e^{i\phi + i\psi }, {{ \tilde F }} e^{i\psi }$
with
 $\phi = \omega _z t_0$
and
 $\psi = \omega _0 t_0$
. The third-order evolution equations, in order to be invariant under this transformation, must then have the following form:
 \begin{align} \partial _{{{ \tilde T }}}{{ \tilde Z }} = a \mu {{ \tilde Z }} + b {{ {{{ \tilde F }}}^* }} {{ \tilde W }} + c {{ \tilde Z }}^2 {{ {{{ \tilde Z }}}^* }} + d {{ \tilde W }} {{ {{{ \tilde W }}}^* }}{{ \tilde Z }}, \\[-9pt] \nonumber \end{align}
 \begin{align} \partial _{{{ \tilde T }}}{{ \tilde W }} = a' \mu {{ \tilde W }} + b' {{ \tilde F }} {{ \tilde Z }} + c' {{ \tilde Z }}{{ {{{ \tilde Z }}}^* }}{{ \tilde W }} + d' {{ \tilde W }}^2 {{ {{{ \tilde W }}}^* }}, \\[9pt] \nonumber \end{align}
which is indeed the same form as (3.5).
Finally, the space–time reversal symmetry
 $x, t\rightarrow -x, -t$
, imposes the phase (the real or imaginary character) of the prefactors
 $a,b, c, d, a', b', c'$
and
 $d'$
, since it corresponds to the transformation
 ${{ \tilde Z }}, {{ \tilde W }}, {{ \tilde F }} \rightarrow {{ {{{ \tilde Z }}}^* }}, {{ {{{ \tilde W }}}^* }}, {{ {{{ \tilde F }}}^* }}$
and
 $\mu \rightarrow -\mu$
.
3.3. Resonance condition
Since (3.5) result from the elimination of secular terms, one can see that the cross-coupling terms can only be taken into account if a certain resonance condition is met. Indeed, for the coupling term
 ${{ \tilde F }} e^{ i(\omega _0 t - 0x)} {{ \tilde Z }} e^{i(\omega _z t - k_z x)} = {{ \tilde F }} {{ \tilde Z }} e^{i((\omega _z + \omega _0)) t - (k_z+0) x)}$
to interact with the longitudinal wave
 ${{ \tilde W }} e^{i(\omega _w t - k_w x)}$
, both terms must oscillate at the same (spatial and temporal) frequency. The resonance, or frequency-matching condition, translates to the fact that the interaction between the waves have to be resonant for them to exchange energy and potentially amplify one another.
This behaviour is analogous to a three-wave resonant interaction, where an algebraic relationship must be satisfied between the waves for the triadic interaction to take place (Simmons Reference Simmons1969; Martin, Simmons & Wunsch Reference Martin, Simmons and Wunsch1972; Phillips Reference Phillips1981; Hammack & Henderson Reference Hammack and Henderson1993). It is this mechanism which is responsible, for example, for pattern generation due to nonlinear interaction between gravitocapillary surface waves (Mcgoldrick Reference Mcgoldrick1965; Moisy et al. Reference Moisy, Michon, Rabaud and Sultan2012; Haudin et al. Reference Haudin, Cazaubiel, Deike, Jamin, Falcon and Berhanu2016). Here the waves are a transverse wave, a longitudinal wave and the
 ${{ \tilde F }} e^{i\omega _0 t} + {\text{c.c.}}$
contribution to
 $z(x,t)$
(linear response to forcing), which can be thought of as a zero-wavenumber transverse wave.
The resonance condition thus mathematically reads
 \begin{align} \omega _w&-\omega _z = \pm \omega _0, \\[-9pt] \nonumber\end{align}
 \begin{align} k_w&-k_z=\pm 0, \\[9pt] \nonumber\end{align}
since both temporal and spatial frequencies must match for resonance to take place. Equation (3.7a
,
b
) impose a necessary condition to the existence of the cross-coupling term, and thus of the instability. They have straightforward implications for the pattern features. Equation (3.7b
) provides a theoretical explanation for the fact that both transverse and longitudinal waves share the same wavenumber, and thus the same spatial wavelength. Equation (3.7a
) predicts a deterministic relation between the different frequencies. The quantity
 $\omega _w - \omega _z$
can take two values, depending on the value of the product
 $\varepsilon _-\varepsilon _+$
. The result is plotted on figure 5. They show an excellent agreement with our prediction, that the excited modes are the
 $\omega _w^+, \omega _z^-$
modes.
Relationship between
 $k$
and
 $\omega _0$
. Symbols correspond to experimental measurements of the wavenumber
 $k$
(which is the same for transverse and longitudinal waves). Experiments done with cell gap
 $b={0.6}\,\textrm {mm}$
and flow rate
 $Q={(26 \pm 1)}\,\textrm {mm}^{3}\,\textrm {s}^{- 1}$
. Lines correspond to
 $|{\omega _w^+ - \omega _z^-}| = k{v_{{c}}} (1 + k w_0)$
, i.e.
 $\varepsilon _z\varepsilon _w = -1$
(purple) and
 $|{\omega _w^- - \omega _z^-}| = k{v_{{c}}} |{1 - k w_0}|$
, i.e.
 $\varepsilon _z\varepsilon _w = +1$
(ochre). The line curves are computed without fitting, using the experimental values of the parameters. The theoretical prediction corresponds to the modes
 $\omega _w^+, \omega _z^-$
being unstable (purple curve). Note that the experimental points often fall slightly to the right of the curve, i.e. the wavevectors
 $k$
are larger than expected: this is because the points were recorded at a finite amplitude for which nonlinear detuning is measurable (see § 4.4).

Note that the structure of these equations explain simply why it is possible to observe the instability in a very wide range of excitation frequency. Indeed, the curve
 $\omega _0 = \omega _w^+ - \omega _z^-$
as a function of
 $k$
maps
 $\mathbb{R}$
to itself: for every excitation frequency
 $\omega _0$
, there exists a wavenumber
 $k$
for which the resonance condition can be fulfilled. Experimentally, we could not observe the instability using frequencies below 10 Hz, for in such condition the wavelength becomes comparable to the size over which the forcing is homogeneous.
3.4. Physical interpretation of the instability mechanism
Let us now try to convey a qualitative understanding of the physical effects represented by the nonlinear coupling terms of (3.5) responsible for the destabilization of the straight rivulet.
One interesting feature of the present instability is that neither of the two types of waves in the final pattern is unstable on its own in the absence of forcing, nor does the forcing directly amplify any of the perturbation. While sinuous and varicose instabilities are often present in fluid mechanics, for example when studying jets (Eggers & Villermaux Reference Eggers and Villermaux2008; Mikhaylov & Wu Reference Mikhaylov and Wu2020) or sheets (Villermaux & Clanet Reference Villermaux and Clanet2002), usually either one mode becomes unstable on its own, or two or more modes become unstable, compete for energy and the fastest growing mode wins. In the system we study here, the forcing only acts as a mere intermediary, as its only role is to couple together two different type of waves which would not interact in the absence of forcing. The two coupling terms in (3.5a ) and (3.5b ) are mathematical representations of the two ways that longitudinal and transverse waves can influence one another.
The
 ${{ {{{ \tilde F }}}^* }}{{ \tilde W }}$
term in (3.5a
) that governs the evolution of the path
 ${ \tilde Z }$
translates the fact that a rivulet with uneven width will see its path deformed when displaced transversally under the action of the forcing, as illustrated on figure 6(a). Indeed, if a rivulet presenting width modulations is moved transversally, then the thicker parts of the rivulet, having more inertia, will be less mobile than the thinner parts of the rivulets, which carry a lesser mass of liquid. Since different parts of the rivulet, having different mass, will displace transversally along different lengths, this will lead to a deformation of the path followed by the rivulet. Following this reasoning, it is straightforward that the spatial periodicity of the path deformation will be the same as the width modulation periodicity. This allows for a qualitative understanding of condition (3.7b
) (the two waves share the same wavelength).
Schematic illustration of the crossed-amplification mechanism. The length of the arrows represents the intensity of the displacement locally imposed to the rivulet. (a) Deformation of the fluid path due to space-varying mass repartition on the rivulet. (b) Change in the width profile due to the rivulet path being non-straight. Note that as the forces are drawn, the sinuose and varicose deformation enhance each other. If the directions of the arrows are reversed but the sinuosity stays the same (corresponding to a change of sign in force while staying in the reference frame moving with the sinuosity, i.e. to transformation (3.8)), then the interaction only stays constructive if the width modulation is moved half a wavelength downwards, i.e. (3.9) must be verified. (See also Supplementary figure SF1.)

The
 ${{ \tilde F }}{{ \tilde Z }}$
term in (3.5b
) that governs the evolution of the width perturbation
 ${ \tilde W }$
represent the fact that a rivulet with a curved path will see its width profile evolve when displaced under the action of the forcing, as illustrated on figure 6(b). Let us considering a rivulet presenting a period curved path, being moved like a membrane under the action of differential pressure between both sides of the rivulet. At places where the curvature is of the same sign as the pressure displacement force, the fluid will accumulate, being drawn in from the sides, and the rivulet will get thicker. On the contrary, places where the curvature is of opposite sign as the pressure force will be depleted in fluid and will be getting thinner, for the same reason the membrane of an expanding rubber balloon thins. As before, following this reasoning we also understand that the spatial periodicity of the width modulation will reflect that of the path curvature, validating once more condition (3.7b
).
Finally, let us considers the same mechanisms that were just exposed in the two preceding paragraphs, but half a forcing period later, as is shown on the bottom part of Supplementary figure SF1. This corresponds to changing the sign of the pressure force/transverse displacement: formally, this is associated with the
 \begin{align} t\rightarrow t+ \pi /\omega _0 && \tilde {\varPi } \rightarrow -\tilde {\varPi } && {{ \tilde F }} \rightarrow -{{ \tilde F }} && {{ \tilde Z }}\rightarrow {{ \tilde Z }} e^{i\pi \omega _z/\omega _0} && {{ \tilde W }}\rightarrow {{ \tilde W }} e^{i\pi \omega _w/\omega _0} \end{align}
transformation. The varicose amplification mechanism will lead to a width modulation of opposite sign compared with the previous situation (since the pressure drop changed sign). In order for the total mechanism to work this must be on par with the action of the sinuosity amplification mechanism, which requires the width modulation pattern to be displaced by half a wavelength compared with the sinuous pattern (see Supplementary figure SF1 for an illustration): formally, this corresponds to the
 \begin{align} {{ \tilde W }}\rightarrow -{{ \tilde W }} e^{i\pi \omega _z/\omega _0} = {{ \tilde W }} e^{i\pi (\omega _z \pm \omega _0)/\omega _0} \end{align}
transformation. Hence, for the mechanism to work at all times, the system must verify
 $\omega _w = \omega _z \pm \omega _0$
: this is precisely the resonance condition (3.7a
). Both resonance conditions can thus be understood qualitatively by looking at the physical interpretation of the amplification mechanism: two different effects combine to form the complete amplification cycle.
One obvious follow-up question following this demonstration would be: What is the relative importance of these two effects? This question, and others, finds its answer in the next section.
4. Pattern formation and structure
4.1. Dimensionless formulation
In order to make the mathematical computations more concise, we use changes of variables to make the system of equations dimensionless. The time scale choice is straightforward and corresponds to
 $2/\mu$
, the typical wave damping time in the absence of forcing. As length scale we choose the quantity
 ${{ \ell }} := \mu \sqrt {w_0 {v_{{c}}} / {\omega _0}^3}$
, the interpretation of which will become clear in the next subsection. Thus, we define
 \begin{align} T := \mu {{ \tilde T }}/2 && {{ F }} := {{ \tilde F }}/{{ \ell }} && {{ Z }} := {{ \tilde Z }}/{{ \ell }} && {{ W }} := {{ \tilde W }}/{{ \ell }} \end{align}
which allows us to write (3.5) in a compact dimensionless form
 \begin{align} \partial _T Z &= - Z + i \phi {{ {F}^* }} W + i \big (\alpha _{ZZ} {|Z|}^2+ \alpha _{ZW} {|W|}^2 \big )Z , \\[-9pt] \nonumber\end{align}
 \begin{align} \partial _T W &= - W - i\frac {1}{\phi } F Z + i \big (\alpha _{WZ} {|Z|}^2+ \alpha _{WW} {|W|}^2 \big )W, \\[9pt] \nonumber \end{align}
where
 $\phi := ({1}/{u_0 k})(\sqrt { {\omega _0{v_{{c}}}}/{w_0}})$
; and the detuning prefactors
 $\alpha _{XX}$
are defined as follows:
 \begin{align} \alpha _{ZZ} &:= 7\,\varXi \,(k w_0)^3, & \alpha _{ZW} &:= 4 \varXi \,(k w_0)^2 \left (1 + \frac {5}{16} (k w_0)\right )\!, \nonumber \\ \alpha _{WZ} &:= 2\,\varXi \,\frac {{v_{{c}}}}{u_0} (k w_0)^4, & \alpha _{WW} &:= \varXi \,k w_0,\end{align}
where
 $\varXi := {\mu u_0{v_{{c}}}}/{{\omega _0}^3{w_0}^2} = {u_0 {{ \ell }}^2}/{\mu {w_0}^3}$
characterizes the detuning strength. The dimensionless coefficient
 $\phi$
translates the relative efficacy of the two effects that participate in the coamplification: amplification of sinuosity due to uneven mass repartition, and amplification of varicosity due to path curvature (see § 3.4 for further details on the physical interpretation of these terms). It thus quantifies the asymmetry of the instability mechanism: thick rivulets moved at low frequency have
 $\phi \gg 1$
and are unstable because of the path deformation due to width heterogeneity, while thin rivulets moved at high frequency have
 $\phi \ll 1$
and are mostly unstable because of curvature induced fluid concentration along the rivulet. All the experiments presented in this study display
 $\phi \gt 1$
, meaning that the main amplification stage in the mechanism is the differential movement of the path due to the spatially inhomogeneous inertia of the rivulet.
4.2. Instability threshold
We will now turn to the study of the pattern near the instability threshold: in all the following, we will assume
 ${|Z|} \sim {{\epsilon '}}$
and
 ${|W|} \sim {{\epsilon '}}$
, with
 ${{\epsilon '}}\ll 1$
. We define the vector
 $| {U}\rangle := \begin{pmatrix} Z \\ W\end{pmatrix} $
which condenses all the information about the state our system is in, using a concise notation. We borrow the bra–ket notation to our quantum mechanics colleagues as it is particularly useful when dealing with linear algebra problems. Since
 $\|{U}\| \ll 1$
, (4.2a
) and (4.2b
) can be simplified to
 \begin{align} \partial _T| {U}\rangle &= {{\mathbf{L}}}| {U}\rangle, \quad \text{with}\quad {{\mathbf{L}}}=\left (\begin{matrix}-1 & i\phi {{ {F}^* }}\\-i \frac 1\phi F & -1\end{matrix}\right ) \end{align}
being a linear evolution operator.
The trace of the matrix
 ${\boldsymbol{L}}$
is
 $\textrm {tr} ({{\boldsymbol{L}}}) = -2 \lt 0$
. Since it is the sum of the eigenvalues
 ${\boldsymbol{L}}$
, we can conclude that there always exists at least one mode that is linearly damped. The determinant reads
 $\Delta ({{\boldsymbol{L}}}) = 1 - {|F|}^2$
, it is the product of the eigenvalues of
 ${\boldsymbol{L}}$
. The instability develops if and only if one mode is linearly amplified, i.e. if one of the eigenvalues of
 ${\boldsymbol{L}}$
has a positive real part. This is only the case if
 $\Delta ({{\boldsymbol{L}}})$
is negative, which happens when the forcing exceeds a critical threshold equal to one in dimensionless units. The instability thus develops if and only if the condition
 \begin{align} {|F|}^2 \gt {|{ F _c}|}^2 := 1 \quad \Leftrightarrow \quad {|{\tilde F}|} \gt {{|{\tilde F}|}_c} := \mu \sqrt {\frac {w_0 {v_{{c}}} }{ {\omega _0}^3}} = {{ \ell }} \end{align}
is fulfilled. The interpretation of
 ${ \ell }$
is now clear: it corresponds to the minimum transverse displacement needed to develop the instability. This provides us with a scaling law for the threshold forcing amplitude:
 ${|{\tilde F_c}|} \propto (\omega _0)^{-3/2}$
. This scaling law is shown on figure 7 to be verified by experimentally. Interestingly, the prefactor value obtained by computing the best fit (33.7
 $\textrm {mm}\times \textrm {Hz}^{-3/2}$
) is the same order of magnitude but does not correspond exactly to the theoretical prefactor computed using the analytical formula (4.5) (
 ${(16.4 \pm 3,3)}{\,\textrm {mm}\times \textrm {Hz}^{-3/2}}$
). Several factors may explain this discrepancy. On the experimental side, the precise measurement of
 ${|{\tilde F_c}|}$
itself is difficult, especially at high frequencies. On the theoretical side, this difference may be explained, partially or totally, by several factors: the
 ${{\epsilon }} \ll 1$
approximation, which is not strictly respected in the developed pattern, the weakly nonlinear method we use, if the nonlinearity is more important than anticipated or the
 $u_0\approx {v_{{c}}}$
approximation, which is not exact. The fact that the best fit value is almost exactly a factor two off the theoretical result could also indicate an algebraic error in our computations, even though we could not catch it after rederiving our results several times.
Threshold transverse displacement as a function of excitation frequency. Experiments done with cell gap
 $b={0.6}\,\textrm {mm}$
and flow rate
 $Q={(26 \pm 1)}\,\textrm {mm}^{3}\,\textrm {s}^{- 1}$
. The black dots correspond to experimental measurements. The dashed grey line represents the resolution limit of our measurement method; it corresponds to one fifth of the pixel spacing. The full green line is a one-parameter fit corresponding to a power law of exponent
 $-3/2$
, the multiplicative factor being free. Inset: same data on a log–log scale.

4.3. Pattern structure
After identifying the forcing threshold over which the instability develops, we now turn to the study of the pattern itself. We ought to understand the structure of the most unstable mode that grows, and compare it with the pattern observed in the experiments.
To do so, we place ourselves in the vicinity of the instability threshold, assuming
 $F = F_c + {{\epsilon '}}^2\delta F$
with
 ${|{F_c}|} = 1$
and
 ${\epsilon '}$
the small parameter introduced in the previous subsection. This allows us to decompose the evolution matrix into
 \begin{align} {{\boldsymbol{L}}} = {{{{\boldsymbol{L}}}_0}} + {{\epsilon '}}^2 {{ \delta {{\boldsymbol{L}}} }} = \left (\begin{matrix}-1 & i\phi {{ {F_c}^* }} \\-i \frac 1\phi F_c & -1\end{matrix}\right ) + {{\epsilon '}}^2 i \left (\begin{matrix}0 & \phi {{ {\delta F}^* }} \\- \frac 1\phi \delta F & 0\end{matrix}\right )\!. \end{align}
The matrix
 ${{{\boldsymbol{L}}}_0}$
is diagonalizable and has two eigenvalues,
 $\lambda _0 = 0$
and
 $\lambda _- = -2$
, associated with the two eigenvectors
 \begin{align} |{V_0}\rangle = \frac {1}{\sqrt {1 + {|{F_c}|}^2/\phi ^2}}\left (\begin{matrix}1 \\-i F_c/\phi \end{matrix}\right ) && \,\,\,\text{and}\,\,\, && | {V_-}\rangle = \frac {1}{\sqrt {1 + \phi ^2{|{F_c}|}^2}}\left (\begin{matrix}-i \phi {{ {F_c}^* }} \\1\end{matrix}\right ) \end{align}
which are of norm 1, using the standard product
 $\langle{P}|{Q}\rangle = P^\dagger \, Q$
where
 $P^\dagger$
represents the adjoint, or transconjugate, of
 $P$
.
The eigenvector
 $| {V_0}\rangle$
corresponds to a neutral mode of the operator
 ${{{\boldsymbol{L}}}_0}$
. It is the mode that will be amplified and that saturates when nearby the threshold instability. Thus, we can write, at first order in
 ${\epsilon '}$
,
 $| {U}\rangle = {{\epsilon '}} A | {V_0}\rangle$
with
 $A$
being the dimensionless amplitude of the pattern.
Looking at
 $| {V_0}\rangle$
, it is thus possible to obtain information about the structure of this neutral mode. In particular, if the pattern is given by
 $| {V_0}\rangle$
, then we can write the following relationship between
 $Z$
and
 $W$
:
 \begin{align} W = -i \frac {F_c}{\phi }Z \end{align}
where here the
 $\phi$
factor translates the fact that since one mechanism is more efficient than the other, then one of the waves will have greater amplitude. Indeed, in the experimental pattern (figures 3 and 4) we observe that the transverse waves have a greater amplitude than the longitudinal waves, which is coherent with the fact that the
 $\phi$
factor is always greater than one in the experiments we show in this article. Equation (4.8) contains all the information about the structure of the instability pattern. Taking the argument and the norm, we can write
 \begin{align} \arg W &= \arg {Z} + \arg {F} - \frac {\pi }{2}, \end{align}
 \begin{align} {|W|} &= {|Z|}/\phi = k {|Z|}\ u_0\sqrt {w_0 / (\omega _0\,{v_{{c}}})} .\end{align}
Equation (4.9a
) predicts the relative phase between the longitudinal wave, the transverse wave and the response to forcing. The arguments of
 $Z$
,
 $F$
and
 $W$
correspond to three degrees of freedom of the system. Since any pair of these can be arbitrarily changed by redefining the origins of space (by the transformation
 $x \rightarrow x+ x_0$
) and time (by the transformation
 $t \rightarrow t+ t_0$
), this relation completely constrains the system. As can be seen on figure 8(a), the relation (4.9a
) is verified experimentally with excellent precision. Note that signature of this phase relation can be seen when observing directly the pattern. For example, on figure 3, extrema of
 $w$
(centre of dark or light shaded zones in the central plot, corresponding to
 $\arg (W) \equiv 0 [\pi ]$
) are never found in places where
 $z$
is extremal (i.e. where
 $\arg (Z) + \arg (F) \equiv 0 [\pi ]$
). On the same figure, by looking carefully at the intersections between extrema of
 $w$
, extrema and zeros of
 $Z$
(figure 3
a), and extrema and zeros of
 $F$
(figure 3
c), one can recover (4.9a
).
Structure of the combined mode. The dots always correspond to experimental measurement. Cell gap
 $b={(0.58 \pm 0.02)}\,\textrm {mm}$
, flow rate
 $Q={(25.6 \pm 0.9)}\,\textrm {mm}^{3}\,\textrm {s}^{- 1}$
, excitation frequency
 $\omega _0/(2\pi )={40}\,\textrm {Hz}$
. (a) Relative phase of the waves as a function of the transverse movement amplitude. There are measurement points below the threshold where we can still observe a weak pattern (see discussion on § 4.4). (b) Link between the relative amplitude of transverse and longitudinal waves as a function of the transverse movement amplitude. The points below the threshold are associated with high experimental uncertainty, since the associated amplitudes are very small (see figure 9).

Complementary to (4.9a
), relationship (4.9b
) predicts the relative amplitude between the two waves forming the pattern. The norms of
 $Z$
,
 $F$
and
 $W$
correspond to three degrees of freedom of the system. The amplitude of
 $F$
is directly imposed by the forcing, and the pattern amplitude
 $|A|$
depends on nonlinear saturation effects, hence (4.9b
) closes the system and determines completely the pattern. As one can see on figure 8(b), this relationship is very well recovered by the experiments.
In order to completely characterize the instability, we still need to understand the saturation of the pattern amplitude
 $A$
, which is the object of the next subsection.
4.4. Nonlinear detuning and saturation
We now turn to finer effects due to nonlinear terms: frequency detuning and amplitude saturation. To do so, we allow the amplitude
 $A$
to vary with a slow dimensionless time scale
 $\tau = T / {{\epsilon '}}^2$
, so that (4.2a
) and (4.2b
) can be written, up to third order in
 ${\epsilon '}$
, in the form
 \begin{align}\partial _{\tau }| {U}\rangle = ({{{{\boldsymbol{L}}}_0}} + {{\epsilon '}}^2 {{ \delta {{\boldsymbol{L}}} }})| {U}\rangle+ i \left (\begin{matrix}\alpha _Z & 0 \\ 0 & \alpha _W\end{matrix}\right ) {{\epsilon '}}^2{|A|}^{2} | {U}\rangle\end{align}
where we defined
 $\alpha _z$
so that
 \begin{align} {{\epsilon '}}^2{|A|}^2 \alpha _Z = \alpha _{ZZ}{|Z|}^2 + \alpha _{ZW}{|W|}^2 = {{{\epsilon '}}^2 {|A|}^2} \frac {\alpha _{ZZ} + \alpha _{ZW} {|{F_c}|}^2 /\phi ^2}{1 + {|{F_c}|}^2 /\phi ^2} \end{align}
and similarly so for
 $\alpha _W$
. We also have to expand
 $| {U}\rangle$
in powers of
 ${\epsilon '}$
:
 $| {U}\rangle = {{\epsilon '}} | {U_1}\rangle + {{\epsilon '}}^2| {U_2}\rangle + {{\epsilon '}}^3| {U_3}\rangle+ \ldots$
(4.10) at order one which yields the familiar result
 $| {U_1}\rangle = A(\tau )| {V_0}\rangle$
. By going to higher order, we are now searching to characterize the evolution of
 $A$
with
 $\tau$
. At order two the equation leads to
 $| {U_2}\rangle = | {0}\rangle$
, while the third-order development yields
 \begin{align} \partial _{\tau }A | {V_0}\rangle = {{{{\boldsymbol{L}}}_0}}| {U_3}\rangle + A {{ \delta {{\boldsymbol{L}}} }}| {V_0}\rangle+ i {|A|}^{2}A\left (\begin{matrix}\alpha _Z & 0 \\ 0 & \alpha _W\end{matrix}\right ) | {V_0}\rangle , \end{align}
which can be rewritten in the form
 \begin{align} | {N}\rangle := {{{{\boldsymbol{L}}}_0}}| {U_3}\rangle = \partial _{\tau }A | {V_0}\rangle - iA \left (\begin{matrix}0 & \phi {{ {\delta F}^* }}\\ -\frac 1\phi \delta F & 0\end{matrix}\right ) | {V_0}\rangle - i {|A|}^{2}A\left (\begin{matrix}\alpha _Z & 0 \\0 & \alpha _W\end{matrix}\right ) | {V_0}\rangle\ . \end{align}
Using the Fredholm alternative, we find that
 $| {N}\rangle$
must be orthogonal to the kernel of
 ${{{{\boldsymbol{L}}}_0}}^\dagger$
. This can be justified using the simple following reasoning: a weak writing of the equality
 ${{{{\boldsymbol{L}}}_0}}| {U_3}\rangle = | {N}\rangle$
is that any vector
 $| {P}\rangle$
must verify
 $\langle{P}|{N}\rangle = \langle{P}| {{{{\boldsymbol{L}}}_0}}| {U_3}\rangle = \langle{U_3}|{{{{{\boldsymbol{L}}}_0}}}^\dagger | {P}\rangle$
. In particular, if
 $| {P}\rangle \in \ker ({{{{{\boldsymbol{L}}}_0}}}^\dagger )$
, that is to say if
 ${{{{{\boldsymbol{L}}}_0}}}^\dagger | {P}\rangle = 0$
, then
 $\langle{P}|{N}\rangle = 0$
, recovering that
 $| {P}\rangle$
is orthogonal to
 $| {N}\rangle$
.
The kernel of
 ${{{{{\boldsymbol{L}}}_0}}}^\dagger$
is the span of the vector
 $| {W_0}\rangle$
, the eigenvector of
 ${{{{{\boldsymbol{L}}}_0}}}^\dagger$
of norm unity associated with the zero-eigenvalue
 \begin{align} | {W_0}\rangle := \frac {1}{\sqrt {1 + \phi ^2{F_c}^2}}\left (\begin{matrix}1 \\ -i \phi F_c\end{matrix}\right ) \end{align}
which resembles closely
 $| {V_0}\rangle$
since
 ${\boldsymbol{L}}$
is close to a Hermitian. The condition
 $\langle{W_0}|{N}\rangle = 0$
yields the following amplitude equation:
 \begin{align} \big(1 + {|{F_c}|}^2 \big)\partial _{\tau }A = A ({{ {F_c}^* }} \delta F + {F_c} {{ {\delta F}^* }}) + i {|A|}^2 A \big(\alpha _Z + \alpha _W{|{F_c}|}^2 \big) .\end{align}
This equation presents an amplification term as well as a nonlinear detuning, but no saturation of amplitude. Contrary to other parametric systems such as the parametric pendulum described by the Mathieu equation, detuning here does not force a departure from resonance. This is because although nonlinear detuning shifts the frequencies away from the
 $F=F_c$
equilibrium values, the system adapts by modifying the wavelength of the pattern in order to preserve the resonance conditions (3.7b
) and (3.7a
).
In order for the amplitude equation to have a bounded solution, it is necessary to add higher-order terms into (4.15). We can do so without needing to compute the prefactor explicitly, by considering expressions that respect the symmetries of the problem. In particular, the symmetry
 $x\rightarrow x + x_0\Rightarrow A\rightarrow Ae^{i \varphi }$
forces the supplementary term to be of the form
 $A^n{{ {A}^* }}^m$
with
 $n = m+1$
. Adding in (4.15) the smallest-order term that respects this symmetry of the problem leads to writing the ansatz
 \begin{align} (1 + {|{F_c}|}^2)\partial _{\tau }A = A ({{ {F_c}^* }} \delta F + {F_c} {{ {\delta F}^* }}) + i {|A|}^2 A (\alpha _Z + \alpha _W{|{F_c}|}^2 ) - \sigma {|A|}^4 A \end{align}
where
 $\sigma$
is a complex number, with positive real part so that the last term is responsible for the saturation. We now write
 $A(\tau )$
in the polar form
 $R(\tau ) e^{i \varOmega \tau }$
with
 $R \gt 0$
. The evolution equations for
 $R$
and
 $\varOmega$
are then
 \begin{align} \partial _\tau R &= (F-F_c) R - \frac { {\textrm{Re}}(\sigma )}{2} R^5 , \\[-9pt] \nonumber \end{align}
 \begin{align} \varOmega &= \frac {\alpha _Z + \alpha _W}{2} R^2 - \frac {\textrm {Im}(\sigma )}{2} R^4 \approx \frac 1{2}({\alpha _Z + \alpha _W}) R^2\quad \text{for $R \ll 1$} ,\\[12pt] \nonumber \end{align}
where without loss of generality we redefined the origin of times in order to have
 $\arg {F} = \arg {\delta F} = \arg {F_c} = 0$
. Equation (4.17a
) predicts that the amplitude of the unstable pattern
 ${|A|} = R$
grows when
 $F \gt F_c$
, until it reaches a saturation value that is proportional to
 $\sqrt [4]{F - F_c}$
: this is experimentally confirmed on figure 9(b). Equation (4.17b
) predicts that the frequencies of the waves grow by a quantity
 $\mu \varOmega / 2$
. In order for
 $\omega _z$
and
 $\omega _w$
to stay close from their respective dispersion relations, while still verifying the resonance condition, the pattern wavelength must also be modified. In the regime
 $k \ll 1/w_0$
, one can write
 $\omega _w \approx u_0 k$
. Hence, the wavelength is modified by a quantity
 $K \approx \varOmega / {v_{{c}}}$
. This predicts a displacement
 $k - k_0 \propto \sqrt [2]{F - F_c}$
which, as can be seen in figure 9(a), describes the experiments well.
The imperfect match between our model and experimental data can be at least partially explained by the fact that the excitation takes place in a finite zone. Near the threshold, the length over which the instability develops diverges. Since our system is finite, we thus do not see the fully developed instability in the form that our model rigorously describes. The match becomes better as the forcing goes further away from the threshold.
Nonlinear detuning and saturation. The dots always correspond to experimental measurement. Cell gap
 $b={(0.58 \pm 0.02)}\,\textrm {mm}$
, flow rate
 $Q={(25.6 \pm 0.9)}\,\textrm {mm}^{3}\,\textrm {s}^{-1}$
, excitation frequency
 $\omega _0/(2\pi )={40}\,\textrm {Hz}$
. (a) Spatial detuning as a function of forcing. The linear prediction is coherent with the zero-amplitude instability wavelength. The solid line corresponds to the function
 $k \rightarrow k_0 + K\sqrt {F - F_c}$
where the value of
 $k_0$
and
 $K$
are the ones that best fit the data. (b) Amplitude evolution of the instability as a function of the forcing response amplitude. The filled dots correspond to experimental points. Under the threshold (
 ${{ \tilde F }}_c \approx {0.255}\,\textrm {mm}$
), the values of both
 ${ \tilde Z }$
and
 ${ \tilde W }$
are very close to zero. The filled lines correspond to the function
 ${{ \tilde Z }}, {{ \tilde W }} \rightarrow Z_0 \sqrt [4]{F - F_c}, Z_0/\phi \sqrt [4]{F - F_c}$
where the value of
 $Z_0$
is the one that best fits the data.

4.5. Rivulet breakup
As can be seen on figure 9, the instability stops existing above a certain forcing. This is because of rivulet breakup: above a critical movement amplitude, the rivulet breaks at one point into two disconnected top and bottom parts. This process is shown in the Supplementary movie SM4. The bottom part of the rivulet then falls down rapidly at
 $u_0$
, while the fluid of the top part retracts until forming a large droplet, which then falls down vertically. Between the two parts, air can communicate between the right-and left-hand halves of the cell. This means that the acoustic forcing becomes extremely inefficient, since the rivulet no longer separates both halves in an airtight manner: the membrane is breached. When the top part of the rivulet has fallen down low enough, the membrane-like property of the rivulet is restored and the forcing is effective again: the instability grows and breaks, repeating the process periodically.
The reason the rivulet breaks is that the two side menisci bordering the liquid filament enter into contact with each other. This happens when the local width of the rivulet reaches 0, i.e. in our model when
 $2{{ \tilde W }} = w_0$
. Indeed, this is clearly visible in figure 9: the breakup (indicated by a black dotted line) happens when
 $2{{ \tilde W }} \approx w_0$
, and we never observe width variations of amplitude significantly greater than the rest width.
Forcing at breakup for varying excitation frequencies. Experiments done with cell gap
 $b={0.6}\,\textrm {mm}$
and flow rate
 $Q={(26 \pm 1)}\,\textrm {mm}^{3}\,\textrm {s}^{-1}$
. The curve was obtained by measuring the linear response to forcing
 ${ \tilde F }$
at the maximum forcing amplitude, just before breakup. It is presented in log–log scale, with a −1 power law as guide for the eyes.

Experimental rivulet path
 $z$
and width
 $w$
, represented in the Fourier space. Cell gap
 $b={(0.58 \pm 0.02)}\,\textrm {mm}$
, flow rate
 $Q={(25.6 \pm 0.9)}\,\textrm {mm}^{3}\,\textrm {s}^{-1}$
, excitation frequency
 $\omega _0/(2\pi )={40}\,\textrm {Hz}$
. The filled lines represent the dispersion relations of transverse (red) and longitudinal (blue) waves. Both graphs were obtained using zero-padding of the experimental signal. (a) Power spectrum of
 $\hat {z}(k, \omega )$
(red signal) and
 $\hat {w}(k, \omega )$
(blue signal) For both signals, the colour intensity corresponds to scale going from a reference value of 0 dB (corresponding to the most intense value of this signal) to −20 dB. (b) Phase spectrum of
 $\hat {z}(k, \omega )$
and
 $\hat {w}(k, \omega )$
. Colour hue corresponds to the phase of the signal, while colour intensity represents the signal strength. As for (a), the colour scale fades to white under 20 dB of the reference signal.

On figure 10 we show the breakup forcing as a function of the excitation frequency. The points seem to align along a relation of the type
 ${{ \tilde F }}_{\textit{break}}\propto 1/\omega _0$
, although the physical origin of this scaling law is unclear.
5. Conclusion
To end this article, we first highlight how several key characteristics of the system we study can be retrieved concisely by representing the experimental signals in the frequency space. We then present a summary of our study as well as promising directions for future research.
5.1. Representation in the Fourier space
The evolution of the rivulet geometry due to the instability is at first sight quite complex. Indeed, the pattern generated is the sum of three contributions of different nature (transverse or longitudinal), and of different spatial and temporal characteristics. This can be seen by looking at figures 3 and 4 which are rather busy and need to time to be properly understood. One way to disentangle all the different contributions of the pattern, is to represent the experimental data in the frequency space instead of the real space. We present on figures 11 and 12 such a representation, where the Fourier transform of the position and width of the rivulet are shown as a function of time and space frequencies. Since each signal is approximately periodic, it is represented in the Fourier space by a pair of localized dots that are symmetric with respect to the
 $(\omega ,k)=(0,0)$
point. This allows for a concise representation of the data: each wave constituting the pattern correspond to a dot (or pair of dots for functions only of time) on these figures.
Experimental signals of the rivulet path
 $z$
and width
 $w$
, represented in the Fourier space. Cell gap
 $b={(0.58 \pm 0.02)}\,\textrm {mm}$
, flow rate
 $Q={(25.6 \pm 0.9)}\,\textrm {mm}^{3}\,\textrm {s}^{-1}$
, excitation frequency
 $\omega _0/(2\pi )={40}\,\textrm {Hz}$
(same conditions as figure 11). For both signals, the colour intensity corresponds to scale going from a reference value of 0 dB (corresponding to the most intense value of this signal) to −80 dB. The filled lines represent the dispersion relations of transverse (red) and longitudinal (blue) waves. Both graphs were obtained using zero-padding of the experimental signal, and Chebychev windowing to mitigate spectral leakage. (a) Power spectrum of
 $\hat {z}(k, \omega )$
. The blue dotted lines circle the spots where the power spectrum of
 $\hat {w}(k, \omega )$
is concentrated; see (b). (b) Power spectrum of
 $\hat {w}(k, \omega )$
. The red dotted lines circle the spots where the power spectrum of
 $\hat {z}(k, \omega )$
is concentrated; see (b).

On figure 11(a) one can see that the signals correspond to the three different waves forming the instability. The two red dots aligned on the
 $k=0$
vertical line represent the two frequency components of the linear response of the path to the forcing
 ${{ \tilde F }} e^{i \omega _0 t} + {{ {{{ \tilde F }}}^* }} e^{-i \omega _0 t}$
. The red dot at
 $k\neq 0$
corresponds to the transverse wave deforming the path, which is placed along the
 $\omega _z^-(k)$
dispersion relation, it corresponds to the
 ${{ \tilde Z }} e^{i (\omega _z^- t - k_z x)} + {\text{c.c.}}$
signal. The blue dot corresponds to the longitudinal wave modulating the width signal, it is placed along the
 $\omega _w^+(k)$
dispersion relation, it corresponds to the
 ${{ \tilde W }} e^{i (\omega _w^+ t - k_w x)} + {\text{c.c.}}$
signal. On figure 11(b), one can see the same dots as on the left-hand plot, with the same colour intensity but with different colours. On this plot, the colours now represent the phase of the signals, they correspond to the argument of
 ${ \tilde F }$
(dots on
 $k = 0$
), of
 ${ \tilde Z }$
(dot on the transverse waves dispersion relation), and of
 ${ \tilde W }$
(dot on the longitudinal waves dispersion relation).
Just by looking at figure 11, one can directly verify the fundamental properties of the instability. The pattern is formed of three contributions: a spatially homogeneous (
 $k=0$
) response to the forcing, a transverse wave and a longitudinal wave. Both propagative waves are aligned on the same vertical line, which correspond to the (3.7b
) condition for resonant interaction, and their vertical distance corresponds to the forcing frequency
 $\omega _0/(2\pi ) = {40}\,\textrm {Hz}$
: this is nothing more than condition (3.7a
). With this representation in the dual space, the resonance condition hence takes a simple, visual meaning.
Using the Fourier representation, we are able to plot both the amplitudes and phase of the relevant signals. By computing the energetic content of the different peaks showed on figure 11(a), we are able to measure the amplitudes
 $|{\tilde F}|$
,
 $|{\tilde Z}|$
and
 $|{\tilde W}|$
. The results of these measurements are shown, for varying forcing amplitude, in figures 8(b) and 9(b). But the Fourier representation also gives us access to the absolute phase of each signal. This is what is shown in figure 11(b): the coloured dots correspond to the same signals as on the left-hand plot, but the colours now represent the phase of the signal. We are thus able to visually check that the condition (4.9a
) on the pattern structure is verified: on figure 11 we see that
 $\arg ({{ \tilde F }}) \approx -\pi /2$
,
 $\arg ({{ \tilde Z }})\approx 0$
and thus
 $\arg ({{ \tilde W }}) = -\pi /2 + 0 -\pi /2 = -\pi$
. Both the amplitude and phase of the Fourier spectra can thus be quantitatively linked with mathematical properties of the pattern derived from our model.
On figure 12 we plotted the power spectra of the same signals as in figure 11, while lowering the fade-to-white threshold. This allows us to see weaker signals which correspond to secondary modes which are linearly damped. These modes are excited by nonlinear interactions between transverse displacement
 $z$
(represented by red arrows), and longitudinal modulations
 $w$
(blue arrows). Due to the
 $z\rightarrow -z$
mirror symmetry of the system, the evolution equation for
 $w$
can display autocoupled terms proportional to
 $z^2$
and
 $w^2$
but never cross-coupling terms
 $zw$
. For the same reason, the evolution equation of
 $z$
can only display cross-coupled terms of the form
 $wz$
. This symmetry condition thus selects the nonlinear interactions between modes, and completely explains the spectra observed on figure 12, as indicated by the coloured arrows which represent the contributions responsible for the signals we see. Note that the absence of signal in
 $z$
at coordinates
 $(\omega =\pm 2 \omega _0, k=0)$
on figure 12(a) shows that the excitation is sinusoidal in time, with no higher harmonics to be seen.
Using the Fourier representation thus allows one to both make accurate measurements, and grasp visually several key characteristics of the system and their consequences, such as the resonance condition, the pattern structure or the symmetry underlining the possible interactions between different waves.
5.2. Summary, limits and perspectives
We have studied the dynamics of liquid rivulets in a Hele-Shaw cell subject to additive homogeneous acoustic forcing. We established that two types of perturbations can propagate on the rivulet: deformations of the path and modulations of the width correspond to transverse and longitudinal waves, respectfully. Each type of wave can evolve at two different phase velocities, corresponding to distinct propagation modes. These waves are linearly independent, and exponentially attenuated in the absence of forcing. When imposing a homogeneous additive forcing to the rivulet, its linear response consists in a homogeneous transverse movement at the same frequency. This movement acts as a coupling between transverse and longitudinal waves, which can grow by amplifying each other if an algebraic relationship between the characteristics of the waves and the forcing is verified. Above a certain threshold, this cooperative interaction between the waves overwhelms the damping and a pattern-forming instability develops. We are able to understand this threshold and quantitatively retrieve its frequency-dependence. Our model allows us to develop a fine understanding of the structure of this pattern, in particular of the amplitude ratio and relative phase between longitudinal and transverse waves. Nonlinear developments explain the spatial detuning observed in the measurements, and adding an heuristic term compatible with the symmetries of the system allows us to explain the saturation of the pattern amplitude. We present data and a quantitative argument to explain the rivulet breakup at high forcing amplitude. Last, we showed how we can recover almost all the characteristics of the pattern by representing our data in the Fourier space, which helps visualizing in a simple and concise manner how the experimental system respects the mathematical constraints that our model predicts.
There are several ways one could improve upon the results we present in this study. The main drawback of the experimental system we use is the finite size of the acoustic excitation. Being able to move the rivulet homogeneously over a larger spatial extent would improve the measurement precision on the amplitudes
 $|{\tilde Z}|$
,
 $|{\tilde F}|$
and
 $|{\tilde W}|$
as well as on the wavenumbers
 $k_z$
and
 $k_w$
. It would also presumably extend the observation window for this instability to lower frequencies. This is feasible by using several loudspeakers, in phase with each other, on each side of the cell. The membranes of the loudspeakers we use also have a limited range of movement over which the speaker response is linear, limiting the range of excitation amplitude we can generate. Using pressurized air nozzles would allow for a greater range of pressures to be explored, allowing for example the instability to develop at lower excitation frequencies. On the theoretical side, the discrepancy of a factor
 $2.05\pm 0.10$
between the measured and predicted prefactor for the instability threshold power law presented on § 4.2 might be solved by a careful rederivation of our result, maybe using a different method.
Let us finish by presenting three possible directions for future research that we think are both attainable, in the sense that one would only need to make small modifications to the set-up in order to observe them, and, according to our experience with this system, possibly fruitful.
First, one might remark by looking at figures 11 and 12 that the signal for
 ${ \tilde Z }$
seems to be on the
 $\omega = 0$
horizontal line. This could indicate a frequency-locking phenomenon: for a certain range of parameters, the system strays away from the linear dispersion relations in order to verify
 $(\omega _z, \omega _w) = (0, \omega _0))$
. This is evidenced by the fact that as shown on the inset of figure 3 of Le Lay & Daerr (Reference Le Lay and Daerr2025b
), the time frequency of longitudinal waves
 $\omega _z$
seems to be zero under a certain threshold. The physical origin of this frequency-locking phenomenon, which would break the Galilean invariance of the amplification mechanism presented on § 3.4, is unknown.
Second, there are points in the parameter space that are not considered in this study but seem particularly worthwhile exploring, possibly leading to new behaviours to explain. At high forcing amplitude, one might expect secondary instabilities to take place, maybe inducing a drift of the pattern. For example, the
 $(\omega =2\,\omega _w, k=2\,k_w)$
mode is naturally forced by the system, and it lies (approximately) on the
 $\omega _w(k_w)$
dispersion relation: it can be resonantly forced and leads to a secondary instability. More generally, our system sustains a deep analogy with the Faraday instability, which is now well understood, and thus one can hope to apply the rich phenomenology of Faraday waves to fluid rivulets. Using analytical, numerical and experimental techniques that have proven useful for the study of Faraday waves could be a powerful way to explore and understand the dynamics of the rivulet. Note that in order to explore much higher forcing amplitude, one will need to make the rivulet more resistant to breakup. This can be done either (i) by using a thicker rivulet without augmenting the flow rate, which can be done by diminishing the cell spacing
 $b$
and/or increasing the fluid viscosity, or (ii) by avoiding the rupture when
 $w$
reaches zero – i.e. in the limit where the rivulet is a film linking Plateau borders on the walls (Drenckhan et al. Reference Drenckhan, Ritacco, Saint-Jalmes, Saugey, McGuinness, van der Net, Langevin and Weaire2007) – to explore ‘negative’ width
 $w$
solutions, which can be done by replacing the oil by a water–surfactant mix.
Last, using an improved set-up, it could be very interesting to use an acoustic forcing with different spatiotemporal characteristics than the one used in this study (monochromatic excitation at
 $(\omega =\pm \omega _0, k= 0)$
). By modulating the forcing both in time and space, for example by using a forcing with two or more frequency components, one could excite several waves simultaneously and observe their interactions. By using a forcing with a continuous frequency spectrum, one would be able to observe a continuum of waves that interact nonlinearly, with possible energy exchange and cascading between scales. The result could be accurately described by the quasi-one-dimensional wave turbulence theory, which has already been observed experimentally for gravity–capillary waves (Ricard & Falcon Reference Ricard and Falcon2021).
For the purpose of open access, the author has applied a Creative Commons Attribution (CC BY) license to any Author Accepted Manuscript version arising from this submission.
Supplementary movies
Supplementary movies are available at https://doi.org/10.1017/jfm.2025.11104.
Acknowledgements
G.L. is deeply grateful to F. Gallaire, F. Pétrélis and M. Berhanu for insightful discussions and for the helpful advices they provided.
Funding
This research received special funds from laboratory MSC (UMR 7057).
Declaration of interests
The authors report no conflict of interest.
Data availability statement
The data that support the findings of this study are available from the corresponding author upon reasonable request.
Appendix A. Nonlinear development of the dynamical equations
In this section, we develop the dynamical equations of the system up to third order in
 ${\epsilon }$
.
We define
 $\theta$
as the angle the rivulet makes with the vertical, and geometrically we have, up to third order in
 ${\epsilon }$
,
 \begin{align} \sin \theta &= \frac {\partial _x z}{\sqrt {1 + (\partial _x z)^2}} \nonumber \\ &= {{\epsilon }}\partial _x z_1 + {{\epsilon }}^2\partial _x z_2 + {{\epsilon }}^3\left (\partial _x z_3 - \frac 12(\partial _x z_1)^3\right ) + o({{\epsilon }}^4), \nonumber \\ \,\,\,\text{and}\,\,\, \cos \theta &= \frac {1}{\sqrt {1 + (\partial _x z)^2}} \nonumber \\ &= 1 {- {{\epsilon }}^2 \frac 12 (\partial _x z_1)^2} - {{\epsilon }}^3 \partial _x z_1\partial _x z_2 + o({{\epsilon }}^4) \ . \end{align}
Our strategy to obtain the nonlinear equations is the following: it seems intuitive at first to write the nonlinear equations for the behaviour of the rivulet in curvilinear coordinates, projecting all the vectors unto a local Frenet–Serret basis. This seems to allow the natural decoupling between streamwise forces (such as the bulk viscosity) and normal forces (such as pressure variations between the sides of the rivulet). However, since the rivulet, and thus the vector basis, moves with both space and time, any definition of a curvilinear parameter is ambiguous, and the writing of the dynamical equations in a frame of reference moving both in space and time quickly becomes extremely tedious. A simpler alternative is to introduce the streamwise and normal components of the speed:
 $u_s = u\cos \theta + v\sin \theta$
and
 $u_n = -u \sin \theta + v\cos \theta$
. We then write the equations using these variables, but projecting them onto the familiar, static basis
 $(\hat {\boldsymbol {x}}, \hat {\boldsymbol {z}})$
,
 \begin{align} w(\partial _t + u_s\partial _s) v =& - w\mu v + {w \varGamma \partial _s(\kappa _w)} \sin \theta + (\varGamma \kappa _z - {\mu _{{cl}}} u_n ) \cos \theta, \\[-9pt] \nonumber \end{align}
 \begin{align} w(\partial _t + u_s\partial _s) u =& w g - w\mu u + { w \varGamma \partial _s(\kappa _w)} \cos \theta + (\varGamma \kappa _z - {\mu _{{cl}}} u_n )(-\sin \theta ), \\[-9pt] \nonumber \end{align}
 \begin{align} (\partial _t + u_s\partial _s) w =& -w \partial _s u_s, \\[9pt] \nonumber \end{align}
with
 $\partial _s =\cos \theta \partial _x$
. The equations thus take a simple form, but there is still much work to be done in order to obtain the approximate evolution equations for our chosen variables,
 $z$
and
 $w$
.
In order to abbreviate the forthcoming equations, we will use the following notation for the time derivative in the advected frame of reference:
 ${{\partial _a}} = \partial _t + u_0 \partial _x$
.
A.1 Preliminary computations
A.1.1 Normal velocity
${u_n}$

The kinematic advection condition imposes
 \begin{align} \boldsymbol {u}\boldsymbol{\cdot }\boldsymbol {e}_z = v &= \partial _t z + u_s\partial _s z .\end{align}
We use
 $v = u_s\sin \theta + u_n\cos \theta$
,
 $\sin \theta = ( {\partial _x z}/{\sqrt {1+(\partial _x z)^2}} )= z_x \cos \theta$
and
 $\partial _s \bullet = \cos \theta \partial _x \bullet$
:
 \begin{align} u_s\sin \theta + u_n\cos \theta &= \partial _t z + u_s\cos \theta \partial _x z ,\nonumber \\ u_s\partial _x z\cos \theta + u_n\cos \theta &= \partial _t z + u_s\cos \theta \partial _x z. \end{align}
Hence
 \begin{align} u_n\cos \theta &= \partial _t z ,\end{align}
thus
 ${{u_n}}_1 = \partial _t z_1$
,
 ${{u_n}}_2 = \partial _t z_2$
and
 ${{u_n}}_3 = \partial _t z_3 + \partial _{{ \tilde T }} z_1 {+ ( 1/2)(\partial _x z_1)^2\partial _t z_1 }$
(anticipating that
 $\partial _x z_2=0$
).
A.1.2 Streamwise velocity
${u_s}$

By definition
 \begin{align} u_s &= u\cos \theta + v \sin \theta , \\[-9pt] \nonumber\end{align}
 \begin{align} {{u_s}}_0 &= u_0, \\[-9pt] \nonumber \end{align}
 \begin{align} {{u_s}}_1 &= u_1 , \\[-9pt] \nonumber\end{align}
 \begin{align} {{u_s}}_2 &= u_2 {-u_0\frac 12 (\partial _x z_1)^2} + v_1\partial _x z_1 \nonumber \\ &= u_2 + {\frac 12} u_0 (\partial _x z_1)^2 + \partial _t{z_1}\partial _{x}z_1, \\[-9pt] \nonumber \end{align}
 \begin{align} {{u_s}}_3 &= u_3{ -u_1\frac 12 (\partial _x z_1)^2 -u_0 \partial _x z_1\partial _x z_2} +v_1\partial _x z_2 + v_2\partial _x z_1 \nonumber \\ &= u_3 +u_1\frac 12 (\partial _x z_1)^2 +u_0\partial _x z_1\partial _x z_2 +\partial _t z_1\partial _x z_2+\partial _t z_2\partial _x z_1. \\[9pt] \nonumber \end{align}
A.1.3 Link between
$v$
and
$z$


By definition
 \begin{align} v &= {{u_n}}\cos \theta + u_s \sin \theta , \\[-9pt] \nonumber\end{align}
 \begin{align} \text{i.e.}\quad v_1 &= {{u_n}}_1 + {{u_s}}_0\partial _x z_1 = (\partial _t + u_0\partial _x)z_1 , \\[-9pt] \nonumber\end{align}
 \begin{align} v_2 &= {{u_n}}_2 + {{u_s}}_0\partial _x z_2 {+ {{u_s}}_1\partial _x z_1} = (\partial _t + u_0\partial _x)z_2 {+ u_1\partial _x z_1}, \\[-9pt] \nonumber\end{align}
 \begin{align} v_3 &= {{u_n}}_3 {-\frac 12(\partial _x z_1)^2{{u_n}}_1} + {{u_s}}_0\partial _x z_3 {+ {{u_s}}_1\partial _x z_2 + {{u_s}}_2\partial _x z_1 - \frac 16{{u_s}}_0(\partial _x z_1)^3} \nonumber \\ &= \partial _{{ \tilde T }} z_1 + (\partial _t + u_0\partial _x)z_3 {+ u_1\partial _x z_2 + u_2\partial _x z_1 + \partial _t z_1 (\partial _x z_1)^2 + \frac 13 u_0(\partial _x z_1)^3}. \\[9pt] \nonumber \end{align}
A.1.4 Curvatures
The effective curvatures of the path
 $\kappa _z$
and width profile
 $\kappa _w$
correspond, up to second order in
 ${\epsilon }$
, to the second space derivative of the respective variables:
 \begin{align} \kappa _{z, 1} & = \partial _{xx}z_1, & \kappa _{w, 1} & = \partial _{xx}w_1, \nonumber \\ \kappa _{z, 2} & = \partial _{xx}z_2, & \kappa _{w, 2} & = \partial _{xx}w_2.\end{align}
Going to third order, we face a difficulty: the derivation of Park & Homsy (Reference Park and Homsy1984) is only valid for linear approximations of the curvatures
 $\kappa _{z,w}$
. To push a system to third order, we assume that the curvatures take the following form:
 \begin{align} \kappa _{z} =&\, \frac 12\frac {\partial _{xx}(z + w/2)}{(1+(\partial _x (z + w/2))^2)^{3/2}} + \frac 12\frac {\partial _{xx}(z - w/2)}{(1+(\partial _x (z - w/2))^2)^{3/2}}, \nonumber \\ \kappa _{w} =&\, \frac {\partial _{xx}(z + w/2)}{(1+(\partial _x (z + w/2))^2)^{3/2}} - \frac {\partial _{xx}(z - w/2)}{(1+(\partial _x (z - w/2))^2)^{3/2}} . \end{align}
This assumption leads to the following third-order development:
 \begin{align} \kappa _{z, 3} =& \partial _{xx}z_3 {-\frac 32 [(\partial _x z_1)^2+(\partial _x w_1)^2/4]\partial _{xx}z_1 - \frac 34 (\partial _x z_1)(\partial _x w_1)\partial _{xx}w_1}, \nonumber \\ \kappa _{w, 3} =& \partial _{xx}w_3 {-\frac 32 [(\partial _x z_1)^2+(\partial _x w_1)^2/4]\partial _{xx}w_1 - \frac 34 (\partial _x z_1)(\partial _x w_1)\partial _{xx}z_1}. \end{align}
A.1.5 Mass conservation
Mass conservation states:
 \begin{align} \partial _t w =& -\partial _s (w\,{{u_s}}), \\[-9pt] \nonumber\end{align}
 \begin{align} (\partial _t + u_0\partial _x) w_1 & = -w_0\partial _x u_1, \\[-9pt] \nonumber \end{align}
 \begin{align} (\partial _t + u_0\partial _x) w_2 & = -w_0\partial _x {{u_s}}_2 - \partial _x(w_1 u_1) \nonumber \\ =& -w_0\partial _x u_2 - \partial _x(w_1 u_1) {-\frac 12 u_0 w_0\partial _x (\partial _x z_1)^2} - {w_0\partial _x (\partial _t{z_1}\partial _{x}z_1)}, \\[-9pt] \nonumber \end{align}
 \begin{align} (\partial _t + u_0\partial _x) w_3 + \partial _{{ \tilde T }} w_1 & = -w_0\partial _x {{u_s}}_3 - \partial _x(w_2 u_1 +w_1{{u_s}}_2) {+\frac 12(\partial _x z_1)^2 \partial _x(w_0 u_1 +u_0 w_1)} \nonumber \\& = -w_0\partial _x u_3 -w_0\partial _x \left( u_1\frac 12 (\partial _x z_1)^2 \right. \nonumber \\& \left. \vphantom{frac{1}{2}} \quad + u_0\partial _x z_1\partial _x z_2 +\partial _t z_1\partial _x z_2+\partial _t z_2\partial _x z_1 \right ) \nonumber \\&- \partial _x \left(w_2 u_1 + w_1 u_2 + w_1{\left[\frac 12 u_0 (\partial _x z_1)^2 + \partial _t{z_1}\partial _{x}z_1 \right]} \right) \nonumber \\& {+\frac 12(\partial _x z_1)^2 (w_0\partial _x u_1 +u_0\partial _x w_1)}. \\[9pt] \nonumber \end{align}
A.1.6 Linear results
The linear equations can be written (see (2.3)) as
 \begin{align} {{\mathcal{L}_z}} z_1 &= 0, \\[-9pt] \nonumber \end{align}
 \begin{align} {{\mathcal{L}_w}} w_1 &= 0 , \\[-9pt] \nonumber\end{align}
 \begin{align} (\partial _t + u_0 \partial _x) w_1 &= -w_0\partial _x u_1. \\[9pt] \nonumber \end{align}
From (A24) we can write
 $z_1 = {{ \tilde Z }} e^{i(\omega _z t- k_z x)} + {\text{c.c.}}$
, from (A25) we can write
 $w_1 = {{ \tilde W }} e^{i(\omega _w t- k_w x)} + {\text{c.c.}}$
and, since (A26) is linear,
 $u_1 = {{ \tilde U }} e^{i(\omega _w t- k_w x)} + {\text{c.c.}}$
The dispersions relations (2.5) can be written in the form
 \begin{align} \omega _{z} &= (u_0 + \varepsilon _z {v_{{c}}}) k_z ,\\[-9pt] \nonumber \end{align}
 \begin{align} \omega _{w} &= u_0 k_w +\varepsilon _w {v_{{c}}} w_0 {k_w}^2, \\[9pt] \nonumber\end{align}
where
 $\varepsilon _z$
and
 $\varepsilon _w$
can be +1 or −1 depending on the branch that we consider.
Last, from (A26) we obtain
 \begin{align} (i\omega _w -i u_0 k_w) {{ \tilde W }} &= i w_0 k_w {{ \tilde U }}, \nonumber \\ {{ \tilde U }} &= \frac {\omega _w - u_0 k_w}{w_0 k_w}{{ \tilde W }}, \nonumber \\ {{ \tilde U }} &= \varepsilon _w {v_{{c}}} k_w{{ \tilde W }}. \end{align}
A.2
Second order in
${\epsilon }$
evolution equations

A.2.1 Second-order evolution equation for
$z$

The dynamical equation projected onto
 $z$
, at second order, reads
 \begin{align} w_0{{\partial _a}} v_2 \quad & \nonumber \\ + (w_1{{\partial _a}} + w_0 u_1\partial _x ) v_1 = & { w_0\varGamma \partial _{x} \kappa _{w, 1}(\partial _x z_1)} \nonumber \\ & + \varGamma \kappa _{z, 2} + \varPi (t) ,\end{align}
which leads to
 \begin{align} w_0 {{\mathcal{L}_z}} z_2 +w_0 (\partial _x z_1) ({{\partial _a}} u_1)+ 2 w_0 u_1 {{\partial _a}} \partial _x z_1 + w_1{{{\partial _a}}}^2 z_1 = & { w_0 \varGamma \partial _x z_1 \partial _{xxx} w_1} + \varPi (t), \end{align}
which corresponds to (3.2a ) with
 \begin{align} {{\mathcal{N}_{z}}}(z_1, w_1, u_1) =& { - (\partial _x z_1 )({{\partial _a}} u_1) - 2 u_1 {{\partial _a}}\partial _x z_1) } \nonumber \\ & { - \frac {w_1}{w_0}{{{\partial _a}}}^2 z_1 + \varGamma \partial _x z_1 \partial _{xxx} w_1 }. \end{align}
A.2.2 Order 2 in
$u$
and
$w$


The dynamical equation projected onto
 $w$
, at second order, is
 \begin{align} w_0{{\partial _a}} u_2\quad & \nonumber \\ + (w_1{{\partial _a}} + w_0 u_1\partial _x ) u_1 =& {w_0\varGamma \partial _{x} \kappa _{w, 2}} \nonumber \\ & {+ w_1\varGamma \partial _{x} \kappa _{w, 1}} \nonumber \\ & - \varGamma \kappa _{z, 1}(\partial _x z_1), \end{align}
on which we need to take the space derivative
 $-\partial _x$
(A32),
 \begin{align} {{\partial _a}} (-w_0\partial _x u_2)\quad & \nonumber \\ + w_1{{\partial _a}} (-\partial _x u_1) + u_1\partial _x (- w_0\partial _x u_1 ) + (\partial _x u_1)(-w_0 \partial _x u_1) = & {w_0\varGamma \partial _{xxxx} w_2 } \nonumber \\ & {- \varGamma \partial _x [ w_1 \partial _{xxx} w_1] } \nonumber \\ & + \varGamma \partial _x [ (\partial _{xx}z_1)(\partial _x z_1) ],\end{align}
after that we can replace using the appropriate expressions and obtain
 \begin{align} {{\mathcal{L}_w}} w_2 \quad & \nonumber \\ + {{\partial _a}} \partial _x (w_1 u_1) + w_0 {{\partial _a}} \partial _x[ (\partial _x z_1)\left (\left (\partial _t - \frac 12 u_0\right ) z_1\right ) ] \quad & \nonumber \\ + \frac {w_1}{w_0}{{{\partial _a}}}^2 w_1 + (\partial _x u_1 + u_1\partial _x)({{\partial _a}} w_1) = & {- \varGamma \partial _x [ w_1 \partial _{xxx} w_1] } \nonumber \\ & + \varGamma \partial _x [ (\partial _{xx}z_1)(\partial _x z_1) ], \end{align}
from which the definition of
 ${{\mathcal{N}_{w}}}(z_1, w_1, u_1)$
in (3.2b
) is immediate.
A.3
Third order in
${\epsilon }$
evolution equations

A.3.1 Third-order evolution equation for
$z$

The dynamical equation projected
 $e_z$
reads
 \begin{align} w_0{{\partial _a}} v_3 + w_0\partial _{{ \tilde T }} v_1 \quad & \nonumber \\ + (w_1{{\partial _a}} + w_0 u_1\partial _x ) v_2 \quad & \nonumber \\ + (w_2{{\partial _a}} + w_0 {{u_s}}_2\partial _x + w_1 u_1\partial _x) v_1 \quad & \nonumber \\ {-\frac 12 (\partial _x z_1)^2}w_0 u_0\partial _x v_1 =& -w_0 \mu v_1 - {\mu _{{cl}}} \partial _t z_1\nonumber \\ & {+ w_0\varGamma \partial _{x} \kappa _{w, 2}(\partial _x z_1)} {+ w_0\varGamma \partial _{x} \kappa _{w, 1}(\partial _x z_2)} \nonumber \\ & {+ w_1 \varGamma \partial _{x} \kappa _{w, 1}(\partial _x z_1)} \nonumber \\ & + \varGamma \kappa _{z, 3} - {\frac 12 (\partial _x z_1)^2\varGamma \kappa _{z, 1}}, \end{align}
which, after replacing using (A14), (A15) and (A16), leads to
 \begin{align} w_0{{\partial _a}} (\partial _{{ \tilde T }} z_1 + {{\partial _a}} z_3) + w_0\partial _{{ \tilde T }} {{\partial _a}} z_1 & \nonumber \\ +w_0 {{\partial _a}} \left (u_1\partial _x z_2 + u_2\partial _x z_1 + \partial _t z_1(\partial _x z_1)^2 + \frac 13 u_0 (\partial _x z_1)^3\right ) & \nonumber \\ + (w_1{{\partial _a}} + w_0 u_1\partial _x ) ({{\partial _a}} z_2 + u_1\partial _x z_1) & \nonumber \\ + (w_2{{\partial _a}} + w_0 \left (u_2 + \frac 12 u_0(\partial _x z_1)^2 + \partial _t z_1 \partial _x z_1\right )\partial _x & \nonumber \\ + w_1 u_1\partial _x) {{\partial _a}} z_1 & \nonumber \\ {-\frac 12 (\partial _x z_1)^2}w_0 u_0\partial _x {{\partial _a}} z_1 =& -w_0 \mu {{\partial _a}} z_1 - {\mu _{{cl}}} \partial _t z_1 \nonumber \\ & {+ w_0\varGamma \partial _{xxx}w_2(\partial _x z_1)} \nonumber \\ & {+ w_0\varGamma \partial _{xxx}w_1(\partial _x z_2)} \nonumber \\ & {+ w_1 \varGamma \partial _{xxx}w_1 (\partial _x z_1)} \nonumber \\ & + \varGamma \partial _{xx}z_3 - {\frac 12 (\partial _x z_1)^2\varGamma \partial _{xx}z_1} \nonumber \\ & -\frac 32 \varGamma [(\partial _x z_1)^2+(\partial _x w_1)^2/4]\partial _{xx}z_1 \nonumber \\ & - \frac 34 \varGamma (\partial _x z_1)(\partial _x w_1)\partial _{xx}w_1 . \end{align}
Using the properties of
 $z_2$
,
 $w_2$
and
 $u_2$
one obtains
 \begin{align} w_0 {{\mathcal{L}_z}} z_3 + 2 w_0\partial _{{ \tilde T }} {{\partial _a}} z_1 \quad & \nonumber \\ +w_0 {{\partial _a}} \left ( \partial _t z_1(\partial _x z_1)^2 \right ) + \frac 13 u_0 w_0 {{\partial _a}} (\partial _x z_1)^3 \quad & \nonumber \\ + w_1 \partial _{tt} z_2 + (w_1{{\partial _a}} + w_0 u_1\partial _x) (u_1\partial _x z_1) \quad & \nonumber \\ + (w_0\partial _t z_1 \partial _x z_1 + w_1 u_1) \partial _x {{\partial _a}} z_1 =& -w_0 \mu {{\partial _a}} z_1 - {\mu _{{cl}}} \partial _t z_1 \nonumber {+ w_1 \varGamma \partial _{xxx}w_1 (\partial _x z_1)} \nonumber \\ & - {\frac 12 (\partial _x z_1)^2\varGamma \partial _{xx}z_1} \nonumber \\ & -\frac 32 \varGamma [(\partial _x z_1)^2+(\partial _x w_1)^2/4]\partial _{xx}z_1 \nonumber \\ & - \frac 34 \varGamma (\partial _x z_1)(\partial _x w_1)\partial _{xx}w_1 . \\[12pt] \nonumber \end{align}
And considering only the terms susceptible to resonate, we write
 \begin{align} w_0 {{\mathcal{L}_z}} z_3 + 2 w_0\partial _{{ \tilde T }} {{\partial _a}} z_1 \quad & \nonumber \\ +w_0 {{\partial _a}} \left ( \partial _t z_1(\partial _x z_1)^2 \right ) + \frac 13 w_0 u_0 {{\partial _a}} (\partial _x z_1)^3 \quad & \nonumber \\ + 2w_1 u_1{{\partial _a}}\partial _x z_1 + w_0 {u_1}^2\partial _{xx}z_1 \quad & \nonumber \\ + w_0\partial _t z_1 \partial _x z_1 \partial _x {{\partial _a}} z_1 =& -w_0 \mu {{\partial _a}} z_1 - {\mu _{{cl}}} \partial _t z_1 - w_1 \partial _{tt} z_2 \nonumber \\ & - {\frac 12 (\partial _x z_1)^2\varGamma \partial _{xx}z_1} \nonumber \\ & -\frac 32 [(\partial _x z_1)^2+(\partial _x w_1)^2/4]\partial _{xx}z_1 \nonumber \\ & - \frac 34 (\partial _x z_1)(\partial _x w_1)\partial _{xx}w_1 . \end{align}
We now adopt use the complex expressions of our variables, we write the phase speed of transverse waves as
 $v_z = \omega _z / k_z$
, and the solvability condition becomes
 \begin{align} 2 w_0 [i k_z(v_z - u_0)]\partial _{{ \tilde T }} {{ \tilde Z }} \quad & \nonumber \\ -3 i w_0 v_z {k_z}^3 [i k_z(v_z - u_0)] {|{\tilde Z}|}^2 {{ \tilde Z }} \quad & \nonumber \\ - i w_0 u_0 {k_z}^3 [i k_z(v_z - u_0)] {|{\tilde Z}|}^2 {{ \tilde Z }} \quad & \nonumber \\ - 2i k_z [i k_z(v_z - u_0)] ({{ \tilde W }} {{ {{{ \tilde U }}}^* }} + {{ {{{ \tilde W }}}^* }}{{ \tilde U }}) {{ \tilde Z }} \quad & \nonumber \\ - 2 w_0 {k_z}^2 {|{\tilde U}|}^2{{ \tilde Z }} \quad & \nonumber \\ - 3i w_0 v_z {k_z}^3[i k_z(v_z - u_0)] {|{\tilde Z}|}^2 {{ \tilde Z }} =& -w_0 \mu [i k_z(v_z - u_0)] {{ \tilde Z }} - i {\mu _{{cl}}} v_z k_z {{ \tilde Z }} + {\omega _0}^2 {{ \tilde W }}{{ {{{ \tilde F }}}^* }} \nonumber \\ & - \frac 32 w_0 {v_{{c}}}^2 {k_z}^4 {|{\tilde Z}|}^2 {{ \tilde Z }} \nonumber \\ & -\frac 92 w_0 {v_{{c}}}^2 {k_z}^4 {|{\tilde Z}|}^2 {{ \tilde Z }} -\frac 34 w_0 {v_{{c}}}^2 {k_z}^2 {k_w}^2 {|{\tilde W}|}^2{{ \tilde Z }} \nonumber \\ & - \frac 32 w_0 {v_{{c}}}^2 {k_z}{k_w}^3 {|{\tilde W}|}^2 {{ \tilde Z }}. \end{align}
After some reordering it becomes
 \begin{align} 2 \partial _{{ \tilde T }} {{ \tilde Z }} =& -\mu \left ( 1- \frac {{\mu _{{cl}}}}{w_0 \mu } \frac {v_z}{u_0 - v_z}\right ) {{ \tilde Z }} + i\frac {1}{1-v_z/u_0} \frac {{\omega _0}^2}{w_0 u_0 k_z} {{ \tilde W }}{{ {{{ \tilde F }}}^* }} \nonumber \\& + i {k_z}^3 \left (u_0 + 6 v_z + 6\frac {{v_{{c}}}^2}{v_z - u_0}\right ) {|{\tilde Z}|}^2 {{ \tilde Z }} \nonumber \\& + i {k_w}^2 \left ( \left(\frac 32 k_w - \frac 14 k_z \right) \frac {{v_{{c}}}^2}{v_z - u_0} + 4 \varepsilon _w \frac {k_{z}}{k_w} \frac {{v_{{c}}}}{w_0}\right ) {|{\tilde W}|}^2 {{ \tilde Z }} . \end{align}
Now using that
 $v_z = u_0 + \varepsilon _z {v_{{c}}}$
, and anticipating that
 $k_z=k_w = k$
, we can obtain
 \begin{align} 2 \partial _{{ \tilde T }} {{ \tilde Z }} =& -\mu \left ( 1 + \varepsilon _z \frac {{\mu _{{cl}}}}{w_0 \mu } \left (\frac {u_0}{{v_{{c}}}} + \varepsilon _z\right )\right ) {{ \tilde Z }} - i \varepsilon _z \frac {{\omega _0}^2}{w_0 {v_{{c}}} k} {{ \tilde W }}{{ {{{ \tilde F }}}^* }} \nonumber \\ & + 7 i {k}^3 u_0 {|{\tilde Z}|}^2 {{ \tilde Z }} \nonumber \\ & + i {k}^2 {v_{{c}}} \left (- \varepsilon _z \frac 54 k + \frac {4 \varepsilon _w}{w_0}\right ) {|{\tilde W}|}^2 {{ \tilde Z }} . \end{align}
A.3.2 Third-order evolution equation for
$w$

The dynamical equation projected
 $e_x$
reads
 \begin{align} w_0{{\partial _a}} u_3 + w_0 \partial _{{ \tilde T }} u_1 & \nonumber \\ + (w_1{{\partial _a}} + w_0 u_1\partial _x ) u_2 & \nonumber \\ + (w_2{{\partial _a}} + w_0 {{u_s}}_2\partial _x + w_1 u_1\partial _x) u_1 & \nonumber \\ {-\frac 12 (\partial _x z_1)^2}w_0 u_0\partial _x u_1 =& -w_0 \mu u_1 \nonumber \\ & {+ w_0\varGamma \partial _{x} \kappa _{w, 3}} \nonumber \\ & {+ w_1\varGamma \partial _{x} \kappa _{w, 2}} {+ w_2\varGamma \partial _{x} \kappa _{w, 1}} \nonumber \\ & {- w_0\varGamma \partial _{x} \kappa _{w, 1}} (\partial _x z_1)^2 \nonumber \\ & - \varGamma \kappa _{z, 1}(\partial _x z_2) - \varGamma \kappa _{z, 2}(\partial _x z_1) \nonumber \\ & - \varPi (\partial _x z_1) . \end{align}
We then use that
 $w_0 {{\partial _a}}^2 z_2 = \varPi$
and compute
 $-\partial _x$
(A42)
 \begin{align} {{\partial _a}} (-w_0\partial _x u_3) + \partial _{{ \tilde T }} (-w_0\partial _x u_1) & \nonumber \\ -\partial _x w_1 \partial _t u_2 + \frac {w_1}{w_0}\partial _t (-w_0\partial _x u_2) & \nonumber \\ + \partial _x \left (\frac {u_0}{w_0}w_1 + u_1 \right ) (-w_0\partial _x u_2) & \nonumber \\ -\partial _x w_2 \partial _t u_1 + \frac {w_2}{w_0}\partial _t (-w_0\partial _x u_1) & \nonumber \\ + \partial _x \left (\frac {u_0}{w_0}w_2 + {{u_s}}_2 + \frac {1}{w_0}w_1 u_1\right ) (-w_0\partial _x u_1) & \nonumber \\ {-\frac 12 u_0 } \partial _x \left ( (\partial _x z_1)^2 (-w_0\partial _x u_1) \right ) =& - \mu (-w_0\partial _x u_1)\nonumber \\ & {- w_0\varGamma \partial _{xxxx} w_3} + \frac 32 w_0\varGamma \partial _{xx}((\partial _x w_1)^2\partial _{xx}w_1) \nonumber \\ & {- \varGamma \partial _x( w_1 \partial _{xxx} w_2 + w_2 \partial _{xxx} w_1)} \nonumber \\ & + w_0\varGamma \partial _x \left ( (\partial _{xxx} w_1) (\partial _x z_1)^2\right ) \nonumber \\ & + \varGamma \partial _x((\partial _{xx} z_1)(\partial _x z_2)) + \varGamma \partial _x((\partial _{xx} z_2)(\partial _x z_1)) \nonumber \\ & + w_0 \partial _x\left ( {{\partial _a}}^2 z_2 (\partial _x z_1)\right ). \end{align}
We now have to use the mass conservation (A21) and (A23) in order to obtain
 \begin{align} & {{\partial _a}} ({{\partial _a}} w_3 + \partial _{{ \tilde T }} w_1) + \partial _{{ \tilde T }} {{\partial _a}} w_1 \nonumber \\& + w_0 {{\partial _a}} \partial _x \left( u_1\frac 12 (\partial _x z_1)^2 + u_0\partial _x z_1\partial _x z_2 +\partial _t z_1\partial _x z_2+\partial _t z_2\partial _x z_1 \right) \nonumber \\& + {{\partial _a}} \partial _x \left(w_2 u_1 + w_1 u_2 + w_1{ \left[\frac 12 u_0 (\partial _x z_1)^2 + \partial _t{z_1}\partial _{x}z_1 \right]}\right) \nonumber \\&- {{\partial _a}} \left({\frac 12(\partial _x z_1)^2 (w_0\partial _x u_1 +u_0\partial _x w_1)}\right) \nonumber \\&-\partial _x w_1 \partial _t u_2 + \frac {w_1}{w_0}\partial _t (-w_0\partial _x u_2) \nonumber \\& + \partial _x \left(\frac {u_0}{w_0}w_1 + u_1 \right) (-w_0\partial _x u_2) \nonumber \\&-\partial _x w_2 \partial _t u_1 + \frac {w_2}{w_0}\partial _t {{\partial _a}} w_1 \nonumber \\& + \partial _x \left[ \left(\frac {u_0}{w_0}w_2 + {{u_s}}_2 + \frac {1}{w_0}w_1 u_1 \right) {{\partial _a}} w_1 \right] \nonumber \\& {-\frac 12 u_0 } \partial _x \big( (\partial _x z_1)^2 {{\partial _a}} w_1 \big) = - \mu {{\partial _a}} w_1 \nonumber \\& {- w_0\varGamma \partial _{xxxx} w_3} + \frac 32 w_0\varGamma \partial _{xx}\big((\partial _x w_1)^2\partial _{xx}w_1 \big) \nonumber \\& {- \varGamma \partial _x( w_1 \partial _{xxx} w_2 + w_2 \partial _{xxx} w_1)} \nonumber \\& + w_0\varGamma \partial _x ( (\partial _{xxx} w_1) (\partial _x z_1)^2) \nonumber \\& + \varGamma \partial _x((\partial _{xx} z_1)(\partial _x z_2)) + \varGamma \partial _x((\partial _{xx} z_2)(\partial _x z_1)) \nonumber \\& + w_0 \partial _x \big( {{\partial _a}}^2 z_2 (\partial _x z_1)\big) . \end{align}
We now use (A22) and do some simplifications to obtain
 \begin{align} \mathcal{L}_w w_3 + 2{{\partial _a}} \partial _{{ \tilde T }} w_1) \quad & \nonumber \\ + w_0 {{\partial _a}} \partial _x\left ( u_1\frac 12 (\partial _x z_1)^2 + \partial _x z_1 \partial _t z_2 \right ) \quad & \nonumber \\ + {{\partial _a}} \partial _x\left ( w_1{\left [\frac 12 u_0 (\partial _x z_1)^2 + \partial _t{z_1}\partial _{x}z_1\right ]}\right ) \quad & \nonumber \\ - {{\partial _a}} \left ({\frac 12(\partial _x z_1)^2 (-\partial _t w_1)}\right ) \quad & \nonumber \\ + \partial _x \left [\left (\frac 12 u_0(\partial _x z_1)^2 + \partial _t z_1 \partial _x z_1 + \frac {1}{w_0}w_1 u_1\right ) {{\partial _a}} w_1 \right ] \quad & \nonumber \\ {-\frac 12 u_0 } \partial _x \left ( (\partial _x z_1)^2 {{\partial _a}} w_1\right ) =& - \mu {{\partial _a}} w_1 \nonumber \\ & + \frac 32 w_0\varGamma \partial _{xx}\left ((\partial _x w_1)^2\partial _{xx}w_1\right ) \nonumber \\ & + w_0\varGamma \partial _x \left ( (\partial _{xxx} w_1) (\partial _x z_1)^2\right ) \nonumber \\ & + w_0 \partial _{xx} z_1 \partial _{tt} z_2 . \end{align}
Finally, we use the complex expressions of
 $z_1$
,
 $w_1$
and
 $z_2$
, with
 ${{\partial _a}} w = i (\omega _w - u_0 k_w) = \varepsilon _w i {v_{{c}}} k^2 w_0$
:
 \begin{align} (\varepsilon _w i {v_{{c}}} k^2 w_0) 2 \partial _{{ \tilde T }} W) \quad & \nonumber \\ +(\varepsilon _w i {v_{{c}}} k^2 w_0) (-ik)\left ( u_0 W\frac 12 {|kZ|}^2 + w_0 (-ik) Z (i\omega _0) F \right ) \quad & \nonumber \\ + (\varepsilon _w i {v_{{c}}} k^2 w_0) (-ik)\left ( W {\left [\frac 12 u_0 {|kZ|}^2 + v_z {|kZ|}^2\right ]}\right ) \quad & \nonumber \\ + (\varepsilon _w i {v_{{c}}} k^2 w_0) \left ({\frac 12 {|kZ|}^2 i\omega _w W}\right ) \quad & \nonumber \\ + (-ik) (\varepsilon _w i {v_{{c}}} k^2 w_0) \left (\frac 12 u_0 {|kZ|}^2 - v_z {|kZ|}^2 + \frac {u_0}{{w_0}^2}{|W|}^2\right ) W \quad & \nonumber \\ +\frac 12 u_0 (\varepsilon _w i {v_{{c}}} k^2 w_0) (ik) {|kZ|}^2 W =& - (\varepsilon _w i {v_{{c}}} k^2 w_0) \mu w_1 \nonumber \\ & + \frac 32 w_0\varGamma k^6 {|W|}^2 W \nonumber \\ & + w_0\varGamma {|kZ|}^2 k^4 W \nonumber \\ & + w_0 k^2 {\omega _0}^2 F Z .\end{align}
We finally obtain
 \begin{align} 2\partial _{{ \tilde T }} {{ \tilde W }} =& - \mu {{ \tilde W }} - i \varepsilon _w k \omega _0 \left ( \frac {{\omega _0}}{k {v_{{c}}}} -\varepsilon _w w_0 k \right ) {{ \tilde F }} {{ \tilde Z }} \nonumber \\ & -\varepsilon _w 2i w_0 k^2 {v_{{c}}} {|k{{ \tilde Z }}|}^2 {{ \tilde W }} + i \left ( k\frac {u_0}{{w_0}^2} -\varepsilon _w \frac 32 w_0 {v_{{c}}} k^4 \right ) {|{\tilde W}|}^2 {{ \tilde W }} \end{align}
which corresponds to (3.5b ).