Introduction
Goats constitute the largest group of small ruminant livestock in Nigeria totalling about 53.8 million and also constituting 6.2 percent of the World's goat population (FAOSTAT, 2011). Surveys have shown that up to 85 percent of rural households, poor farmers and small-time business people of all age groups and sexes keep them (FDLPCS, 2007). The ability of goats to tolerate harsh climates, the presence of trypanotolerance in some breeds (Salako, Reference Salako2004), suitability to traditional systems on account of small size, short generation interval (Abdul-Aziz, Reference Abdul-Aziz2010) and ability to thrive on poor quality diets provided by scarce grazing on marginal lands (Adedeji et al., Reference Adedeji, Ozoje, Peters, Sanusi, Ojedapo and Ige2011) all combine to make small ruminants strategic to increasing livestock productivity in rural agricultural systems (Adebambo et al., Reference Adebambo, Williams, Blott and Urquhart2004; Adedeji et al., Reference Adedeji, Ozoje, Peters, Sanusi, Ojedapo and Ige2011). Despite these advantages, little attention had been paid to the genetic characterization and possible improvement of small ruminants in Nigeria. Several reports on performance characteristics have been published by Odubote and Akinokun (Reference Odubote and Akinokun1992), Odubote (Reference Odubote1994a, Reference Odubote, Lebbie and Kagwinib), Ebozoje and Ngere (Reference Ebozoje and Ngere1995), Ozoje (Reference Ozoje1998) and Imumorin, Ologun and Oyeyemi (Reference Imumorin, Ologun and Oyeyemi1999). While earlier reports attempted to study genetic variation of haemoglobin (Buvanendran et al., Reference Buvanendra, Sooriyamoorthy, Ogunsusi and Adu1981; Imumorin, Ologun and Oyeyemi, Reference Imumorin, Ologun and Oyeyemi1999) and transferrin types in goats (Moruppa, Reference Moruppa1985), a very recent report reported genetic distance of 0.39 between Red Sokoto (RS) and West African Dwarf (WAD) goats in southwestern Nigeria using microsatellite DNA markers using a relatively small sample size of 138 animals (Adebambo et al., Reference Adebambo, Adebambo, Williams, Blott and Urquart2011).
Genetic improvement of indigenous breeds of livestock is very valuable because of high adaptability to harsh environmental conditions of nutrition, climate and disease compared with exotic breeds (Fitzhugh, Ehui and Lahlou-Kassi, Reference Fitzhugh, Ehui and Lahlou-Kassi1992). According to Groeneveld et al. (Reference Groeneveld, Lenstra, Eding, Toro, Scherf, Pilling, Negrini, Finlay, Jianlin, Groeneveld and Weigend2010) many breeds of livestock may become lost germplasm in many third world countries due to crossing with exotics, which in addition to uncontrolled breeding in extensive management systems pose a great risk for the loss of valuable genes. To better understand natural genetic variation in native goats as well as formulate conservation policies, better genetic characterization is required to balance the competing needs of genetic improvement and conservation of native germplasm to preserve the age-long relationship between native livestock and dwellers in rural agricultural systems (Groeneveld et al., Reference Groeneveld, Lenstra, Eding, Toro, Scherf, Pilling, Negrini, Finlay, Jianlin, Groeneveld and Weigend2010). However, there is very little baseline information on the extent of natural genetic variation in Nigerian goats. This project was therefore aimed at assessing genetic diversity of indigenous Nigerian goats in southern Nigeria using ten microsatellite DNA markers in a sample size larger than Adebambo et al. (Reference Adebambo, Adebambo, Williams, Blott and Urquart2011) in three extant goat breeds. The results of this regional study provide additional preliminary data to support more extensive molecular characterization of small ruminants in Nigeria covering the entire country.
Materials and methods
Animals and DNA extraction
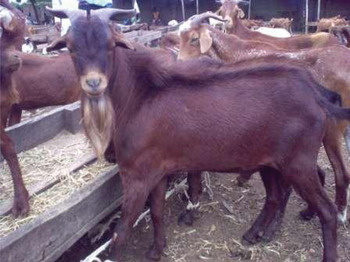
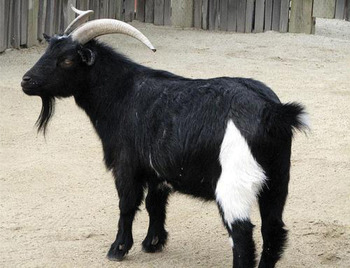
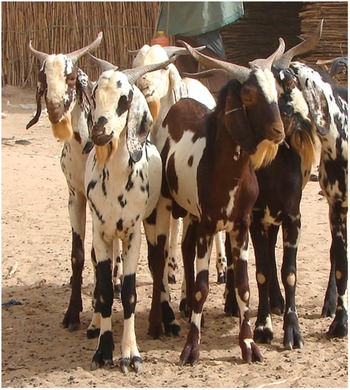
A total of 295 samples made up of 128 WAD (Figure 1), 131 RS (Figure 2) and 36 Sahel (SA; Figure 3) goats were sampled across southern Nigeria from Ogun, Oyo, Delta and Rivers States between latitude 04°48′N and 07°10′N, longitude 03°52′E and 07°92′E at an elevation of between 115 and 122 m above sea level. About 10 ml of whole blood was collected from the jugular vein into vacutainer tubes with Ethylenediaminetetraacetic acid (EDTA) and stored at 4 °C and transported to the laboratory. Genomic DNA was extracted using MasterPure DNA extraction kit (Epicenter Biotechnologies, Madison, WI, USA) according to the manufacturer's instructions. The research protocol was approved by the Institutional Animal Care and Use Committee of the University of Agriculture, Abeokuta.
West African Dwarf goat.

Red Sokoto goat.

Sahel goat.

Microsatellite markers and genotyping
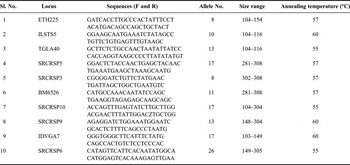
Ten microsatellites used in this study were randomly chosen from the FAO-recommended list (http://dad.fao.org; Hoffmann et al., Reference Hoffmann, Marsan, Barker, Cothran, Hanotte, Lenstra, Milan, Weigend and Simianer2004) and are presented in Table 1. PCR amplification was carried out in a 25 µl of total volume reaction mixture containing approximately 50 ng of goat genomic DNA, 2.5 mM dNTPs, 2.5 µl of 10 × PCR buffer, 5 µl of red juice dye, 11.5 µl of deionized water, 1 µl of each of the appropriately fluorescently labelled forward and reverse primers, 0.5 µl of Taq polymerase (1:10 dilution in H2O of stock). The cycling conditions were: initial denaturation step 94 °C for 3 minutes, 35 cycles of denaturation at 94 °C for 30 seconds, 55, 57 or 60 °C for 30 seconds (varied with annealing temperature of markers) and 72 °C for 45 seconds, followed by a final extension step at 72 °C for 4 minutes. The PCR products were multiplexed and genotyped using an Applied Biosystems 3100 Genetic Analyzer and bands were analysed using Peakscanner® software (Applied Biosystems, Foster City, CA, USA).
Characteristics of microsatellite markers used in this study.

Statistical analysis
Polymorphism information content (PIC) for each microsatellite marker was calculated using CERVUS software (Marshall, Reference Marshall1998). Population statistics were estimated using Tools for Population Genetic Analyses (TFPGA) software version 1.3 (Miller, Reference Miller1997) and FSTAT version 2.9.3 (Goudet, Reference Goudet2001). Analysis of molecular variance (AMOVA) was done using GenAlEx 6.3 (Peakall and Smouse, Reference Peakall and Smouse2006). The analyses included allele frequencies, expected heterozygosity (H E), observed heterozygosity (H O) and Hardy–Weinberg equilibrium (HWE). For the analysis of genetic differentiation between populations, Wright's fixation indices were computed by bootstrapping with a 95% confidence interval based on 1 000 replicates. Additionally, F-statistics covering F IS, consanguinity or loss in heterozygosity within population; F ST, measure of differentiation among populations, and F IT global loss in heterozygosity and exact test of Hardy–Weinberg proportion for multiple alleles (Guo and Thompson, Reference Guo and Thompson1992) were estimated using the Markov Chain procedure (10 batches, 1 000 iterations, 1 000 de-memorization steps) implemented in F-STAT version 2.9.3 (Goudet, Reference Goudet2001). Both genetic distance (D A) estimated according to the method of Nei (Reference Nei1978) and the unweighted pair group method with arithmetic mean (UPGMA) for dendogram construction were carried out using TFPGA version 1.3 (Miller, Reference Miller1997).
Results
Characteristics of microsatellite DNA markers
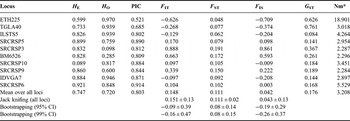
A detailed description of the ten microsatellite markers used in this study is presented in Table 1. A total of 140 alleles were generated with the number of alleles per locus ranging from 8 for ETH225 and SRCRSP3 to 26 for SRCRSP6. Table 2 summarizes details of gene diversity indicated by H E which ranged from 0.599 for ETH225 to 0.921 for SRCRSP6. The PIC ranged from 0.521 for ETH225 to 0.914 for SRCRSP6. The F IT values ranged from −0.097 for IDVGA7 to 0.888 for SRCRSP3. The F ST values ranged from 0.048 for ETH225 to 0.191 for SRCRSP3. Fixation index (F IS) values ranged from −0.003 for SRCRSP 6 to 0.861 for SRCRSP3. Markers ETH225, TGLA40, ILSTS5, SRCRSP10 and IDVGA7 had negative F IS values, while SRCRSP5, SRCRSP3, SRCRSP6 SRCRSP9 and BM6526 had positive F IS values. In our data, G ST which indicates that genetic differentiation ranged from 0.144 for IDVGA7 to 0.761 for TGLA40. Analysis of markers' usefulness showed that markers TGLA40, ETH225, SRCRSP3, BM 6526, SRCRSP9 and SRCRSP10 had G ST values higher than the mean (Table 2). On the other hand, markers ILSTS5, IDVGA7 and SRCRSP6 had G ST values that were lower than the mean (0.084, 0.144 and 0.168, respectively), while gene flow (N m) ranged from 2.284 for SRCRSP9 to 18.901 for ETH225.
Heterozygosity, polymorphic information content, F-statistics and gene flow.

*Nm, gene flow estimated from F st = 0.25(1 − F st)/F st.
H E, expected heterozygosity; H O, observed heterozygosity; PIC, polymorphic information content; F IT, amount of inbreeding like effect within entire population; F ST, amount of variations due to differentiation between subpopulations; F IS, amount of inbreeding like effect among individuals within subpopulations; G ST, coefficient of gene differentiation; CI, confidence interval.
Population structure and genetic diversity
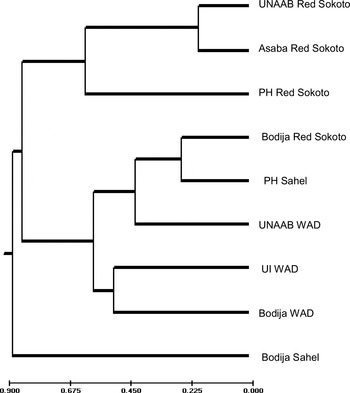
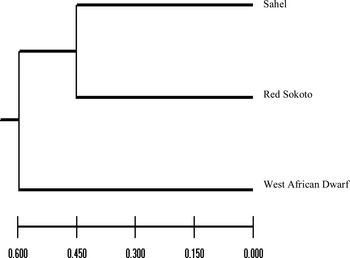
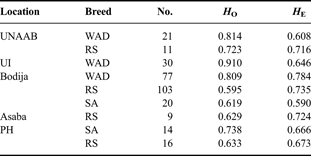
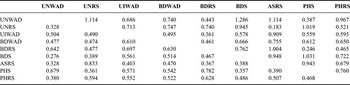
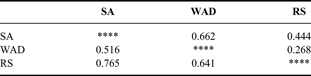
H E within breeds is described locus by locus in Table 3. Table 4 shows average genetic diversity among breeds by location, while Table 5 shows the estimated analysis of molecular variation for within and among populations sampled. Results showed that two sub-populations of RS from Abeokuta and Asaba are more related (0.833) than all others, while genetic diversity was greatest between populations of WAD from Abeokuta and SA from Ibadan (1.286). Genetic distance matrix of the three different breeds (Tables 6 and 7) showed that WAD goats shared about 52% similarity and about 66% diversity with SA goats, and about 64% similarity and 44% diversity from RS goats. Figures 4 and 5 also showed that the SA goat and the WAD populations have the greatest diversity, while the RS is genetically midway between these two breeds.
UPGMA dendrogram showing degree of diversity among goat populations in southern Nigeria.

UPGMA dendrogram showing degree of diversity in Nigerian goats in southern Nigeria.

Measure of gene diversity in studied populations.

Average genetic diversity among breeds by location.
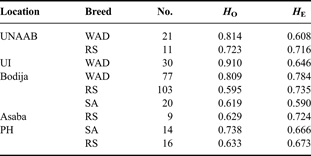
No., number of individual goats sampled; H O, observed heterozygosity; H E, expected heterozygosity.
AMOVA of populations.

Genetic distance matrix showing genetic identity and diversity by breed and location.

Nei (1978) genetic distance matrix. Genetic identity is below the diagonal, genetic diversity is above the diagonal.
UNWAD, UNAAB WAD; UNRS, UAAB Red Sokoto goat; UIWAD, UI WAD; BDWAD, Bodija WAD; BDRS, Bodija Red Sokoto goat; BDS, Bodija Sahel; ASRS, Asaba Red Sokoto goat; PHS, PH Sahel; PHRS, PH Red Sokoto goat.
Genetic distance matrix showing genetic identity and diversity by breed.
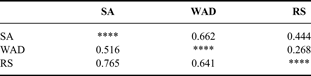
Nei's (1978) genetic distance matrix. Genetic identity is entered below the diagonal, genetic diversity is entered above the diagonal.
Discussion
Microsatellite markers used in this study are similar to Rout et al. (Reference Rout, Joshi, Mandal, Laloe, Singh and Thangaraj2008) for diversity in Indian goats. All loci studied were polymorphic as indicated by the PIC range between 0.521 and 0.914 with a mean PIC of 0.803. Since Takezaki and Nei (Reference Takezaki and Nei1996) suggested that microsatellite loci for genetic diversity studies should have more than four alleles to reduce the standard error estimates of genetic distances, the total numbers of alleles per locus and high PIC values suggest that these markers are informative for genetic diversity in Nigerian goats and that Nigerian goats possess a wide genetic base that allows for adaptation to a wide variety of ecological environments. Allelic richness in Nigerian goats of 8–26 is higher than Indian goats (8.1–9.7) by Rout et al. (Reference Rout, Joshi, Mandal, Laloe, Singh and Thangaraj2008), average of 7.3 in Iranian goats (Mahmoudi et al., Reference Mahmoudi, Bayat, Sadeghi, Babayev and Abdollahi2010), and average of 5.9 in Canary Island goats (Martínez et al., Reference Martínez, Acosta, Vega-Pla and Delgado2006), but lower than in Spanish Guadarrama goats with 9–36 (Serrano et al., Reference Serrano, Calvo, Martínez, Marcos-Carcavilla, Cuevas, González, Jurado and de Tejada2009). Gene diversity indicated by H E had a range of 0.599 for ETH225 to 0.921 for SRCRSP6, which was higher than 0.54 reported by Muema et al. (Reference Muema, Wakhungu, Hanotte and Jianlin2009), 0.51 reported by Adebambo et al. (Reference Adebambo, Adebambo, Williams, Blott and Urquart2011) in Nigerian goats, and essentially overlapped the H E values of 0.61–0.783 in Indian goats (Rout et al., Reference Rout, Joshi, Mandal, Laloe, Singh and Thangaraj2008; Dixit et al., Reference Dixit, Verma, Aggarwal, Vyas, Rana, Sharma, Tyagi, Arya and Ulmek2010) using the same markers. Literature estimates for mean heterozygosity were 0.70 across all 25 microsatellite loci in six Portuguese goat breeds (Bruno-de-Sousa et al., Reference Bruno-de-Sousa, Martinez, Ginja, Santos-Silva, Carolino, Delgado and Gama2011), 0.72 for Egyptian goats (Agha et al., Reference Agha, Pilla, Galal, Shaat, D'Andrea, Reale, Abdelsalam and Li2008), 0.63–0.69 in South African goats (Visser et al., Reference Visser, Hefer, van Marle-Köster and Kotze2004), 0.68 in the Brown Short haired goat in the Czech Republic (Jandurova et al., Reference Jandurova, Kott, Kottova and Czernekova2004), 0.611–0.84 for Chinese goats (Qi et al., Reference Qi, Luo, Han, Zhu, Chen, Liu and Sheng2009) and 0.61–0.77 in Spanish Guadarrama goats (Serrano et al., Reference Serrano, Calvo, Martínez, Marcos-Carcavilla, Cuevas, González, Jurado and de Tejada2009). The Nigerian value also significantly departed from the mean of 0.69 in a large group of goat breeds from Europe and the Near East (Cañon et al., Reference Cañon, García, García-Atance, Obexer-Ruff, Lenstra, Ajmone-Marsan and Dunner2006). However, some loci had H O lower than their expected values [SRCRSP5 (0.759), SRCRSP3 (0.098), BM6526 (0.285), SRCRSP9 (0.600) and SRCRSP6 (0.848)] indicating departure from random mating which suggest that they are homozygous in these populations and may indicate on-going selection or may be linked to other loci affecting morphological, productive or adaptive traits undergoing selection (Dixit et al., Reference Dixit, Verma, Ahlawat, Aggarwal, Kumar, Chander and Singh2008; Bruno-de-Sousa et al., Reference Bruno-de-Sousa, Martinez, Ginja, Santos-Silva, Carolino, Delgado and Gama2011) or result from mating between relatives and consequent genetic drift, similar to what has been observed in many other goat populations (Agha et al., Reference Agha, Pilla, Galal, Shaat, D'Andrea, Reale, Abdelsalam and Li2008; Rout et al., Reference Rout, Joshi, Mandal, Laloe, Singh and Thangaraj2008; Dixit et al., Reference Dixit, Verma, Aggarwal, Kumar, Chander, Vyas and Singh2009). Observed F IT values ranged from −0.097 for IDVGA7 to 0.888 for SRCRSP3. Increasing F IT values suggest some measure of homozygosity and heterozygote deficit resulting from relatedness of individuals which may be a consequence of the emergent population structure of Nigerian goats, not previously uncovered by protein polymorphisms based on haemoglobin and transferrin. The presence of negative F IS values at loci ETH225, TGLA40, ILSTS5, SRCRSP10 and IDVGA7 suggests heterozygote deficiencies which have also been reported in other studies on goats (Barker et al., Reference Barker, Moore, Hetzel, Tan and Byrne1997; Luikart et al., Reference Luikart, Biju-Duval, Ertugrul, Zagdsuren, Maudet and Taberlet1999; Agha et al., Reference Agha, Pilla, Galal, Shaat, D'Andrea, Reale, Abdelsalam and Li2008; Rout et al., Reference Rout, Joshi, Mandal, Laloe, Singh and Thangaraj2008; Dixit et al., Reference Dixit, Verma, Aggarwal, Kumar, Chander, Vyas and Singh2009). This heterozygote deficiency may arise due to population sub-structure from pooling together different populations (admixture) in the analysis (Cerda-Flores et al., Reference Cerda-Flores, Villalobos-Torres, Barrera-Saldaña, Cortés-Prieto, Barajas, Rivas, Carracedo, Zhong, Barton and Chakraborty2002; Muema et al., Reference Muema, Wakhungu, Hanotte and Jianlin2009). Additional factors include population subdivision owing to genetic drift, null alleles and selection against heterozygotes or inbreeding (Hoarau et al., Reference Hoarau, Boon, Jongma, Ferber, Palsson, Van der Veer, Rijnsdorp, Stam and Olsen2005). Although loci SRCRSP3 and BM6526 showed the highest F IS values indicating fixation of these loci, distinguishing among these factors is generally difficult according to Christiansen et al. (Reference Christiansen, Frydenberg, Gyldenholm and Simonsen1974). The F ST values ranged from 0.048 for ETH225 to 0.191 for SRCRSP3. Low F ST indicates some measure of gene flow between the sampled populations, with ETH225 locus recording the highest gene flow of 18.90. Mujibi (Reference Mujibi2005) reported a low F ST of 5.8% for WAD goats in Kenya; therefore, gene flow estimates in this study suggest mobility and considerable exchange of genetic material among these goats. These could be attributed to the fact that some of these animals originate from northern Nigeria where nomadic pastoralism is the dominant livestock management system and to extensive system of management allowing the animals to roam freely and fend for themselves in most rural households and communities in the South. This enables and reinforces the ability of related animals to meet on pasture to breed or for neighbours to exchange related animals for upkeep or breeding. According to Laval et al. (Reference Laval, Iannuccelli, Legault, Milan, Groenen, Giuffra, Andersson, Nissen, Jorgensen, Beeckmann, Geldermann, Foulley, Chevalet and Ollivier2000), migration may exert a greater effect than mutation or drift on the reduction in genetic differentiation between populations.
Molecular genetic variation was observed to be higher within populations than among populations, which suggest high heterogeneity within populations sampled. The WAD goat stood out clearly as a breed while RS and SA showed a measure of close relationship (Figures 4 and 5). Regardless of location, RS and WAD goats clustered close together, while exhibiting a sharp difference between SA. Toro and Maki-Tanila (Reference Toro, Maki-Tanila and Oldenbroek2007) suggested that the high genetic diversity observed within population groups could arise from overlapping generations and population mixtures from different geographical locations, with natural selection favouring heterozygosity or subdivision accompanied by genetic drift. The effect of these factors according to Agha et al. (Reference Agha, Pilla, Galal, Shaat, D'Andrea, Reale, Abdelsalam and Li2008) is more pronounced when the effective population size is very large, which is supported by the poor infrastructure on ground presently for livestock improvement and lack of proper breeding policy in Nigeria. The genetic distance between SA and RS goats was the closest, while the genetic distance between SA and WAD the farthest. Genetic distance of 0.27 in this study was lower than 0.39 reported earlier between RS and WAD goats by Adebambo (Reference Adebambo2003) from a smaller sample drawn from several states across Nigeria, which may indicate a higher level of cross-breeding among goats in southern Nigeria concomitant with higher population of humans and by extension higher population density of reared goats.
Conclusion
The use of molecular marker techniques will greatly increase precision of breeding for useful traits and reduce the amount of time spent in selection (Groeneveld et al., Reference Groeneveld, Lenstra, Eding, Toro, Scherf, Pilling, Negrini, Finlay, Jianlin, Groeneveld and Weigend2010). This knowledge is important to enable the development of appropriate breeding policies and strategies to improve indigenous goat breeds and serve as reference for larger-scale diversity studies. The close clustering of SA and RS is most likely due to the fact that they are both Northern breeds and are transported to the south for sale, while WAD is confined to the southern part of the country. Better understanding of the origins of these breeds will benefit from using additional microsatellite DNA markers, as well as those based on mitochondrial DNA variation.
Statement of Interest: The authors declare that there are no conflicting or competing interests.
Acknowledgements
We gratefully acknowledge the financial support from United States Agency for International Development (USAID) through the award of the Norman Borlaug Leadership Enhancement in Agriculture Program (LEAP) Fellowship to Moses Okpeku. The assistance of University of Agriculture Teaching and Research Farm, University of Ibadan Teaching and Research Farm and the Bodija Market Abattoir, Ibadan management with blood collection are gratefully acknowledged. We also thank the Department of Molecular and Cell Biology, University of Connecticut-Storrs and Department of Cell Biology and Genetics, University of Lagos for use of laboratory facilities.