Introduction
Household income is regularly used to measure child poverty (Bradbury, Reference Bradbury2003; White et al., Reference White, Leavy and Masters2003), chiefly because income can be measured continuously over time. However, measures based on household income, usually creating ‘poverty lines’, have some major limitations (Gordon, Reference Gordon, Pantazis, Gordon and Levitas2006; Middleton and Adelman, Reference Middleton, Adelman and Bradshaw2003; Saunders and Naidoo, Reference Saunders and Naidoo2009). They lack comprehensiveness; they do not reflect other sources of income, such as inheritance or resources that are borrowed or given by friends and family. They overlook the needs of complex families (e.g., household members with special needs). Furthermore, they provide only a narrow picture of people's lives as they do not reflect disadvantage circumstance in a broader sense than economics. With regard to children, household income has even more limitations given that we know little of how income is distributed within the household (Main and Bradshaw, Reference Main and Bradshaw2012).
Thus, additional measures are needed to understand the material status of children. This paper seeks to fill this gap by adapting two approaches, developed originally for adults, to the situation of children. The first is the ‘socially perceived necessities’ approach, based on the relativity and consensus theories (Saunders et al., Reference Saunders, Naidoo and Griffiths2008), which has only recently begun to be used in a child-centered way (Main, Reference Main2013). The second is the ‘social exclusion’ framework, which has often been used together with income poverty (Burchardt et al., Reference Burchardt, Grand and Piachaud1999) but has rarely been used alone and to our knowledge has never been used from a child's perspective. The paper begins by reviewing literature on the two approaches, and their importance when considering children, before briefly describing the setting and methods of the study. Later, as our main aim was to develop new measures, the findings will focus mostly on examining the reliability and validity of these measures, showing a few examples of the results. We conclude with a discussion of the advantages and limitations of the measures as well as their implications for policy.
The socially perceived necessities approach
Townsend (Reference Townsend1979) was the first to develop a material deprivation index. Based on the relative theory of poverty, he argued that ‘people's needs, even for food, are conditioned by the society to which they belong’ (p. 38). His ‘material deprivation’ measure attempts to reflect the customs and social activities that the majority of a population in a particular society considers as basic needs (p. 59). Mack and Lansley (Reference Mack and Lansley1985) advanced Townsend's theories and proposed the term ‘socially perceived necessities’, claiming ‘items become “necessities” only when they are socially perceived to be so’ (p. 38). They argued that ‘social perception’ calls for putting aside individual feeling and focusing on the judgment of society as a collective. They created a list of items that one-half or more in a survey thought were necessities and then asked people if they actually had those necessities. Interestingly, it was found a consensus often emerges around these necessities (Halleröd, Reference Halleröd1995; Saunders et al., Reference Saunders, Naidoo and Griffiths2008; Dickes et al., Reference Dickes, Fusco and Marlier2010).
However, while a consensus is often reached, studies have found differences between children and adults on this subject (Barnes and Wright, Reference Barnes, Wright, Minujin and Nandy2010; Middleton and Adelman, Reference Middleton, Adelman and Bradshaw2003; Swords et al., Reference Swords, Greene, Boyd and Kerrins2011). Furthermore, as it is important to give children a voice and solicit their participation (Ben-Arieh, Reference Ben-Arieh2005; Prout and James, Reference Prout, James, James and Prout1997; Qvortrup et al., Reference Qvortrup, Bardy, Sgritta and Wintersberger1994; Qvortrup, Reference Qvortrup, Mouritsen and Qvortrup2002), more insight is needed on the socially perceived necessities from a child-centered perspective. Only a few such attempts have occurred to date (Main and Bradshaw, Reference Main and Bradshaw2012; Noble et al., Reference Noble, Wright and Cluver2006; Swords et al., Reference Swords, Greene, Boyd and Kerrins2011).
The social exclusion framework
The concept of social exclusion, presented by René Lenoir in the 1970s, refers to the most marginalised groups in society, those who lack basic citizenship rights and fall outside the social protection system (Castel, Reference Castel1995; Evans et al., Reference Evans, Walraven, Parsons, van Veen, Day, Walraven, Parsons, van Veen and Day2000; Paugam, Reference Paugam1996). Gradually, the meaning of the term has broadened to include the dynamic process that denies people benefits enjoyed by the majority and that affects their place in the community (Lee et al., Reference Lee, Murie and Britain1999).
The literature on social exclusion addresses three main themes. The first is the process that produces inequality (Levitas, Reference Levitas1998: 14), the dynamics and experiences that are part of a disadvantaged life (Room, Reference Room1998). The second is the environmental and social contexts, which refer to one's position in relation to the services and resources provided by a range of organisations and institutions in the local community (Lee et al., Reference Lee, Murie and Britain1999; Room, Reference Room1998; Saunders, Reference Saunders2003). The third theme is the relational nature of exclusion, as it is embedded in one's relationship with one's environment. Sen (Reference Sen2000) claims social exclusion emphasises the role of relational features in the deprivation of capabilities. The focus on relational issues draws attention to aspects of inadequate participation as well as lack of social integration and power (Room, Reference Room1998).
Although social exclusion is a widely used term, there is no consensus on its meaning (Levitas, Reference Levitas, Pantazis, Gordon and Levitas2006; Micklewright, Reference Micklewright2002) and many difficulties in its operationalisation and measurement exist (Atkinson and Hills, Reference Atkinson and Hills1998; Burchardt et al., Reference Burchardt, Grand and Piachaud1999). Yet, growing awareness of the concept of social exclusion offers an opportunity to enrich our knowledge of disadvantaged lives. Already some attempts have been made to measure social exclusion in a focused comprehensive way (Social Exclusion Task Force, 2009). This study seeks to further utilise the concept of social exclusion by measuring social exclusion from children's viewpoint.
Social exclusion has not been extensively studied from the perspective of children (Micklewright, Reference Micklewright2002), even though, in many cases, children are excluded from basic activities that define membership in a culture or a society (Aber et al., Reference Aber, Gershoff and Brooks-Gunn2001; Evans et al., Reference Evans, Walraven, Parsons, van Veen, Day, Walraven, Parsons, van Veen and Day2000). This lack of attention may be owing, in part, to the tendency of the social exclusion approach to focus on labour market exclusion, an adult realm (Levitas, Reference Levitas, Pantazis, Gordon and Levitas2006; Ridge, Reference Ridge2002). Yet, social exclusion also affects the well-being of children because social interactions are important for children in developing their social identity and enlarging their social capital (Ridge, Reference Ridge2002: 59).
The British survey, ‘Poverty and Social Exclusion (PSE)’, made a rare attempt to measure social exclusion among children, while still using adults as proxies. This study used three measures: (1) exclusion from social activities, (2) exclusion from local services for children, and (3) exclusion from school resources (Middleton and Adelman, Reference Middleton, Adelman and Bradshaw2003). Other theoretical frameworks add more dimensions, such as (1) the ability to afford basic living expenses, (2) family economic participation, (3) housing, (4) health, and (5) the subjective experience of exclusion (Aber et al., Reference Aber, Gershoff and Brooks-Gunn2001). However, as Aber et al. (Reference Aber, Gershoff and Brooks-Gunn2001) indicate, these dimensions are intertwined with society's values. Accordingly, it is important when studying the social exclusion of children to maintain an awareness of the context of the specific society, as we do here.
The Israeli context
Israeli society is complex with multiple social and religious conflicts (Jamal, Reference Jamal2002; Yonah, Reference Yonah2005). One of the main complexities involves the Jewish–Arab national conflict. In addition to the national dispute, Arabs are often marginalised in Israeli society, suffering unequal rights and disadvantages (Al-Haj, Reference Al-Haj2002; Okun and Friedlander, Reference Okun and Friedlander2005; Soen, Reference Soen2005: 137). Another complex conflict exists between secular Jews and very religious Jews, the ultra-orthodox (Ravitzki, Reference Ravitzki1997). The ultra-orthodox have larger families and live in much poorer conditions than the rest of Jewish society, and they are usually located in separate communities (Berman, Reference Berman2000; Friedman, Reference Friedman1991). Israel is also an immigrant society. Immigrants tend to live in much less affluent conditions, mainly because of employment difficulties (Eckstein and Weiss, Reference Eckstein and Weiss2004; Raijman and Semyonov, Reference Raijman and Semyonov1995).
Within this unique context of Israel, more sensitive measures than income are needed to identify children living with material disadvantages that might have a major effect on their lives. The social necessities approach and the framework of social exclusion, each with a different focus, provide potential to broaden, and possibly improve, measurement.
Goals and questions
This study had two goals: (1) to develop a material deprivation index and (2) to develop a social exclusion measure for children. The study also addressed the following questions:
• Is it possible to develop a reliable and valid measure of material deprivation and similarly of social exclusion for children?
• Is it possible to set cut-off points for each measure? If so, how many children in Israel are materially deprived and socially excluded?
• Using these measures, what can we learn about the life of children in Israel? For example, what is the effect of a child's background (i.e., gender, nationality,Footnote 1 religiosity, and birth country) on the outcomes of these measures?
• What is the relationship between the two measures? Does each make a unique contribution?
Method
The study was conducted in two phases. First, we developed a new measure for material deprivation and a new measure for social exclusion. Next, we tested these measures with data from a large-scale survey, ISCWeB, the International Survey of Children's Well-BeingFootnote 2 among children in Israel, in an attempt to verify the measures’ validity, reliability and usefulness. The material deprivation index was derived from a number of focus group discussions that yielded a sixteen-item tool that was added to the ISCWeB questionnaire. We calculated the social exclusion measure from existing items in the ISCWeB questionnaire using a factor analysis procedure.
Data and sample
The ISCWeB is a large-scale international study of the subjective well-being of children aged eight, ten and twelve. The study reported here refers to the Israeli sample of the first wave of the international survey, which included Jews and Arabs. ISCWeB is a structured, anonymous, self-report questionnaire administered to children in their classrooms. The international questionnaire was translated into Hebrew and Arabic and piloted with 262 children from different age groups with various socio-economic backgrounds. Based on the pilot, the questionnaire was modified, adjusted and translated back into English.
The Hebrew University Internal Review Board and the Israeli Ministry of Education approved the study. The survey was administrated by questionnaire and filled out anonymously by the students, during one school class (fifty minutes). We used a passive consent procedure for parents. Student consent was active, and they were free to withdraw from the study at any time and for any reason. Confidentiality was ensured, and a research assistant was available for any questions that arose while students filled out the questionnaire.
We used a quota sampling method by dividing the population into Jewish and Arab public schools (Arab referring to Palestinian Arabs, citizens of Israel). We created a base list of schools (including approximately ninety Jewish schools and eight Arab schools), and we tried to ensure the sample would be socio-economically and religiously diverse (i.e., secular and religious children). Data were collected from twenty-four different schools (twenty Jewish schools [22 per cent of the total ninety] and four Arab schools [50 per cent of the total]) in several urban and rural locations in Israel. Response rates were very high, with less than 5 per cent refusals. For the present study, we used only the questionnaires for twelve-year-olds, as we learned from our pilot that younger children had a difficult time answering questions about their economic status.
The procedure of building the measures
Material deprivation index
First, we created a list of relevant necessities from responses in five focus groups with ten- to twelve-year-old children. Each focus group included five to six children, and lasted for about forty to sixty minutes, with a total of twenty-six children. Each group was conducted in a locality from a different socio-economic level, during an after-school activity. Unfortunately, because of resource limitations we did not conduct a focus group at an Arab locality. We used a passive consent procedure with the parents and an active consent procedure for children.
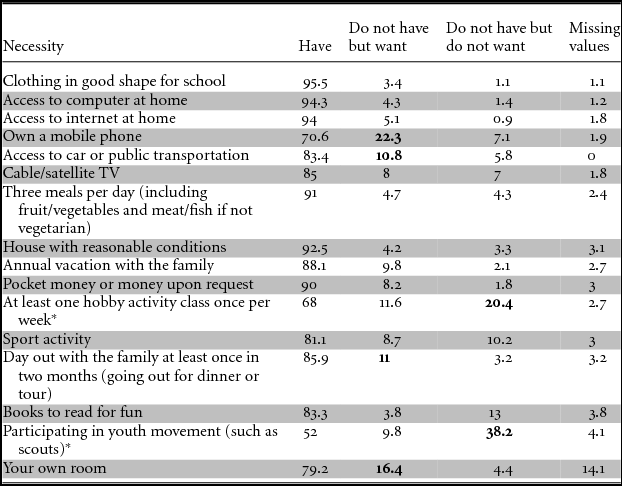
The same instructor facilitated all focus groups using the same procedure. Children were asked, ‘What do you think are the things children of your age in Israel need to have for a “normal” kind of life?’ The discussion was open-ended, with neither directions nor ideas coming from the instructor. At the end of the last three focus groups, we also conducted a very short pilot test to improve wording for a questionnaire on the different necessities. In the last two focus groups, the instructor also asked about certain items that were not under consensus in the first groups. After surveying the five focus groups, we were able to build a tool asking about sixteen necessities (the list is presented as part of Table 1). If a child reported lacking one of the necessities, the survey asked if this was owing to choice. We could not ask, with regard to each item, if the child thought it was a necessity (as has been done by Mack and Lansley, Reference Mack and Lansley1985) due to space limitations in the questionnaire. The sixteen necessities were added to the ISCWeB questionnaire.
Children who have and do not have necessities as a percentage of the sample (n = 1081)

Note:* Not part of the final material deprivation index.
The survey results showed that, regarding two of the necessities, more than 20 per cent of the children said they didn't have them because they did not want them (marked in Table 1), so we removed these items from the final deprivation index as we suspected these items did not have full consensus. These percentages were a more conservative cut-off point than that normally used. Usually participants were asked if they considered each item to be a necessity and then, if there was 50 per cent agreement, this was claimed to prove validity of the necessity and provide political consensus (Gordon, Reference Gordon, Pantazis, Gordon and Levitas2006).
Questionnaires that had more than six items missing in the index (n = 26) were not included. To avoid excluding questionnaires with only a few missing items or a more complex imputation procedure, the deprivation score was calculated by dividing the number of necessities the child missed by the number of items answered in the index. This score was then adjusted to a scale of 0 to 14. Each necessity was given an equal weight.
Social exclusion
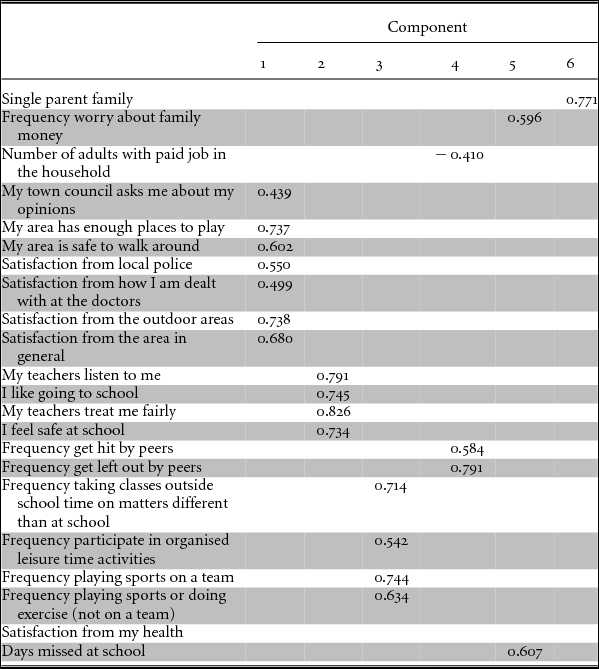
We used existing items in the ISCWeB questionnaire to develop the social exclusion measure. From the entire questionnaire, we selected twenty-two items that could denote social exclusion following earlier studies (Aber et al., Reference Aber, Gershoff and Brooks-Gunn2001; Middleton and Adelman, Reference Middleton, Adelman and Bradshaw2003). We conducted a factor analysis, and items with a loading of more than 0.4 in an oblique rotated component matrix (see table A in appendix) were considered both in terms of theory and reliability (Cronbach's alpha). Variables with α < 0.6 were excluded. We ended up with three dimensions that could explain 32 per cent of the social exclusion measure variance: school, area and services and participation in social activities.
The school dimension (α = 0.87) explained 10.9 per cent of the variance in social exclusion, including four items in an agreement scale with scores ranging from 1 (strongly agree) to 5 (strongly disagree): ‘My teachers listen to me’, ‘I like going to school’, ‘My teacher treats me fairly’, and ‘I feel safe at school’.
Area and services (α = 0.8) explained 12.6 per cent of the variance in social exclusion and included seven items. Three items were on an agreement scale ranging from 1 (strongly agree) to 5 (strongly disagree): ‘My town council asks children on their opinion about things that are important to them’, ‘In my area there are enough places to play or to have a good time’, and ‘I feel safe when I walk around in the area I live in’. Four other items were ranked on a satisfaction scale, with scores ranging from 0 (very unsatisfied) to 10 (very satisfied). The questions asked about satisfaction with (1) the local police, (2) experiences at the doctor, (3) the outdoor areas children can use and (4) the area where they live in general.
Finally, participation in social activities (α = 0.69), explaining 8.1 per cent of the variance in social exclusion, included four items on a frequency scale of 0 (never or almost never) to 3 (everyday or almost everyday), asking how often the child usually spends time (1) taking classes outside school time (like music, sports, dancing, languages), (2) participating in organised leisure time activities, (3) participating in a sporting activity in a team and (4) participating in a sporting activity individually.
To create a general social exclusion measure, we calculated means in each dimension followed by the mean of the three dimensions. This created the general social exclusion score. The final score of the social exclusion measure was on a scale of 0 (very socially excluded) to 10 (not socially excluded at all).
Findings
The study included the sixth-grade participants of the first wave of the ISCWeB (N = 1081) from fifteen different Israeli schools – 40 per cent in central Israel and 60 per cent from the north. The mean age was 11.49 (SD = 2.37); 28.8 per cent were Arabs, 71.2 per cent were Jews; 51.5 per cent were boys, and 48.5 per cent were girls. With regard to birthplace, 89.1 per cent were born in Israel and 9.1 per cent were born outside of Israel. With regard to religiosity, 12.1 per cent of the Jews identified as very religious, 23 per cent as religious, 31.2 per cent as traditional and 26.6 per cent as secular. In the Arab sample, 31.8 per cent identified as religious, 62.4 per cent as traditional and 2.6 per cent as secular.
With regard to socio-economic characteristics, 10.1 per cent did not have any working household members, 12.5 per cent had one working household member and the majority (70.9 per cent) had two or more working household members. The distribution of school locations in the socio-economic deciles (according to Israeli Bureau of Statistics with decile 1 being the lowest) was as follows: 6.8 per cent in decile 2, 32.8 per cent in decile 3, 18.7 per cent in decile 4, 31 per cent in decile 5, 8 per cent in decile 6 and 2.7 per cent in decile 8. Thus, in general, most of the sample came from less affluent locations.
The Material Deprivation Index
Children were asked about each of the sixteen necessities, and their answers are presented in Table 1.
Children lack a mobile phone more than any other necessity. More than 10 per cent of the children surveyed lacked one or more of the following necessities: a family car or access to public transportation, a day out with the family, and their own bedroom. The fact that in general all of the 16 necessities were approved by the survey (as only two were not wanted in quite low rates, 20–38 per cent) suggests the consensus reached by the focus group was strong.
Validity and reliability
To check the measures’ validity, we looked for correlations with the proxies we had for child socio-economic status. Unfortunately, we did not have in the ISCWeB questionnaire any direct measure for household income or socio-economic status. Therefore, we used the mean income of the locality of the child's school. This measure is limited because it is not measured at the child's level, yet we still found a significant but low level of correlation with the child deprivation score (r = 0.15, p < 0.01). This suggests children who live in lower-income localities are more deprived. The deprivation measure was positively correlated with ‘satisfaction with what you have’ (r = 0.157, p < 0.01), negatively correlated with ‘frequency of being worried about money’ (r = −0.127, p < 0.01), and positively correlated with ‘child satisfaction with his or her health situation’ (r = 0.122, p < 0.01). These correlations all support the measure validity (Adler and Ostrove, Reference Adler and Ostrove1999; Bradshaw, Reference Bradshaw2002; Wood, Reference Wood2003). The measure had a satisfactory Cronbach's alpha (α = 0.73).
Defining materially deprived children
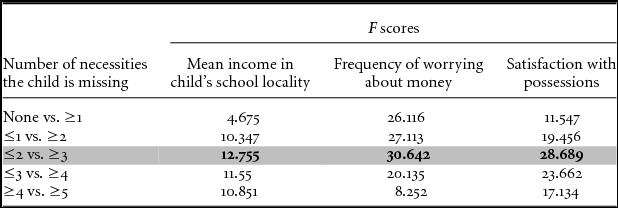
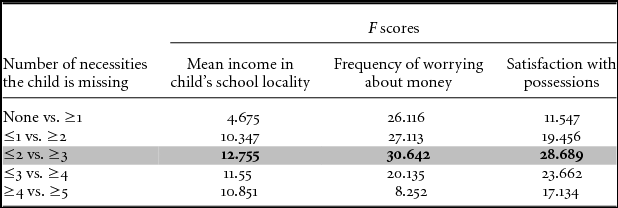
Following protocol outlined by Gordon (Reference Gordon, Pantazis, Gordon and Levitas2006), we used a multivariate method to determine the deprivation score that maximised the between-group differences and minimised the within-group differences to calculate our cut-off point. Because our measure for income was limited, we used three dependent variables in three different ANOVA models: (1) mean income of the school locality, (2) frequency worried about money and (3) satisfaction with what one has. The independent variable was deprivation groups divided between those: not missing any necessity, missing one, missing two, missing three, missing four and missing five and more necessities. The models compared those who had all necessities with those who were deprived of at least one necessity, those who were deprived of one necessity or less with those deprived of two and more necessities, and so on. The cut-off point was set where the F score was the highest, because at that point the variance between groups is the highest compared with the variance within groups. The three models yielded the same cut-off points, suggesting that children who were missing three necessities or more should be considered ‘deprived’, which constituted 15.6 per cent of the sample. Table 2 shows the ANOVA model results.
F Statistic for corrected ANOVA models of optimum position for cut off point between deprivation groups
Material deprivation scores by child's background
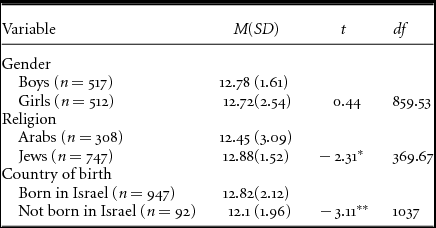
To pinpoint the effect of the child's background on the child's material deprivation, as an example of possible use of the measure, we performed independent t-tests on demographic and other background factors. As shown in Table 3, we found significant differences between Arabs and Jews, t(369.67) = −2.31, p < 0.05, with Arabs being more deprived. We also found significant differences between children who were born in Israel or abroad, t(1037) = −3.11, p < 0.01, with native-born children being less deprived.
Independent sample t tests: differences in material deprivation scores by background of groups
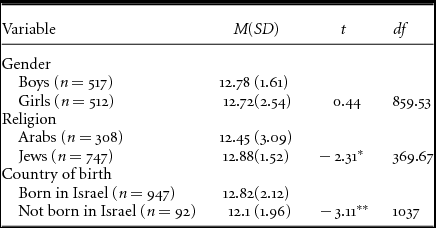
Notes: *p < 0.05.
**p < 0.01.
We also ran ANOVA models to further untangle the effects of a child's background on material deprivation. A two-way ANOVA revealed a significant interaction effect between gender and nationality, F(1,129.1) = 9.91, p < 0.01. We found that Jewish boys were more deprived (M = 12.68, SD = 0.1) than Jewish girls (M = 13.10, SD = 0.11), and Arab girls (M = 11.94, SD = 0.16) were more deprived than Arab boys (M = 13.06, SD = 0.17). A main effect was found for gender, F(1,1051) = 6.21, p < 0.05, with girls (M = 12.52, SD = 0.09) being significantly more deprived than boys (M = 12.88, SD = 0.1).
Another two-way ANOVA found a significant interaction effect between religion and religiosity, F(2,989) = 19.78, p < 0.01. Religiosity was found to be significant only for Jews, F(3,684) = 31.72, p < 0.01, and not for Arabs, F(2,265) = 1.11, p = n.s. Posthoc Tukey tests indicated that very religious Jews (M = 12.17, SD = 1.3) were significantly more materially deprived than other Jews, and religious Jews (M = 12.61, SD = 1.67) were more deprived than traditional Jews (M = 13.25, SD = 1.26) but not more than secular Jews (M = 13.03, SD = 1.56).
Social exclusion measure
Validity and reliability
The correlation between the three social exclusion dimensions was moderate to low: (1) area and services situation and participation in social activities, r = .23; p < 0.01; (2) area and services situation and school situation, r = 0.38, p < 0.01; and (3) participation in social activities and school situation, r = 0.16, p < 0.01. This implies no risk for multicollinearity.
The overall social exclusion measure was normally distributed. It correlated with ‘child satisfaction with health’ (r = 0.36, p < 0.01). As mentioned before, the literature addresses an association between health and disadvantaged life circumstances (Adler and Ostrove, Reference Adler and Ostrove1999; Bradshaw, Reference Bradshaw2002). We did not find any correlations between the social exclusion measure and the mean income of the child's locality. This might be owing to the limitation of the income data or because of a fundamental difference between the two measures. The social exclusion measure was found to have a low correlation with the material deprivation measure (r = 0.17, p < 0.01).
Defining socially excluded children
As the correlations with other socio-economic measures were not significant, we could not perform a statistical procedure as was done with the material deprivation measure. Accordingly, we implemented a simple per cent cut-off point; looking for approximately the same percentage of socially excluded children as were found to be materially deprived. A similar procedure was used by Saunders et al. (Reference Saunders, Naidoo and Griffiths2008). Thus, socially excluded children were defined as children whose mean score of social exclusion dimensions was under 5, which constituted 16.5 per cent of the participating children.
Social exclusion scores by child's background
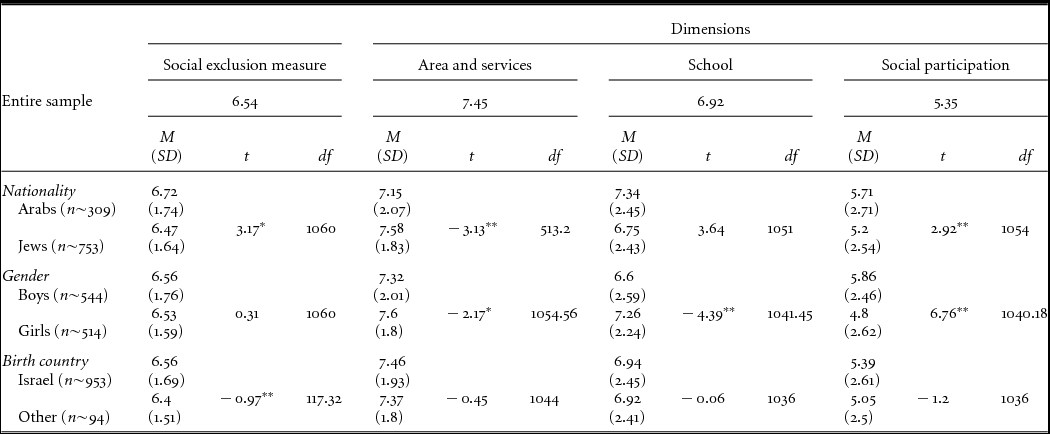
To show possible use of the measure, Table 4 shows the mean scores for social exclusion (general and dimensions) and independent sample t tests for differences by background groups. The scores for area and services are generally high. The lowest scores are for social participation. Arabs are less socially excluded than Jews in the overall measure, t(513.2) = 3.17, p < 0.05, and in social participation, t(1054) = 2.92, p < 0.01. Jews were less excluded than Arabs in the dimension of area and services, t(513.2) = −3.13, p < 0.01. Differences were also found between children who were born in Israel and abroad, t(1044) = −0.97, p < 0.01, with immigrant children more socially excluded. We found no gender differences in the overall measure, although we did find significant differences in each of the specific dimensions.
Mean scores for social exclusion (general and dimensions) and independent sample t tests for differences by background groups
Notes: The social exclusion measure and its dimensions are on a scale of 0−10.
*p < 0.05.
**p < 0.01.
The two measures combined
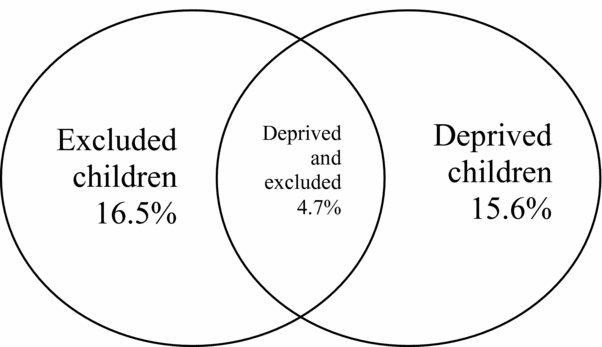
As shown in Figure 1, 15.6 per cent of the children were identified as materially deprived, 16.5 per cent were identified as socially excluded, and 4.7 per cent were both materially deprived and socially excluded. Altogether, 27.4 per cent can be considered as living in disadvantaged circumstances.
Percentage of children materially deprived and socially excluded
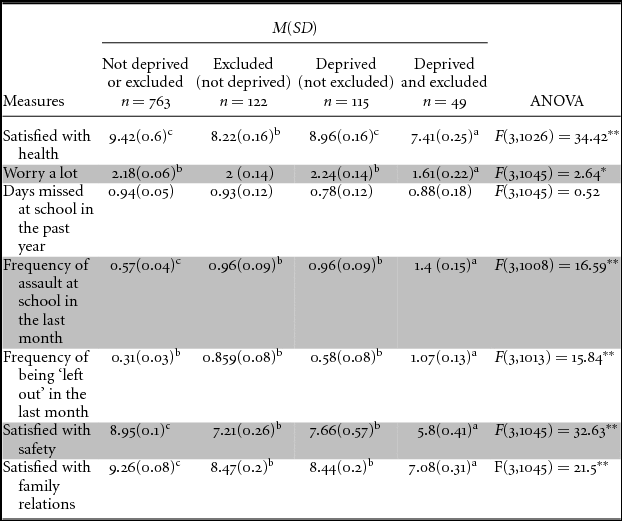
Finally, to better understand the life of the children in the different deprivation/exclusion groups, as another example for the measures utilities, we ran a one-way ANOVA on some relevant items in the ISCWeB questionnaire. The results, shown in Table 5, demonstrate that children who were identified as materially deprived and socially excluded were (1) significantly less satisfied with their health, (2) more worried about things, (3) bullied more at school, (4) left out at school more often,Footnote 3 and (5) felt less safe and less satisfied with family relations.
Descriptive statistics and ANOVA: the relationship between deprivation/exclusion groups and other child measures
Note: The letters a, b, and c show the results of Post-hoc Tucky tests.
*p < 0.05.
**p < 0.01.
Discussion
Our study clearly shows that it is possible to reach a consensus about what 12-year-old children need for a ‘normal’ life and, accordingly, to develop a reliable and valid material deprivation index. Our work strengthens the evidence from earlier studies (Main, Reference Main2013; Swords et al., Reference Swords, Greene, Boyd and Kerrins2011). Applying various statistical procedures, it was also possible to determine a level below which a child is considered materially deprived. The material deprivation index enables us to learn about the things Israeli children lack. We document a diverse range of necessities, including basic needs (e.g., access to car or transportation), non-economic necessities (e.g., day out with the family) and more ‘luxury’Footnote 4 necessities (e.g., mobile phone).
We also tested some of the index's potential uses. Comparing these results to the known literature can also imply indirectly on index validity. We find material deprivation gaps, even if slightly lower than expected, between Jews and Arabs, which other studies have also confirmed (Al-Haj, Reference Al-Haj2002; Okun and Friedlander, Reference Okun and Friedlander2005; Soen, Reference Soen2005). One possible explanation for the lower differences is that most of the study sample comes from quite low socio-economic deciles. Our results also echo literature showing the Arab population of Israel is more male-oriented and paternalistic (Al Haj, Reference Al-Haj1995; Sidani, Reference Sidani2005). We find that Arab girls are more materially deprived than Arab boys, although Jewish girls are less materially deprived than Jewish boys. It should be noted here that one limitation is that we did not conduct focus groups among Arab students, and this might create a bias in our original necessities list. However, in some sense, the fact we did not find such a big difference between the Arabs and the Jews at the final index might hint this drawback did not damage our results.
We find that the level of religiosity is associated with material deprivation only in the Jewish sample; the ‘very religious’ Jews are the most deprived. This finding complies with what we know about the economic status of the ultra-orthodox community in Israel (Friedman, Reference Friedman1991). We also find that children who migrated to Israel are significantly more materially deprived. This reflects what we know from various other studies on immigrants in Israel (Eckstein and Weiss, Reference Eckstein and Weiss2004; Raijman and Semyonov, Reference Raijman and Semyonov1995).
Our study also clearly shows that it is possible to develop a specific child social exclusion measure. Our factor analysis yielded a three-dimension index: (1) area and services, (2) school situation and (3) social participation. These dimensions align closely with the categories in the only study, to our knowledge, that measured social exclusion specifically among children (Middleton and Adelman, Reference Middleton, Adelman and Bradshaw2003). We find the measure's items to be reliable, and in general the measure seems valid, though it does not include all the aspects that might be included under social exclusion. More studies that will focus on children's social exclusion as a separate measure are needed in order to develop a more robust measure.
Testing some of the measure results, we find greater social exclusion among immigrant children which conforms to past research (Eckstein and Weiss, Reference Eckstein and Weiss2004). Furthermore, Arab children were found to be more socially excluded than Jews in the dimension of area and services. This may reflect the differences in municipal budgets of the Arab and Jewish localities (Ben-Arieh, Reference Ben-Arieh2012). However, in contrast to what is generally known in the literature, we find Jewish children are more socially excluded than Arab children in the general measure and in the dimension of social participation (Soen, Reference Soen2005). One explanation might be the social support and sense of community a familial and tribal society, such as the Arab society, generates (Haj-Yahia, Reference Haj-Yahia1995; Minces, Reference Minces1982). The network that is created in such communities might be conducive to after-school activities and support for schools. Moreover, the literature considers the general societal context, and our study focused more on the subjective perspective of children on their community.
The two measures reveal that 27.4 per cent of the children in the sample are either materially deprived or socially excluded. This is a lower rate than the 33.7 per cent of children who fall under the official ‘poverty line’ in Israel (The National Insurance Institute, 2013). This discrepancy is particularly notable because most of our sample came from low socio-economic localities. Thus, we find support for our argument that material deprivation and social exclusion are different measures apposed to the official poverty threshold measure, while of course there might be overlaps. The discrepancy might also indicate that we really do not know what resources the child has inside the household, and perhaps poor parents protect their children from the consequences of poverty (Middleton et al., Reference Middleton, Ashworth and Walker1994).
Comparing the two measures reveals that different children suffer from different things. For example, although we find material deprivation among minority groups, we find that social exclusion is a problem in the general population. The fact that only approximately 5 per cent of the sample is both materially deprived and socially excluded shows that material deprivation and social exclusion are different phenomena, as Saunders et al. (Reference Saunders, Naidoo and Griffiths2008) have argued. Thus, it is important to study each measure separately to fully understand materially disadvantaged children.
Advantages and limitations
Our study revealed four main advantages of the child material deprivation index. First, the index gives us rich data on what exactly children are deprived of. It helps us identify specific deprivations in population groups and thus be able to create more appropriate policy actions. For example, we identified Jewish ‘religious’ children as relatively more deprived of three meals per day than other Jews (12.4 per cent compared with a mean of 6.63 per cent among the rest of the groups). Second, the index refers only to the necessities a child actually has. This allows us to be informed about deprivations in a direct manner and to overcome the income barrier, which is particularly problematic for children. Third, the perspective of children is being taken into account in order to identify actual feeling of deprivation, because the index does not count the necessities the child did not have but also did not want to have. Finally, the index is based on a consensus that was achieved in the focus groups, and confirmed indirectly in the survey, by asking if children want what they are missing. This provides political credibility (Mack and Lansley, Reference Mack and Lansley1985: 48) and can also help to reflect larger trends in the society. For example, in the UK, people were found to be less generous in what they considered as necessities in the more constrained economic conditions of 2012 (Gordon et al., Reference Gordon, Mack, Lansley, Main, Nandy, Patsios and Pomati2013).
The index also has a number of limitations. First, actual deprivation might be higher, because children may be reluctant to disclose what they do not have. Second, there is limited control for situations where children adjust the things they want to the family economic situation (Shropshire and Middleton, Reference Shropshire and Middleton1999; Skattebol, Reference Skattebol2011). However, it should be noted that, in a recent study, very little evidence has been found for adaptive preferences (Main, Reference Main2013). Third, the primary list on which the index is based is subject to frequent changes in the market and technology (i.e., the latest Poverty and Social Exclusion research in the UK by Gordon et al., Reference Gordon, Mack, Lansley, Main, Nandy, Patsios and Pomati2013), and accordingly the consensus on the index should be routinely renewed, which requires constant resources.
The social exclusion measure's main advantage is that it reflects, as our study has shown, the different life aspects of materially disadvantaged children, which we find possible to measure separately. Social exclusion has many consequences, particularly for children (Evans et al., Reference Evans, Walraven, Parsons, van Veen, Day, Walraven, Parsons, van Veen and Day2000; Micklewright, Reference Micklewright2002; Ridge, Reference Ridge2002) and, in this study, it was found to be significantly associated with health satisfaction among children. Accordingly, it is important to pay attention to social exclusion as an independent measure. Findings, such as Arab children being less socially excluded than Jews, show the ability of this measure to reveal concealed nuances and reflect a more complex reality. The use of the measure as a total score, as well as the dimensions’ scores, is another advantage. The different dimensions provide a better picture of the child's situation and may enable us to locate the reasons for exclusion, while the total score might help us to prioritise according to the general level of risk for social exclusion, as we can assume one dimension compensates for another (i.e., if a child does not have a lot of opportunities to participate in social activities but has a strong curriculum at school her or his general feeling of exclusion might not be so bad).
The social exclusion measure that was built in this study has limitations. As emphasised earlier, the measure used existing items in the ISCWeB questionnaire and thus did not include the ideal items and did not cover all aspects that can be included under the concept of social exclusion. For example, broader conceptualisation and measurement was conducted in the UK with adults by the Social Exclusion Task Force (2009). Further, the measure allowed us to understand part of the social exclusion situation of the child, but it was not clear enough if the social exclusion refers to the local community or the general society. It seems each level demands slightly different items to be included in the tool. This may reflect part of the social exclusion difficulties in operationalisation and measurement (Atkinson and Hills, Reference Atkinson and Hills1998; Burchardt et al., Reference Burchardt, Grand and Piachaud1999). However, we do believe the measure benefits make it worth overcoming these barriers. This calls for more studies that will focus specifically on measurement of children's social exclusion; these studies can also ask children what are the main aspects of social exclusion that are important to them.
Consequences for social policy
The two measures can help policy-makers set priorities. First, the combination of both measures draws attention to those who are both materially deprived and socially excluded, who were found to suffer many difficulties with safety, health, and social relations. Second, the two measures can also help to inform policy by revealing a more complex picture of material disadvantage, revealing what children are missing and in what ways they are socially excluded. The developed measures can be of assistance in identifying groups of children characterised by different combinations of disadvantages (i.e., Social Exclusion Task Force, 2009), and in adjusting a proper policy to each group. Furthermore, the ability to identify more sensitive geographical areas might be an important policy tool, especially in the context of social exclusion (Abello et al., Reference Abello, Cassells, Daly, D’Souza, Miranti and Year2014).
With regard to more specific policy actions, increasing disposable income is one of the main ways for social policy to reduce material deprivation. Pro-employment policies for parents and effective redistribution policies towards children have been found particularly useful for that among OECD countries (Pisu, Reference Pisu2012). However, our findings call for the need to raise awareness about specific necessities which are important to children and do not necessarily have a cost (e.g., a day out with the family or sports activities). As a means for reducing social exclusion, our study calls for a focus also on service provision and services accessibility, embracing a right-based approach that is significantly needed with marginalised groups (Wearing, Reference Wearing2011).
Conclusions
Poverty and disadvantaged circumstances have many implications in a child's life. However, identifying the children in these circumstances is complex and cannot be done using household income measures alone. Measures of material deprivation and social exclusion can expand the concept of poverty in valid and reliable ways that yield important and rich data.
It is critical to consider both of these measures, as our findings show, because, in most cases, children who are materially deprived are not necessarily socially excluded and vice versa. The material deprivation index has been part of the United Kingdom's poverty measure for more than twenty yearsFootnote 5 and social exclusion is a central concept in ‘Europe 2020’, the EU's growth strategy.Footnote 6 It is time for other countries, including Israel, to consider using these measures together with the current child poverty measure to improve knowledge about children who live in materially disadvantaged circumstances in order to establish better policies for children.
Acknowledgements
The author would like to thank Prof. Ben-Arieh for his important support and illuminating comments.
Appendix
Rotated component matrix (rotation converged in eight iterations) with twenty-two variables tested for the social exclusion measure (showing loading that excised 0.4)