Introduction
The ornamental potential of cacti is known worldwide. Diversity of forms, different from other plants, beautiful flowers, tolerance to drought and/or cold, and minimum nutritional requirements are some remarkable characteristics that confer cacti their ornamental potential (Anderson, Reference Anderson2001; Ortega-Baes et al., Reference Ortega-Baes, Sührung, Sajama, Sotola, Alonso-Pedano, Bravo, Godínez-Alvarez and Ramawat2010). More than 300 species of cacti are cultivated as ornamental plants besides many variants available only in commercial nurseries involved with the conservation of rare cacti or maintained by collectors (Pérez-Molphe-Balch et al., Reference Pérez-Molphe-Balch, Santos-Díaz, Ramírez-Malagón and Ochoa-Alejo2015; Cavalcante et al., Reference Cavalcante, Gomes, Vasconcelos and Meiado2017; Gomes et al., Reference Gomes, Cassimiro, Freitas and Felix2020; Gdaniec et al., Reference Gdaniec, Hoxeyl, Bensusan and Taylor2022). Morphological plasticity has also been widely known in various cactus genera. Morphological variants are relevant specimens since atypical, exotic and generally unique forms are preferred by cactus traders and collectors. However, few studies are available that investigated the origin and molecular relationship between morphological variants of cacti. Studies have shown that morphological and functional cacti variations have been influenced by anthropic activities and by environmental variables associated with different microhabitats (Barbosa et al., Reference Barbosa, Silva, Zolnier, Silva and Ferreira2018; Octavio-Aguilar et al., Reference Octavio-Aguilar, Martínez-Falcón, Sánchez-González, Rojas-Martínez, Meerow, Ramírez-Bautista, Ortiz-Pulido, Caballero-Cruz, Hernández-Rico and Berriozabal-Islas2019). High temperatures, even in the absence of strong direct solar UV radiation, have also been indicated as a possible factor which causes aberrations and variegations in the Cactaceae family (Ortega-Baes et al., Reference Ortega-Baes, Sührung, Sajama, Sotola, Alonso-Pedano, Bravo, Godínez-Alvarez and Ramawat2010; Basiuk, Reference Basiuk2014).
The tortuosus and monstruosus variants of Cereus [P. Miller, 1754] are the genus's preferred plants ornamental use. The tortuosus and monstruosus variants are cultivated beside plants with typically erect shoots. The tortuosus variant with its spiral shoots (also known as ‘screw cactus’) has been selected and propagated in breeding programmes for the development of ornamental plants (Assis et al., Reference Assis, Resende, Bellintani, Coelho, Correia, Marchi, Cruz, Nahoum, Menezes, Meiado, Silva, Zappi, Taylor and Machado2011). Plants with misshapen shoots (monstruosus) in which the areoles are found in broken ribs (forming alternate regular- or irregular-spaced knobs), crested shoots (cristate, forming alternate regularly spaced knobs), spiral (tortuosus) and variegated shoots (with combined characteristics) have greater ornamental value. The monstruosus and cristate phenotypes are observed in several cactus genera and species (Basiuk, Reference Basiuk2014). Although the several phenotypic changes within an organism are the product of epigenetic changes (Zhang and Hsieh, Reference Zhang and Hsieh2013), one of the aims of the breeding programme of ornamental cacti reported by Assis et al. (Reference Assis, Resende, Bellintani, Coelho, Correia, Marchi, Cruz, Nahoum, Menezes, Meiado, Silva, Zappi, Taylor and Machado2011) is the selection of genotypes suitable for obtaining variegated plants.
While plants with typically erect shoots of Cereus peruvianus Mill. are growth as a fruit-crop, marketed mainly in Israel under the name ‘Koubo’ (Mizrahi, Reference Mizrahi2014), the tortuosus and monstruosus variants with marked morphological divergence as well as plants with typically erect shoots are frequently cultivated in home gardens and public parks and squares in the southern region of Brazil. This species is also known under the name ‘Princess of the Night’. The beautiful flowers of C. peruvianus open at early in the night, for only one night, closing daily the next morning (Mizrahi, Reference Mizrahi2014). According to Assis et al. (Reference Assis, Resende, Bellintani, Coelho, Correia, Marchi, Cruz, Nahoum, Menezes, Meiado, Silva, Zappi, Taylor and Machado2011) C. peruvianus is a synonymy of Cereus hildmannianus K. Schumann in the southern region of Brazil. However, to date, there is no information in the literature on the molecular divergence between tortuosus and monstruosus variants. Molecular relationship between morphological variants of the C. peruvianus has been reported particularly in in vitro regenerated plants from callus tissues (Eloi et al., Reference Eloi, Lucena, Mangolin and Machado2017; Martin et al., Reference Martin, Faria-Tavares, Mangolin and Machado2018). In spite of marked morphological divergence in in vitro regenerated plants, high genetic identity and low genetic divergence were reported among typical and atypical (monstruosus) regenerated plants of Cereus.
The current study investigates the molecular relations between in vivo cultivated tortuosus and monstruosus variants of C. peruvianus. The authors hypothesize that artificial selection and vegetative propagation as the predominant form of specimen multiplication of C. peruvianus may lead to genetic divergence and formation of genetically structured varieties. Polymorphisms in simple-sequence repeats (SSR) loci in the DNA (also called microsatellites) were used as molecular markers to evaluate whether these morphological variants of C. peruvianus are genetically structured.
Materials and methods
Morphological variants of C. peruvianus and microsatellite transferability
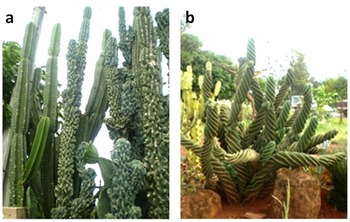
Samples of C. peruvianus tortuosus (26 plants) and C. peruvianus monstruosus (47 plants) as well as plants with typically columnar and erect shoots (19 plants), cultivated in southern Brazil (Fig. 1) were collected in several isolated urban areas, in different public parks and home gardens, and have been maintained for more than 5 years in the Cereus's active germplasm bank in our Institution (latitude 23°25′38″, longitude 51°56′15″). Plants with erect shoots were collected in the several isolated urban areas and in different public parks and home gardens, while the tortuosus and monstruosus phenotypes were collected only in different home gardens. A greater number of variants monstruosus was collected since they have been more frequently found than tortuosus.
Plants of the C. peruvianus cactus with erect shoots and plants of the variants monstruosus (a) and tortuosus (b) growing in home gardens in urban areas of Paraná state (south region, Brazil).

Genomic DNA was isolated from shoot pieces (200 mg) of each plant with erect, tortuosus and monstruosus morphologies by a procedure described by Martin et al. (Reference Martin, Faria-Tavares, Mangolin and Machado2018). The DNA concentration was estimated by comparison to known concentrations of lambda phage DNA (50, 100 and 150 ng) on 0.8% agarose gel buffered with 1× TAE (0.04 M Tris-Acetate and 0.001 M EDTA). Ethidium bromide (0.5 μg/ml) was used to staining of gel which was visualized with a Molecular Image LOCCUS L-PIX – HE (Loccus do Brasil Ltda., São Paulo, SP, Brazil) using Picasa 3 software.
The microsatellite loci were analysed by transferability using the Pchi47 primer pair from Polaskia chichipe (Otero-Arnaiz et al., Reference Otero-Arnaiz, Cruse-Sanders, Casas and Hamrick2004), the AaB6, AaD9 and AaH11 primer pairs from Astrophytum asterias (Terry et al., Reference Terry, Pepper and Manhart2006), the mAbR28 and mAbR86 primer pairs from Ariocarpus bravoanus (Hughes et al., Reference Hughes, Rodriguez, Luna, Hernández, Robson and Hawkins2008) and mEgR78 primer pair from Echinocactus grusonii (Hardesty et al., Reference Hardesty, Hughes, Rodriguez and Hawkins2008) (online Supplementary Table S1). SSR amplification was performed using 20 μl of polymerase chain reaction (PCR) mixture solution containing 2.0 μl of 1× buffer containing Tris-HCl (10 mM Tris-HCl (pH 8.3) and 50 mM KCl), 2.5 mM of MgCl2, 0.1 μM dNTPs, 1 U of Taq-DNA polymerase (Invitrogen), 0.5 μM each of the forward and reverse primers, 20 ng genomic DNA templates and Milli-Q water to make up to 20 μl. PCR amplification was run using a Techne TC-512 thermocycler.
Microsatellite amplification was initially performed according to the temperature originally described for each primer (Otero-Arnaiz et al., Reference Otero-Arnaiz, Cruse-Sanders, Casas and Hamrick2004; Terry et al., Reference Terry, Pepper and Manhart2006; Hardesty et al., Reference Hardesty, Hughes, Rodriguez and Hawkins2008; Hughes et al., Reference Hughes, Rodriguez, Luna, Hernández, Robson and Hawkins2008). The amplification condition described by Martin et al. (Reference Martin, Faria-Tavares, Mangolin and Machado2018) and annealing temperatures between 53.8 and 64°C was employed to amplify again the products that were not clearly amplified by original procedures for each primer. PCR products were separated on 4% metaphor agarose gel using 0.5× TBE buffer (0.45 M Tris-borate and 0.001 M EDTA) at 60 V for 4 h, stained with ethidium bromide at 0.5 μg/ml and photographed under UV light with a Molecular Image Loccus L-PIX – HE and Picasa 3 program. A 100 bp DNA Ladder (Invitrogen) was used to estimate the sizes of the DNA fragments obtained. Electrophoresis for 30 min at 200 V in polyacrylamide gel prepared at 12% with 8 M urea also was performed to confirm the number of alleles at each SSR loci. The amplified products (7 μl) were prepared with 10 μl of buffer prepared with 900 μl bromophenol blue, 900 μl xylenecyanol, 900 μl TBE (10×), 4.5 ml Ficol 30% (diluted in distilled water), 1.8 ml EDTA (0.5 M, pH 8.0) and 3.6 g sucrose. After complete dissolution of sucrose was added three volumes of formamide. After electrophoresis, the SYBR® Gold dye was used to stain the polyacrylamide gels and to identify the alleles in the SSR loci.
Polymorphism analysis
Polymorphisms from SSR loci were analysed with POPGENE 1.32 to estimate the average number of alleles per locus, the frequency of allele in each locus, the deficit of heterozygotes and the genetic divergence between the erect, tortuosus and monstruosus variants of C. peruvianus. Similarity matrix was computed with UPGMA, followed by Nei's clustering method, with resampling analysis, using 1000 replications. A dendrogram was constructed and drawn from a reference tree by using R Development Core Team program (R Core Team – R, 2019) using the adegenet package (Jombart, Reference Jombart2018). Principal coordinate analysis (PCoA) was also performed as an alternative means of detecting and visualizing the structure of the three morphological variants of Cereus.
Polymorphisms from SSR loci were also analysed using STRUCTURE software 2.0 to evaluate the level of genetic admixture between the 92 phenotypic variants of the C. peruvianus. The STRUCTURE software 2.0 was implemented using a burn-in period of 5000 repeats followed by 50,000 Markov chain Monte Carlo repeats. The K-values tested ranged from 2 to 8. To find the best K we used K statistics in Structure Harvester. The graphical representation was displayed with the Evanno method. An analysis of molecular variance (AMOVA) in GenAlEx 6.2 was performed to explore the hierarchical partitioning of genetic variation within and between the phenotypic variants of Cereus.
Results
Genomic DNA quantification indicated that the amount of DNA ranged from 10 to 80 ng/μl. Three alleles were observed at each AaB6, mAbR28 and mEgR78 loci, and two alleles at each Pchi47, AaD9, AaH11 and mAbR86 loci (Table 1). A total of 17 alleles, which makes an average of 2.28, 2.14 and 2.42 alleles per locus, were detected in the phenotypic variants erect, tortuosus and monstruosus shoots, respectively, of C. peruvianus (Table 1). Polyacrylamide gel showed equal number of alleles per SSR locus as detected on agarose gel. Polymorphism at the microsatellite loci was higher (100%) in the monstruosus variant than in the tortuosus and erect cacti (85.7%).
Number of alleles (Na) and number of effective alleles (Ne) per polymorphic SSR locus

Mean observed heterozygosity (H o) and expected heterozygosity (H e) in the erect, tortuosus and monstruosus variants of C. peruvianus at each AaB6, AaD9, AaH11, mAbR28, mAbR86, mEgR78 and Pchi47 loci.
Mean expected heterozygosity (H e) was higher than mean observed heterozygosity (H o) in the erect, tortuosus and monstruosus variants (Table 1). Highest H e rate were estimated in the monstruosus (H e = 0.4822) and erect (H e = 0.4095) plants, whereas the lowest rates was detected in the tortuosus shoots (H e = 0.3397).
A moderate genetic divergence (0.05 < F ST < 0.15) was observed between the erect, tortuosus and monstruosus variants. Genetic divergence among the three morphological variants resulted in F ST = 0.0962. AMOVA showed higher genetic variation within (87%) than among (13%) the three phenotypic variants of Cereus. The Nei identity values calculated for the samples from the three phenotypic variants varied from 0.8456 (between tortuosus and monstruosus) to 0.9329 (between tortuosus and the cacti with erect shoots). Genetic divergence among the tortuosus and monstruosus variants resulted in F ST = 0.1075.
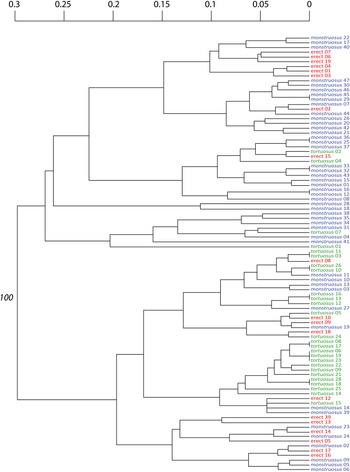
The dendrogram generated by Nei's coefficient from the analysis of individual plants (constructed from seven microsatellite primers data using the adegenet package from R Core Team – R (2019)) identified two well-defined larger groups and smaller sub-groups within each group formed by plants of the erect, tortuosus and monstruosus variants (Fig. 2). Dendrogram showed heterogeneous groups and sub-groups formed by mixture of erect, tortuosus and monstruosus plants. However, the highest proportion of monstruous plants (70%) was observed in group 1 whereas in group 2 a larger proportion of plants with tortuosus morphology (85%) was observed. The highest proportion of erect plants (58%) was observed in group 2. Genetic identity (I = 1.0) in the dendrogram was evident between 17% of the monstruosus plants and 50% of the tortuosus plants in groups 1 and 2, respectively.
Dendrogram generated by Nei's coefficient from analysis of individual plants of the variants erect, monstruosus and tortuosus of C. peruvianus constructed from seven microsatellite primers (Pchi47, AaB6, AaD9, AaH11, mAbR28, mAbR86 and mEgR78) data using the adegenet package from R Development Core Team (2019). Number beside node indicates relative bootstrap frequency (%).

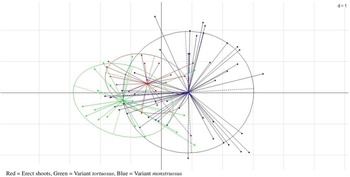
The PCoA revealed the 92 cactus plants into three groups formed by isolated plants of tortuosus and monstruosus morphologies and by the mixture of plants from the three different morphologies (Fig. 3), which match the dendrogram constructed according to the Jaccard coefficient (Fig. 2).
Three-dimensional projection obtained for plants of the variants erect (red), monstruosus (blue) and tortuosus (green) of C. peruvianus constructed from seven microsatellite primers (Pchi47, AaB6, AaD9, AaH11, mAbR28, mAbR86 and mEgR78) data.

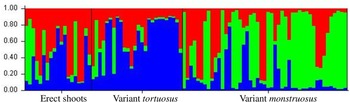
The clustering of the 92 samples of the three phenotypic variants of C. peruvianus according to a model-based Bayesian algorithm is shown in Fig. 4. Each bar in the graph represents a plant and the colours represent different proportions of plants in each group. The 92 plants of the three phenotypic variants were grouped into three subpopulations (ΔK2 = 0.00; ΔK3 = 2.58; ΔK4 = 2.05; ΔK5 = 0.00). The bar plot obtained for the K value (K = 3; ΔK = 2.58), and the results were consistent with the evidence that 48.2% of the plants with erect shoots are in the red group, 57.5% of the plants with spiralled shoots (tortuosus variant) are in the blue group, while 62.9% of the monstruosus plants are in the green group (Table 2).
Bar plot-like population structure based on microsatellite markers for plants of the Cereus genus with erect shoots and for the variants tortuosus and monstruosus within the K clusters. Each plant is represented by a single vertical bar broken in K coloured segments (K = 3), with lengths proportional to each of the K inferred clusters. Each colour represents the proportion of DNA segments for each plant, represented by a vertical bar, in each group.

Proportion of the 92 phenotypic variants of the C. peruvianus in each group (K = 3) analysed using STRUCTURE software 2.0

Source: Pritchard and Wen (Reference Pritchard and Wen2003).
The bar plot graph (Fig. 4) shows individual plants sharing genomes of different ancestral groups among the plants with erect shoots and also among plants of the tortuosus and monstruosus variants. However, the large proportion of tortuosus and monstruosus plants within the blue and green groups, respectively, illustrates how artificial selection is leading to the formation of genetically structured populations, morphologically and genetically divergent for the analysed microsatellite loci.
Discussion
Despite marked morphological divergence between tortuosus and monstruosus, a moderate genetic divergence has been detected at the molecular level in Pchi47, AaB6, AaD9, AaH11, mAbR28, mAbR86 and mEgR78 microsatellite loci. A moderate genetic divergence has also been detected at the molecular level among erect tortuosus and monstruosus variants of the Cereus plants. Moderate genetic divergence suggests that tortuosus and monstruosus variants may have a common ancestry. Several studies have shown that morphological variants in cactus species are the result of environmental variables of different microhabitats (Basiuk, Reference Basiuk2014; Barbosa et al., Reference Barbosa, Silva, Zolnier, Silva and Ferreira2018; Octavio-Aguilar et al., Reference Octavio-Aguilar, Martínez-Falcón, Sánchez-González, Rojas-Martínez, Meerow, Ramírez-Bautista, Ortiz-Pulido, Caballero-Cruz, Hernández-Rico and Berriozabal-Islas2019) and selection occurring under human management (Casas et al., Reference Casas, Otero-Arnaiz, Pérez-Negón and Valiente-Banuet2007). The pattern of morphological variations and germination behaviour in columnar cacti was significantly influenced by human management.
According to Casas et al. (Reference Casas, Otero-Arnaiz, Pérez-Negón and Valiente-Banuet2007) the degree of differentiation between wild and domesticated populations is associated with the intensity of artificial selection. Artificial selection by silvicultural and cultural management of Stenocereus pruinosus promoted different levels of genetic diversity. Higher genetic diversity has been reported in silvicultural than in wild and cultivated populations of S. pruinosus (Parra et al., Reference Parra, Casas, Penãloza-Ramírez, Cortés-Palomec, Rocha-Ramírez and González-Rodríguez2010). According to Parra et al. (Reference Parra, Blancas and Casas2012), artificial selection in favour of high-quality fruit promotes morphological variation and high divergence because of the continual replacement of plant material propagated and introduction of propagules from different regions. Morphological divergence and moderate genetic structure between wild and managed populations of S. pruinosus have been reported as a result of artificial selection (Parra et al., Reference Parra, Blancas and Casas2012). Studies with other columnar cacti species with different degrees of domestication and managed with low and high intensity also showed that artificial selection influenced the susceptibility of these cacti to xeric environments (Guillén et al., Reference Guillén, Terrazas, De la Barrera and Casas2011, Reference Guillén, Casas, Terrazas, Vega and Martínez-Palacios2013, Reference Guillén, Terrazas and Casas2015). Guillén et al. (Reference Guillén, Terrazas and Casas2015) identified some patterns that were associated with artificial selection and identified others associated with natural selection.
Genetic diversity in plant of C. peruvianus from natural populations (wild populations) was not evaluated in the present study. The tortuosus and monstruosus variants were not found in our expeditions by natural reserves so far. Thus, we suspected that the tortuosus and monstruosus variants may have emerged from erect plants cultivated in urban areas (public and/or home gardens) and the atypical morphologies were then distributed to people fond of ornamental plants. Genetic identity (I = 1.0) observed in 50% of the tortuosus and 17% of the monstruosus plants (Fig. 2) indicated selection and vegetative propagation of the ornamental variants of Cereus. C. peruvianus is self-incompatible and propagation from seeds is used for breeding. However, the propagation from cuttings is the easiest and quick way (Mizrahi, Reference Mizrahi2014). Vegetative propagation of tortuosus and monstruosus plants may be inducing a moderate genetic divergence and formation of two heterologous groups with conservative genetic diversity. Although vegetative propagation is a multiplication form of Cereus variants, high genetic diversity has been estimated in monstruosus (100%) and tortuosus (85.4%) plants. High molecular polymorphism is relevant to the conservation of the genetic diversity and to obtain a diversity of atypical, exotic and unique forms in breeding programmes, preferred by cactus traders and collectors.
Microsatellite loci are usually considered as evolutionary neutral as DNA markers. However, different allele frequencies in Pchi47, AaB6, AaD9, AaH11, mAbR28, mAbR86 and mEgR78 loci may be targets of artificial selection and vegetative propagation during the formation of populations of the C. peruvianus variants tortuosus and monstruosus. The Pchi47, AaB6, AaD9, AaH11, mAbR28, mAbR86 and mEgR78 loci may be promising in the evaluation of the morphological plasticity at the molecular level in other cactus genera and species. The functional significance of a substantial part of microsatellite loci has been proven by rigorous experiments examining various biological phenomena (see review by Li et al., Reference Li, Korol, Fahima, Beiles and Nevo2002), and studies by Subirana and Messeguer (Reference Subirana and Messeguer2007) have indicated that microsatellites with different repeated motifs may be structurally related and involved in the determination of chromosome structure. Microsatellites are abundantly distributed in coding or non-coding regions of plant genomes so that alterations in microsatellite loci located in a coding region or in introns due to the SSR expansion or contraction within gene can ultimately lead to phenotypic changes (Li et al., Reference Li, Korol, Fahima, Beiles and Nevo2002). Despite the known functional significance of the apparent selection detected in some microsatellite loci, the tortuosus and monstruosus variants of C. peruvianus may be considered an important reservoir of contrasting genes (ancestral genes prevalent of two different groups: blue and green) for the generation of different new variants.
The microsatellite loci examined in our study showed that the Nei identity values between the variants tortuosus and monstruosus (I = 0.8456) was lower than between the variants tortuosus and the cacti with erect shoots (I = 0.9329) and between the variants monstruosus and the erect cacti (I = 0.9314). The smallest identity between the variants tortuosus and monstruosus raise a hypothesis that tortuosus and monstruosus variants may be being led to form two species according with the estimates given by Thorpe and Solé-Cava (Reference Thorpe and Solé-Cava1984). According to the authors, levels of genetic identity lower than 0.85 are frequently detected between geographically isolated populations, populations in the process of speciation or for co-generic species. The similarities among the tortuosus and monstruosus plants were slightly lower than 0.85.
The phenotypes tortuosus and monstruosus should be resultant from changes in the molecules of proteins associated with division plane which contribute to the establishment and maintenance of the division plane. The evidences are that the position of the cell division plane during cellular division significantly contributes to cell shape and plant morphology (see review by Müller, Reference Müller2012). It is suggested that the possible alterations that leaded to form the tortuosus and monstruosus phenotypes must be different, since the alteration that forms the tortuosus phenotype follows a spiral ordered pattern while the monstruosus phenotype is atypical and seems have an unpredictable orientation. In the genus Cereus, plants with different phenotypes, but with defined standards (erect or spiralled) were more genetically similar for the Pchi47, AaB6, AaD9, AaH11, mAbR28, mAbR86 and mEgR78 microsatellite loci.
The phenotypic variations also may be associated with epigenetic variations occurring at the DNA level (Lele et al., Reference Lele, Ning, Cuiping, Xiao and Weihua2018; Banerjee et al., Reference Banerjee, Guo and Huang2019; Xu et al., Reference Xu, Chen, Hermanson, Xu, Sun, Chen, Kan, Li, Crisp, Yan, Li, Springer and Li2019) and the repeat sequences in microsatellites loci such as CA repetitions (e.g. AaH11 and mEgR78 loci; online Supplementary Table S1) are strong candidates for methylation activity causing epigenetic variations.
The predominant form of vegetative propagation (as ornamental plants) led to the cultivation of the two varieties with differential morphological pattern of shoots, and the generation of distinct ancestral groups (blue and green groups) at the molecular level. A practical aspect of our study is that the polymorphism in microsatellite loci in the variants of C. peruvianus revealed groups with contrasting genes among the variants tortuosus and monstruosus which may be useful for breeding aiming the generation of different new variants.
Although genetically structured varieties of C. peruvianus have been not observed from analysis of microsatellite loci (0.05 < F ST < 0.15; and dendrogram showing heterogeneous groups and sub-groups formed by mixture of erect, tortuosus and monstruosus plants), the genetic identity (I = 1.0) observed in plants of tortuosus (50%) and in plants of monstruosus (17%) has indicated the artificial selection and vegetative propagation as the predominant form of specimen multiplication of the tortuosus and monstruosus varieties. Artificial selection and vegetative propagation of tortuosus and monstruosus plants may have contributed to generate moderate genetic divergence between plant populations with monstruosus and tortuosus morphologies and may lead in the long term to high genetic divergence and formation of genetically structured populations.
Conclusions
The genetic identity observed in plants of tortuosus (50%) and in plants of monstruosus (17%) has indicated the artificial selection and vegetative propagation as the predominant form of specimen multiplication of the tortuosus and monstruosus varieties. The ornamental tortuosus and monstruosus variants of the Cereus genus with marked morphological divergence showed high polymorphism at SSR loci and formation of two heterologous groups with contrasting genes which may be useful for breeding to generate new different variants.
Supplementary material
The supplementary material for this article can be found at https://doi.org/10.1017/S1479262123000163.
Acknowledgements
The authors would like to acknowledge CAPES (Coordenação de Aperfeiçoamento de Pessoal de Nível Superior, Brasília DF Brazil) for financial support (Finance Code 001), Conselho Nacional de Desenvolvimento Científico e Tecnológico (Brasília DF Brazil) (grant number 304447/2016-1) and Fundação Araucária (Curitiba, PR, Brazil) (grant number 002/2017).
Author contributions
C. A. M. and M. F. P. S. M. conceived and designed research. A. F. N., V. N. A. F. and E. R. M. conducted experiments. A. F. N., C. A. M. and M. F. P. S. M. analysed data. M. F. P. S. M. wrote the manuscript. All authors read and approved the manuscript.
Conflict of interest
The authors declare no conflict of interest.