Implications
Routine welfare assessment systems should be efficient, discriminative and should summarize different welfare aspects in a balanced way. When applied to intensive broiler production the efficiency of an existing system (Welfare Quality® (WQ)) could be greatly improved, as its overall classification depended almost entirely on two out of 18 measures. Also, discriminative capacity was poor. Within the estimated realistic range for intensive indoor flocks, classification was highly sensitive to bird : drinker ratios whilst entirely insensitive to health and behaviour, suggesting an unbalanced summary of welfare. Routine application of the current classification system is unlikely to stimulate welfare improvement in intensive broiler production.
Introduction
The WQ assessment protocol for poultry provides an elaborate system to assess broiler welfare (WQ, 2009). This protocol is typified by its holistic character, that is, it integrates a wide range of welfare aspects into one overall classification. WQ strives to include animal-based outcome measures which reflect welfare directly, rather than including resource-based measures that reflect risk factors for decreased welfare only (Blokhuis et al., Reference Blokhuis, Veissier, Miele and Jones2010). Because many aspects are measured and because animal-based measures generally take longer to collect than resource-based ones, performing the full protocol takes much time (~3.5 h, excluding travel and data processing). The time required makes the protocol costly to perform, which hampers its implementation for routine assessments.
One way to improve efficiency could be to remove measures that are highly correlated with others, thus removing redundant data. Previous studies have suggested a correlation between dermatitis and plumage cleanliness (Arnould and Colin, Reference Arnould and Colin2009; De Jong et al., Reference De Jong, Hindle, Butterworth, Engel, Ferrari, Gunnink, Perez Moya, Tuyttens and Van Reenen2015) or litter quality (Bassler et al., Reference Bassler, Arnould, Butterworth, Colin, De Jong, Ferrante, Ferrari, Haslam, Wemelsfelder and Blokhuis2013), but these studies differ considering a possible correlation between dermatitis and lameness. Thus, the stability of such correlations still needs confirmation. Also, some measures may potentially be predicted from the combination of several other measures, a possibility which has not yet been investigated.
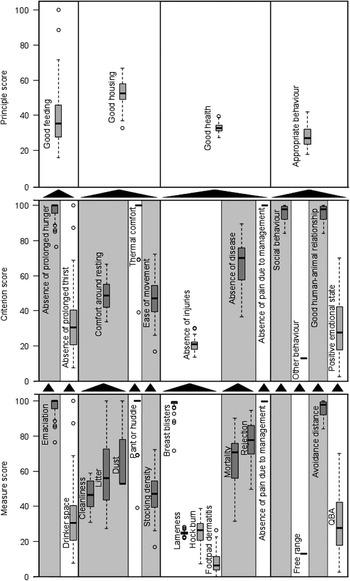
One of the main characteristics of the WQ approach is the stepwise integration of measures into one overall category (i.e. the final flock classification). Such an integration is by definition a subjective, value-based process (Veissier et al., Reference Veissier, Jensen, Botreau and Sandøe2011), but the outcome is highly summarized making it easy to understand. Eighteen measures are integrated into 12 criteria, which are subsequently integrated into four principles and finally into one overall category (Figure 1). Some criteria are based on one measure only, which therefore passes to the criterion level without being combined with others (e.g. the ‘drinker space’ measure score is equal to the ‘absence of thirst’ criterion score). Other criteria are based on several measures (e.g. the ‘breast blister’, ‘lameness’, ‘hock burn’ and ‘footpad dermatitis’ measures form the ‘absence of injuries’ criterion). When progressing from the criterion level to the principle level all criteria undergo integration, but the number of criteria that are combined in each principle differ (2 to 4). When integrating measures into criteria and criteria into principles, the weight given to each element depends on its value relative to the other elements in the same integration (i.e. the relative values of measures within the same criterion, or the relative values of criteria within the same principle, WQ, 2009). Most weight is given to the poorest element and only partial compensation can be achieved by high scores on the other elements. This compensation depends on which element is compensating which other (using different weights based on expert opinion for different combinations of elements) and the difference between the two elements. This leads to four principle scores ranging between 0 (worst) and 100 (best). In the last step, overall classification is based on surpassing certain thresholds for all four principle scores (e.g. two principle scores >75 and two principle scores >50 are needed to be classified as ‘excellent’). Together, this means that the extent to which a single measure can influence the overall classification depends on: (1) the number of measures that are integrated into one criterion and the number of criteria integrated into one principle, (2) the value of the measure relative to the other measures in the same criterion and the value of the criterion relative to the other criteria in the same principle, (3) the compensation weight given to the measure and the criterion based on expert opinion and (4) the score on the other three principles. In other words: measures that are integrated with many other measures before reaching the principle level and those for which relatively high scores are consistently obtained are less likely to impact on the overall category. Also, improvement of the highest principle score never affects overall classification (although a decrease of the lowest principle score can).
Welfare Quality combines different welfare aspects into one overall classification. When assembled from multiple measures, criteria are based upon a weighted sum of these measures, with weightings mainly depending on the order of the measures. Same for principles derived from multiple criteria. 1Absence of pain not measured for broilers, but always 100. 2Social behaviour measure is lacking, score is generated on criterion level. 3Qualitative behavioural assessment. 4Human–animal relationship.

Sensitivity analysis of the WQ dairy cattle protocol (which is integrated in the same way) indicated that overall classification was strongly influenced by a few measures (drinker space and collisions with stalls) and fairly insensitive to others (De Vries et al., Reference De Vries, Bokkers, Van Schaik, Botreau, Engel, Dijkstra and De Boer2013). In line with this, the dairy protocol’s overall classification could be predicted with 88% accuracy by the ‘absence of thirst’ criterion only (Heath et al., Reference Heath, Browne, Mullan and Main2014). If the same is true for the broiler protocol, spending time on acquiring measures not affecting the overall classification seems ineffective. Excluding them may decrease assessment time, increasing the protocol’s chance of implementation. Of course, such a simplified protocol should still represent a balanced summary of welfare, which Heath et al. (Reference Heath, Browne, Mullan and Main2014) strongly questioned for the dairy protocol, suggestion that the impact of ‘absence of thirst’ was an unintended artefact of the WQ integration.
WQ protocols allow comparison of welfare in a wide range of different husbandry systems. When applying the protocol to compare flocks within the same husbandry system, this is likely to lead to a more similar overall classification, as conditions are more similar within husbandry systems. This effect is intentional as of course more similar flocks should acquire more similar scores. However, this may also entail that the protocol has a limited capacity to differentiate between flocks within a husbandry system, if achieving a wide range of scores would be difficult or impossible in this system. For instance, the vast majority of Belgian broiler flocks consist of fast-growing birds kept in indoor systems at target stocking densities of 42 kg end weight/m2 (Tuyttens et al., Reference Tuyttens, Vanhonacker and Verbeke2014). Under such circumstances the ‘free range’ score will always be the lowest possible, lameness scores are likely to be poor (Bradshaw et al., Reference Bradshaw, Kirkden and Broom2002), but emaciation is unlikely to occur regularly. If such system characteristics lead to similar overall classification of all flocks, overall classification can for instance not be used to reward better farms or to stimulate poorer farms to do better.
We aimed to assess if the WQ broiler protocol differentiates between intensively reared indoor flocks of fast-growing broilers, to evaluate which elements determine overall classification, and to assess this classification’s sensitivity to changes in separate elements (measures, criteria, principles).
Methods
Animals and housing
Flocks were selected randomly from the slaughter planning of two participating slaughterhouses. Farmers were contacted to request their permission to collect data on these flocks. Data on 41 flocks from 23 farms were obtained. All flocks consisted of birds grown to a target slaughter weight of 2.5 kg at 42 days of age and were kept indoors in windowless houses bedded with straw, flax or wood shavings. Median flock size at the time of visit was 19 262 birds (min: 7030, max: 34 264). Before the visit, 90% of the flocks had been thinned removing 24% of the flock (min: 15, max: 46) at a median age of 34 days (min: 31, max: 35). In all, 40 flocks consisted of Ross broilers, one of Cobb broilers. This represents standard Belgian broiler production (Tuyttens et al., Reference Tuyttens, Vanhonacker and Verbeke2014).
Training
All data were collected by one assessor, except three slaughterhouse visits carried out by a second assessor. Before data collection the assessors had been trained together by an experienced assessor. Several ‘practice visits’ were made before starting data collection. Training materials (e.g. protocol, gait scoring videos) were reviewed several times before and during the data collection period to avoid drift. Visits were carried out between September 2014 and May 2015 (with a 2-month break in winter when preventative avian influenza measures impeded visits).
Data collection
Flocks were visited on farm between 33 and 42 days of age (i.e. 1 to 10 days before slaughter). During the farm visit data on the ‘plumage cleanliness’, ‘litter quality’, ‘dust’, ‘panting/huddling’, ‘lameness’, ‘avoidance distance’ and ‘qualitative behaviour assessment’ measures were collected and data on the ‘drinker space’, ‘stocking density’ and ‘mortality’ measures were taken from farm records (measures described in detail in WQ, 2009). The same flocks were assessed during slaughter: data on the ‘breast blister’, ‘hock burn’ and ‘footpad dermatitis’ measures were collected and data on the ‘emaciation’ and ‘rejection’ measures were obtained from slaughterhouse records. These measures taken on farm and at the slaughterhouse together aim to reflect the welfare of broilers during their life on farm.
At some points we had to diverge from WQ (2009), as we were unable to collect the data in the prescribed way. The protocol requires separate slaughterhouse data on rejections due to dehydration, ascites, septicaemia, hepatitis, pericarditis and abscesses. However, the participating slaughterhouses did not split rejections into these classes. Also, the protocol distinguishes between birds found dead and those culled, but most participating farmers did not discern between these when recording mortality. Therefore, we collected only a total rejection percentage and a total mortality percentage as previously suggested by De Jong et al. (Reference De Jong, Hindle, Butterworth, Engel, Ferrari, Gunnink, Perez Moya, Tuyttens and Van Reenen2015). In addition, ‘emaciation’ and ‘rejection’ measures were scored at farm level rather than at flock level, as multiple flocks from the same farm arrived at the slaughterhouse in one load, and only one slaughter report was made for the entire farm.
Data integration
Raw data was first expressed on a 0 (worst) to 100 (best) scale weighted for severity and subsequently integrated as detailed in WQ (2009) and the introduction. The alternative manner of rejection and mortality data collection necessitated an alternative integration into the ‘absence of disease’ criterion, previously developed by De Jong et al. (Reference De Jong, Hindle, Butterworth, Engel, Ferrari, Gunnink, Perez Moya, Tuyttens and Van Reenen2015). In addition, the calculation for the ‘absence of hunger’ criterion as described in WQ (2009) contains an error, so we used a corrected version proposed by De Jong et al. (Reference De Jong, Hindle, Butterworth, Engel, Ferrari, Gunnink, Perez Moya, Tuyttens and Van Reenen2015). Also, WQ (2009) does not detail how the five-point scale used for the lameness measure should be recoded into the three classes needed for the integration. We used gait score 2 and 3 to reflect moderate lameness and score 4 and 5 to reflect severe lameness. Flocks were labelled ‘excellent’ if scoring >75 on two principles and >50 on the others and as ‘enhanced’ when scoring >50 on two principles and >15 on the others. ‘Acceptable’ flocks scored >15 on three principles and >5 on the other. Lower scoring flocks were labelled ‘not classified’.
Statistical analysis
To investigate the possibility of reducing assessment time by replacing measures, criteria or principles with others we used a three step approach in R 3.0.1 (R Core Team, 2013). First, we used univariable linear mixed models to identify elements that tended (P⩽0.10) to be associated with others (at measure, criterion and principle level). In all models, farm was added as a random factor to account for repeated measures. Second, we built a multivariable model for each outcome variable (i.e. each measure, criterion or principle). Associated variables were added one by one in order of ascending P-value. Only associated variables that took less or an equal amount of time to collect than the outcome variable, and that affected the outcome variable significantly (P⩽0.05), were retained in the multivariable model. Multicollinearity was avoided by deleting associated variables showing considerable correlation (r>0.6) with previously added variables. Because R 2 values cannot be obtained from mixed models, we subsequently determined the adjusted R 2 values of similar linear models based on the data of the first visit of each farm (with no repeated measures) to assess the proportion of variation in the outcome variable explained by the model.
We also analysed if overall classification could be explained by a combination of fewer measures, criteria or principles. To do so, overall classification was treated as a binomial variable (0=acceptable, 1=enhanced, the only observed classes). Using a selection of the data set including one visit per farm only (the ‘enhanced’ flock if available and otherwise the first flock) logistic regression was used to identify WQ elements that tended (P⩽0.10) to affect overall classification and subsequently built a multivariable model retaining significant (P⩽0.05) variables. The modelled outcome was compared with the original classification to assess the percentage of correctly modelled overall classifications.
Sensitivity analysis was performed (Microsoft Excel) to study the effect of changes in separate measures, criteria and principles on classification. We replaced each observed score by the worst and best score theoretically possible (i.e. 0 and 100) and by the minimum and maximum value observed for that element (to reflect the range in common practice). For each replacement we quantified how many flocks shifted between the overall categories.
Results
In our data set of 41 intensively reared flocks, no variance in the ‘absence of pain’ and ‘other behaviour’ criteria occurred (Figure 2), as these criteria scores are fixed for all and for indoor flocks, respectively. Median scores for the ‘absence of prolonged hunger’, ‘thermal comfort’, ‘social behaviour’ and ‘good human–animal relationship’ criteria were high (>97) and scores varied little between flocks. Scores for the ‘absence of injuries’ criterion were low and varied little, resulting in homogeneous scores for the ‘good health’ principle. Out of 41 flocks, 36 were classified as ‘acceptable’ and the remaining five were classified as ‘enhanced’. All five ‘enhanced’ flocks were classified as such due to scores >50 on the ‘good feeding’ and ‘good housing’ principles and scores >15 on the other two principles.
Medians and interquartile range (box) of the Welfare Quality scores obtained from 41 broiler flocks. Whiskers: data within 1.5× the interquartile range. Higher scores imply better welfare.

Simplifying by replacing elements
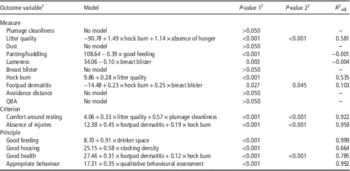
For some measures, criteria and principles, no model creation was attempted as these could not be replaced by more efficiently collected data. This was the case for ‘emaciation’ and ‘rejections’ (taken from slaughterhouse records), ‘drinker space’, ‘stocking density’ and ‘mortality’ (calculated from farm records), and criteria derived solely from these measures (‘absence of prolonged hunger’, ‘absence of prolonged thirst’, ‘ease of movement’, ‘absence of disease’). Also, no model was created for constant (free range) or lacking (measure for ‘social behaviour’) measures or for criteria derived solely from these (‘other behaviour’ and ‘social behaviour’). Table 1 shows the results of the model creation for the other elements.
Results of the model creation for the Welfare Quality broiler protocol’s measure, criterion and principle scores by measure, criterion or principle scores that take less or equal time to collect

QBA = qualitative behavioural assessment.
1All variables are expressed as Welfare Quality scores, thus ranging between 0 (worst) and 100 (best).
2 P-value associated with the first predictor displayed in the model, based on the repeated measures model.
3 P-value associated with the second predictor displayed in the model, based on the repeated measures model.
Significant relations were found for several measures but the proportion of variance explained by these models was often very low. Models for criterion scores explained a far greater proportion of variance (>90% for ‘comfort around resting’ and ‘absence of injuries’ based on two measures each). The models for the principles ‘good feeding’, ‘good housing’ and ‘appropriate behaviour’ were each based on a single measure, explaining 99%, 66% and 99% of the variance, respectively. The model for ‘good health’ included two measures which together explained 79% of the variance.
Only four elements affected (or tended to affect) overall classification when analysed separately. These were ‘drinker space’ (=‘absence of prolonged thirst’, P<0.001), ‘breast blister’ (P=0.050), ‘stocking density’ (=‘ease of movement’, P=0.055) and ‘good feeding’ (P<0.001). Because ‘good feeding’ and ‘drinker space’ were highly correlated, only the last measure was included in the multivariable model. ‘Breast blister’ was dropped from the model as it had no significant effect when added after ‘drinker space’. The following model resulted:
 $$\eqalignno{ {\rm Overall}\,{\rm classification }\,&{\equals} \exp \left( x \right)\,/\,\left( {1{\plus}{\rm exp}\left( x \right)} \right),{\rm } \cr{\rm with}\,x\, &{\equals}\,{\minus}19.39{\plus}0.1590{\times} \lsquo {\rm drinker}\,{\rm space \rsquo }\cr& \quad{{\plus} 0}{\rm .2121} {{\times} \lsquo \rm stocking}\,\,{\rm density} \rsquo $$
Both ‘drinker space’ and ‘stocking density’ were included as WQ measure scores, thus implying better welfare when higher. Outcomes >0.5 indicated ‘enhanced’ status and <0.5 ‘acceptable’ status. This model explained the overall classification of 95% of the flocks (39 out of 41). It indicated one ‘enhanced’ flock as ‘acceptable’ and one ‘acceptable’ flock as ‘enhanced’.
Sensitivity analysis: replacement with the theoretical minimum and maximum
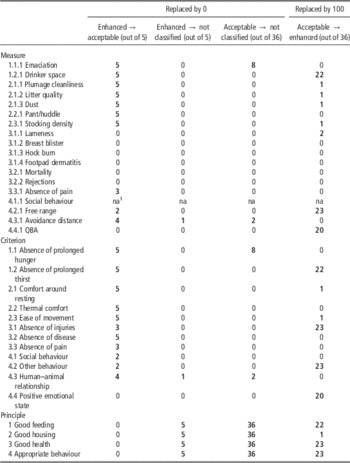
Table 2 shows the number of flocks that switched between the WQ categories when a single measure, criterion or principle was set to 0 or 100. Altering measure scores usually resulted in shifts between the ‘enhanced’ and ‘acceptable’ categories only (except for ‘emaciation’ and ‘avoidance distance’).
The effects of changing separate Welfare Quality (WQ) scores to 0 or 100 on the number of broiler flocks in each of the four overall WQ categories

QBA = qualitative behavioural assessment.
All category switches that occurred are displayed.
Bold values represent at least one flock changing category.
1 The WQ broiler protocol currently lacks a measure for ‘social behaviour’. A score is generated on the criterion level based on other criteria.
When any measure score within the ‘good feeding’ or ‘good housing’ principle was decreased to 0 all five ‘enhanced’ flocks shifted to a lower category. In contrast, decreasing measure scores within ‘good health’ to 0 had no effect on the classification (except for decreasing the score from which the ‘absence of pain’ criterion is generated, but due to the absence of a validated measure in the current protocol this score is always set at 100). Within the ‘appropriate behaviour’ principle some measures had more impact than others when set to 0. When raised to 100, measures that were low originally and combined with few other measures during the integration (i.e. ‘drinker space’, ‘free range’ and ‘qualitative behavioural assessment’ (QBA)) led to a major change in flock categorization, shifting more than half of the ‘acceptable’ flocks to ‘enhanced’. In contrast, little or no effect on flock classification was achieved for measures integrated with several other measures, even when originally low measures were set to 100 (e.g. lameness, hock burn, footpad dermatitis). Such measures all belonged to the ‘good health’ principle. Setting measure scores within the ‘good housing’ principle to 100 was slightly more effective in changing overall classification. Even though these measures scores were originally higher than those for ‘good health’, they were integrated with fewer other measures, thus resulting in a bigger impact on the overall classification when manipulating a single measure.
Most (nine out of 12) criteria are generated from only one measure. For these criteria, alterations on measure and criterion level have the same effect. The exceptions are ‘comfort around resting’, ‘absence of injuries’ and ‘absence of disease’, which each combine two to four measures and are themselves combined with two other criteria to achieve principle scores. Out of these three criteria, ‘absence of injuries’ had the lowest original scores and reducing these to 0 led to a reclassification of the least flocks, whilst raising them to 100 reclassified the most flocks. Decreasing either of the other two criteria to 0 caused all ‘enhanced’ flocks to switch to ‘acceptable’ (but none to ‘not classified’), whilst setting them to 100 had little to no effect. No measure score for the ‘social behaviour’ criterion is included in the protocol. Instead the ‘social behaviour’ criterion score duplicates that of ‘other behaviour’, ‘human–animal relationship’ or ‘positive emotional state’, whichever is the highest. In our sample, this was always the human–animal relationship score. The ‘social behaviour’ criterion score was generally high, but decreasing it to 0 reclassified only two out of five ‘enhanced’ flocks as ‘acceptable’ (and no flocks as ‘not classified’) due to integration with high scores for the ‘good human–animal relationship’ criterion, which prevented the ‘appropriate behaviour’ principle from falling below 15.
Decreasing any principle score to 0 shifted all flocks to ‘not classified’ (as any principle score below 5 leads to this classification). Increasing the ‘good feeding’, ‘good health’ or ‘appropriate behaviour’ principle scores to 100 shifted more than half of the ‘acceptable’ flocks to ‘enhanced’. In contrast, increasing the ‘good housing’ principle to 100 only affected one flock, as the ‘good housing’ score was usually already >50 for the flocks that had a score >50 on any of the other principles.
Sensitivity analysis: replacement with the observed minimum and maximum
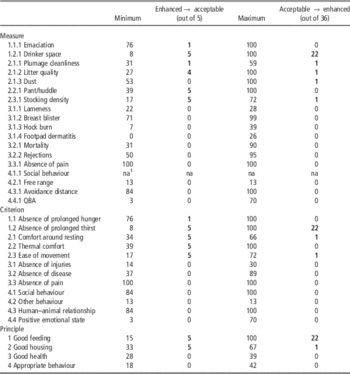
As achieving the theoretical minimum or maximum score may not always be feasible within the context of intensive indoor rearing of fast-growing broilers, we also assessed the effect of changing the scores to realistically feasible levels (i.e. the observed minimum and maximum value within in our sample). Because the observed data range was often small, replacing scores with the observed minimum or maximum had far less pronounced effects than replacements with the theoretical minimum or maximum (Table 3).
Observed minimum and maximum values and the effects of changing separate Welfare Quality (WQ) scores to these the minimum or maximum values on the number of broiler flocks in the different the overall categories

QBA = qualitative behavioural assessment.
All category switches that occurred are displayed.
Bold values represent at least one flock changing category.
1 The WQ broiler protocol currently lacks a measure for ‘social behaviour’. A score is generated on the criterion level based on other criteria.
Replacements with the observed minimum never led to principle scores below 15. Therefore, even reducing the entire ‘good health’ or ‘appropriate behaviour’ principles to the observed minimum did not affect flock categorization (as flocks were classified as ‘enhanced’ due to scores >50 on ‘good feeding’ and ‘good housing’ and scores >15 for ‘good health’ and ‘appropriate behaviour’). In contrast, decreasing the ‘good feeding’ or ‘good housing’ principle to the observed minimum caused all flocks to lose their ‘enhanced’ status. In fact, most separate measures within these two principles affected classification when set to the observed minimum. Exceptions were measure scores for which the observed minimum was high (‘emaciation’ and ‘dust’) or close to the median value (‘plumage cleanliness’).
‘Drinker space’ was the only measure that led to considerable changes in flock classification if raised to the observed maximum. This was due to a high observed maximum (100) and its integration with only one other measure which was reliably higher and thus received less weight. The high scores for the ‘good feeding’ principle resulting from maximizing the ‘drinker space’ measure were met by high original scores for the ‘good housing’ principle, thus fulfilling the minimum conditions for the ‘enhanced’ category (i.e. two principle scores >50 and two >15). Setting the ‘good feeding’ principle scores to the observed maximum reclassified over half of the ‘acceptable’ flocks as ‘enhanced’, because these were met by high original scores for the ‘good housing’ principle. Increasing the ‘good housing’ principle score to the observed maximum was less effective because the original ‘good feeding’ scores were generally not sufficient to categorize flocks as enhanced.
Discussion
Although WQ has been criticized for its time-consuming character, many elements of the broiler protocol are actually collected efficiently from farm and slaughterhouse records. For the other elements (measures, criteria, principles and overall classification) we attempted to assemble models that explained their variance based on less time-consuming elements or combinations. Note that these models were based on data collected from intensively reared broiler flocks only, with little variance in variables like for instance slaughter age, housing system and genetics. Thus the results cannot be extrapolated to flocks raised in a different manner (e.g. to slower growing flocks with outdoor access). However, most European broiler flocks are kept under circumstances similar to those of our flocks.
Few models could be produced that explained a substantial proportion of the variance in the measures and these models did not support the correlations between dermatitis and plumage cleanliness previously reported (Arnould and Colin, Reference Arnould and Colin2009; De Jong et al., Reference De Jong, Hindle, Butterworth, Engel, Ferrari, Gunnink, Perez Moya, Tuyttens and Van Reenen2015), suggesting that such associations lack extrapolatability. However, the early date of some of our farm visits (up to 10 days before slaughter) and our modest sample size may have decreased our chances of finding associations. We did confirm the association between litter quality and dermatitis reported by Bassler et al. (Reference Bassler, Arnould, Butterworth, Colin, De Jong, Ferrante, Ferrari, Haslam, Wemelsfelder and Blokhuis2013). Models on the criterion level allowed a reduction in assessment time of ~1 h, by making the ‘dust’, ‘breast blister’ and ‘lameness’ measure redundant. The models on principle level allowed an even greater reduction (to 1/3 of the original assessment time) as only the ‘drinker space’, ‘stocking density’, ‘footpad dermatitis’, ‘hock burn’ and ‘qualitative behavioural assessment’ measures were needed to explain a sufficient proportion of the four principles’ variance (R 2 adj=0.7 to 1.0). Two measures (‘drinker space’ and ‘stocking density’) together explained the classification of 95% of the flocks (39 out of 41). Collecting data on these measures only would allow a great decrease in assessment time as both can be obtained from farm records. However, as previously argued for dairy cattle (Heath et al., Reference Heath, Browne, Mullan and Main2014), it can be questioned whether such a model truly gives a balanced and holistic view of welfare. Instead, it may reflect an unwanted side effect of the weight ‘drinker space’ and ‘stocking density’ receive during the integration process. Such effects were studied further in the sensitivity analysis.
In line with their important role in our simplified model for overall classification, alterations of the ‘drinker space’ and ‘stocking density’ measures during the sensitivity analysis impacted strongly on flock classification. Replacing either of them with the observed minimum shifted all ‘enhanced’ flocks to ‘acceptable’. Most other measures within the ‘good feeding’ and ‘good housing’ principles also led to reclassification when set to the observed minimum, but only ‘drinker space’ shifted a substantial proportion of the flocks (61%) from ‘acceptable’ to ‘enhanced’ when maximized. The ‘drinker space’ measure was highly effective in increasing flock classification for three reasons. First of all, its observed range was wide (8 to 100), thus many poor scores were greatly improved when substituted by the observed maximum. Second, improved scores on ‘good feeding’ resulting from the maximization of ‘drinker space’ were met by high original scores on ‘good housing’, thus surpassing the lower limit for classification as ‘enhanced’ (two principles >50 and two principles >15). Third, ‘drinker space’ was integrated with only one measure when forming the ‘good feeding’ principle, this other measure (emaciation) being reliably higher and thus receiving less weight. Whilst having a wider range than other measures and being additive to other high principle scores seem valid reasons to impact on a holistic representation of welfare (i.e. the overall classification), the same cannot be said for the lower number of measures that are integrated into ‘good feeding’ than into either of the other three principles (four to seven measures). The important role of ‘stocking density’ in the simplified model for flock classification was mainly reflected in its potential to shift flocks to a lower category when minimized. This was because there was little room for improvement due to high scores within the ‘good housing’ principle, as only six flocks in the entire data set scored >50 on a principle other than ‘good housing’. Five of these flocks were already categorized as ‘enhanced’. Thus, only one flock was left to be positively affected by an improved ‘good housing’ score. The ‘comfort around resting’ criterion affected flock classification to the same extent in the sensitivity analysis, but its small range (33 to 66) likely explains why it did not contribute significantly to our simplified model.
The great impact of ‘drinker space’ and ‘stocking density’ is a cause for concern as both are resource-based measures representing risk factors for decreased welfare, rather than the animal-based outcome measures which assess welfare more directly (Blokhuis et al., Reference Blokhuis, Veissier, Miele and Jones2010). Furthermore, the validity of the ‘drinker space’ measure as an indicator of ‘absence of prolonged thirst’ can be questioned. Adding drinkers will only prevent thirst if the original number was limiting and if all birds are able to reach them. Both situations are unlikely to occur in practice, as Feddes et al. (Reference Feddes, Emmanual and Zuidhof2002) found no difference in water intake between bird : drinker ratios of 5 and 20 and Butterworth et al. (Reference Butterworth, Weeks, Crea and Kestin2002) report that lame birds had a decreased ability to reach drinkers. Also, ‘drinker space’ does not correlate with water consumption from an additional easily reached drinker, suggesting that fewer drinkers do not lead to increased thirst (Vanderhasselt et al., Reference Vanderhasselt, Goethals, Buijs, Federici, Sans, Molento, Duchateau and Tuyttens2014). During our own farm visits we never observed obvious behavioural signs of a shortage of drinkers (e.g. queueing or agonistic interactions around drinkers). Even if this may be partly due to the thinning (partial depopulation) of most flocks before our visit, bird : nipple ratios up to 19 : 1 at the time of the visit were observed, well above WQ’s 10 : 1 recommendation. The validity of the ‘stocking density’ measure can be questioned because it measures density at the time of the visit only. If thinning is applied (an increasingly common routine) this is usually done shortly before WQ target visiting age, which means that the observed stocking density does not represent density throughout rearing.
The absence of (elements of) ‘good health’ in the overall classification model, and the lack of a substantial effect when measures within ‘good health’ were minimized or maximized is problematic. Recent surveys (Tuyttens et al., Reference Tuyttens, Vanhonacker and Verbeke2014; Vanhonacker et al., Reference Vanhonacker, Tuyttens and Verbeke2016) suggest that (Flemish) citizens perceived ‘good health’ as the most important principle for broiler welfare, whilst farmers perceived ‘good health’ and ‘good feeding’ as the two most important principles. Furthermore, observed values for measures within ‘good health’ were often extreme (e.g. high for ‘breast blisters’ and low for ‘lameness’, ‘hock dermatitis’ and ‘footpad dermatitis’), thus replacing them with the opposite extreme would be expected to have a great effect. This did not occur, because the ‘good health’ principle includes the most measures of all principles (seven instead of two to five). This means that six measures buffer the principle score when altering the seventh. This makes sense to a certain extent, as health is a complex phenomenon and improving only one of its aspects has a limited effect on health overall. However, this buffering also means that the overall classification cannot be used to motivate farmers to improve single measures within ‘good health’, as such changes are not reflected in the overall classification. Setting the entire ‘absence of injuries’ criterion (which is part of the ‘good health’ principle) to 0 or 100 did affect classification for a substantial proportion of flocks. Thus, farmers’ efforts to improve several health aspects at once could theoretically be rewarded with a higher classification, if they were able to simultaneously eradicate breast blisters, lameness, footpad dermatitis and hock burn altogether. However, this seems an unrealistic goal for intensive indoor rearing of fast-growing birds. No change in overall classification was found when any of the criteria within the ‘good health’ principle was replaced with the observed minimum or maximum. This suggests that although it is theoretically possible to achieve a better overall classification by improving health, this is only achieved by applying more effective strategies than were currently practiced by any of the farms visited in this study.
The model for the overall categorization also lacked (elements of) the ‘appropriate behaviour’ principle. This is not surprising as the observed range for ‘appropriate behaviour’ and its elements was very narrow, with the exception of the range of the ‘qualitative behavioural assessment’ measure (i.e. the ‘positive emotional state’ criterion). This last criterion varied more, but such variance never led to principle scores <15 or >50, therefore not affecting overall classification.
In conclusion, the WQ integration emphasizes indicators of questionable validity whereas indicators of health and behaviour have little effect on the overall classification – which discriminates poorly when applied to intensively reared indoor flocks. This calls for an adjustment of the integration system. This may have to start with the way scores of individual animals are integrated into a flock-level measure score, as measure-level variance was poor for several measures. The WQ Network (www.welfarequalitynetwork.net) is currently reviewing the integration.
Acknowledgements
This study was funded by the Belgian Federal Public Service of Health, Food Chain Safety and Environment through the contract [RT 13/1 ANASPAR]. The authors thank Dimitri van Grembergen for data collection, and the farmers and slaughterhouses for providing access to flocks and records.