Introduction
Depression is a common mental health problem that has effects on interpersonal (Hames et al., Reference Hames, Hagan and Joiner2013) and social functioning (Hirschfeld et al., Reference Hirschfeld, Montgomery, Keller, Kasper, Schatzberg, Möller, Healy, Baldwin, Humble, Versiani, Montenegro and Bourgeois2000; Pulcu and Elliott, Reference Pulcu and Elliott2015; Kupferberg et al., Reference Kupferberg, Bicks and Hasler2016). For example, depressed individuals are found to experience low levels of happiness in social interactions (lack of social pleasure) and reduced motivation to participate in social activities (Hammen, Reference Hammen2005). This social dysfunction remains persistent even after 3-year recovery from depressive symptoms (Rhebergen et al., Reference Rhebergen, Beekman, de Graaf, Nolen, Spijker, Hoogendijk and Penninx2010), thus it is proposed to be a trait abnormality (Hirschfeld et al., Reference Hirschfeld, Montgomery, Keller, Kasper, Schatzberg, Möller, Healy, Baldwin, Humble, Versiani, Montenegro and Bourgeois2000). For these reasons, it is critical to advance the mechanistic understanding of social dysfunction (and its neurobehavioural underpinnings) in depression to inform prevention and interventions.
Theorists have proposed that increased sensitivity to, and maladaptive regulation of social exclusion may be factors that can help to explain social dysfunction in depression (Davey et al., Reference Davey, Allen, Harrison and Yucel2011; Silk et al., Reference Silk, Siegle, Lee, Nelson, Stroud and Dahl2014; Jankowski et al., Reference Jankowski, Batres, Scott, Smyda, Pfeifer and Quevedo2018). Social exclusion (social pain or ostracism) means that individuals (or groups) are being separated from the desired relationships, or being devalued by peers or groups in a desired relationship (Macdonald and Leary, Reference Macdonald and Leary2005). Social exclusion usually decreases self-esteem (Onoda et al., Reference Onoda, Okamoto, Nakashima, Nittono, Yoshimura, Yamawaki, Yamaguchi and Ura2010) and produces a strong threat to basic human needs (such as the need to belong and the need for control) (Williams, Reference Williams2007). Individuals who perceive social exclusion will have negative emotional experience and hurt feelings (Eisenberger et al., Reference Eisenberger, Lieberman and Williams2003). This kind of social pain will lead to psychological responses similar to those caused by physical pain (Riva et al., Reference Riva, Wirth and Williams2011).
As a typical negative social experience, social exclusion has a close relationship with sadness and depression (Allen and Badcock, Reference Allen and Badcock2003; Macdonald and Leary, Reference Macdonald and Leary2005). First, previous studies demonstrated that social isolation (Cacioppo et al., Reference Cacioppo, Hawkley and Thisted2010), feelings of loneliness (Rosenquist et al., Reference Rosenquist, Fowler and Christakis2011), and low perceived emotional social support (Jacobson et al., Reference Jacobson, Lord and Newman2017) are all important symptoms of depression (van den Brink et al., Reference van den Brink, Schutter, Hanssen, Elzinga, Rabeling-Keus, Stek, Comijs, Penninx and Oude Voshaar2018). Second, social exclusion plays a prominent role in the development (Ayduk et al., Reference Ayduk, Downey and Kim2001; Nolan et al., Reference Nolan, Flynn and Garber2003; Slavich et al., Reference Slavich, O'Donovan, Epel and Kemeny2010; Van Orden and Joiner, Reference Van Orden, Joiner and DeWall2013) and maintenance (Liu et al., Reference Liu, Kraines, Massing-Schaffer and Alloy2014) of depression. Third, depressed individuals are reported to have a low threshold for experiencing social pain, so they are more sensitive to social exclusion (Macdonald and Leary, Reference Macdonald and Leary2005; Ehnvall et al., Reference Ehnvall, Mitchell, Hadzi-Pavlovic, Parker, Frankland and Loo2014) and have greater difficulty in recovering from social exclusion compared to non-depressed people (Hsu et al., Reference Hsu, Sanford, Meyers, Love, Hazlett, Walker, Mickey, Koeppe, Langenecker and Zubieta2015; Jobst et al., Reference Jobst, Sabass, Palagyi, Bauriedl-Schmidt, Mauer and Sarubin2015). Notably, rejection sensitivity is the most common symptom of atypical depression (Quitkin, Reference Quitkin2002) and long-standing pattern of interpersonal rejection sensitivity is used as one of the specifiers for the diagnosis of atypical depression (APA, 2013). Taken together, these findings provide convergent evidence that the association between social exclusion and depression is reciprocal (Kupferberg et al., Reference Kupferberg, Bicks and Hasler2016); they could affect each other in a vicious cycle (Fung et al., Reference Fung, Xu, Glazier, Parson, Alden, Riva and Eck2016).
In response to the negative and painful emotions elicited by social exclusion, effective emotion regulation provides a helpful coping strategy. However, dysregulation of emotion is one of the core features of depression (Rive et al., Reference Rive, van Rooijen, Veltman, Phillips, Schene and Ruhe2013; Donofry et al., Reference Donofry, Roecklein, Wildes, Miller and Erickson2016). Growing evidence indicates that depression is associated with emotion dysregulation in social contexts. For example, emotion regulation difficulties can predict depressive symptoms even after controlling for the effect of social anhedonia, indicating that deficits in regulation of social emotions serve as a significant vulnerability factor for depression (Atherton et al., Reference Atherton, Nevels and Moore2015). Furthermore, it has been found that depressed individuals, compared to healthy controls, have more indicators of emotion dysregulation when facing social exclusion (e.g. stronger negative mood, more intentions to engage in passive behaviours; Bauriedl-Schmidt et al., Reference Bauriedl-Schmidt, Jobst, Gander, Seidl, Sabaß, Sarubin, Mauer, Padberg and Buchheim2017).
Meta-analyses and systematic review of neuroimaging studies in healthy people have revealed that both the dorsal and ventral lateral prefrontal cortices (DLPFC and VLPFC) are core regions involved in emotion regulation (Buhle et al., Reference Buhle, Silvers, Wager, Lopez, Onyemekwu, Kober, Weber and Ochsner2014; Kohn et al., Reference Kohn, Eickhoff, Scheller, Laird, Fox and Habel2014), especially in down-regulation of negative emotions (Zilverstand et al., Reference Zilverstand, Parvaz and Goldstein2017). Consistent with these findings, studies in depression population found reduced neural activation of lateral prefrontal cortex (LPFC) in patients compared to healthy controls when participants down-regulated negative emotional experiences (Rive et al., Reference Rive, van Rooijen, Veltman, Phillips, Schene and Ruhe2013; Zilverstand et al., Reference Zilverstand, Parvaz and Goldstein2017). Meanwhile, it has been revealed that increased activity in LPFC when regulating negative emotion predicted a decrease in depression severity over 6 months, indicating that the enhancement of prefrontal engagement during emotion regulation could remit depression symptoms (Heller et al., Reference Heller, Johnstone, Peterson, Kolden, Kalin and Davidson2013).
Although both the DLPFC and VLPFC are involved in emotion regulation, some studies have demonstrated that these two prefrontal regions might play different roles: while the DLPFC is associated with holding reappraisal goals in mind (Wager and Smith, Reference Wager and Smith2003), the VLPFC is usually related to the selection of appropriate reappraisal strategies (Morawetz et al., Reference Morawetz, Bode, Baudewig, Kirilina and Heekeren2016). More importantly, the role of VLPFC has been highlighted for down-regulation of negative emotion feelings induced by social reasons such as social exclusion and/or rejection (Riva and Eck, Reference Riva and Eck2016; Vijayakumar et al., Reference Vijayakumar, Cheng and Pfeifer2017). For instance, researchers observed that the VLPFC (especially its right hemisphere part) activated significantly when individuals experienced social rejection/exclusion (Eisenberger et al., Reference Eisenberger, Lieberman and Williams2003; Onoda et al., Reference Onoda, Okamoto, Nakashima, Nittono, Yoshimura, Yamawaki, Yamaguchi and Ura2010), and the enhanced activation of the right VLPFC (RVLPFC) was negatively correlated with the intensity of self-reported social pain (Eisenberger et al., Reference Eisenberger, Lieberman and Williams2003; Masten et al., Reference Masten, Eisenberger, Borofsky, McNealy, Pfeifer and Dapretto2011). Meanwhile, the RVLPFC activation was found to be weaker in people with high, compared to low, rejection sensitivity when they suffered from social exclusion (Kross et al., Reference Kross, Egner, Ochsner, Hirsch and Downey2007). In studies focusing on depressed people, it was found that while depressed patients exhibited abnormal responses in DLPFC for emotion regulation tasks without social scenarios (Donofry et al., Reference Donofry, Roecklein, Wildes, Miller and Erickson2016), they showed reduced activity in the RVLPFC in response to social exclusion images compared to controls, suggesting a critical role of RVLPFC in mediating social emotion regulation in people with depression (Elliott et al., Reference Elliott, Lythe, Lee, McKie, Juhasz, Thomas, Downey, Deakin and Anderson2012).
To further investigate the role of RVLPFC in emotion regulation of social pain, Riva et al. (Reference Riva, Romero, Dewall and Bushman2012, Reference Riva, Romero, DeWall, Chester and Bushman2015) used transcranial direct current stimulation (tDCS) and found that this brain region has a causal effect on reducing negative emotional responses and aggression induced by social exclusion. Meanwhile, Hsu et al. (Reference Hsu, Yttredahl and Sankar2018) excited the RVLPFC using anodal tDCS and found attenuated subjective changes in mood, self-esteem and rumination after romantic rejection. However, these studies did not require participants to perform an explicit task of emotion regulation, but examined the function of RVLPFC in an implicit way. Therefore, we recently used a standard emotion regulation task and directly verified the role of RVLPFC in emotion regulation of social exclusion (He et al., Reference He, Lin, Xia, Liu, Zhang and Elliott2018). In particular, we applied anodal tDCS over the RVLPFC and found this region had a causal effect on down-regulation of negative emotions produced by social exclusion (He et al., Reference He, Lin, Xia, Liu, Zhang and Elliott2018). This finding motivated us to further explore whether the excitation of RVLPFC could improve the capacity of emotion regulation of social distress in people with depression, given that this population usually show reduced recruitment of RVLPFC when experiencing negative social emotions (Elliott et al., Reference Elliott, Lythe, Lee, McKie, Juhasz, Thomas, Downey, Deakin and Anderson2012).
The main purpose of the current study was to determine whether increased prefrontal activation in depression-prone individuals could improve their emotion regulation capacities in scenarios of social exclusion, and whether the neural excitation method could be helpful for developing interventions targeting social dysfunction. We selected individuals with depressive mood (DM) instead of depressed patients in this study in order to exclude the influence of antidepressant medications or other clinical treatments on the tDCS effect. Another important question, not addressed in previous studies focusing on VLPFC, is whether there is a differential effect of emotion regulation on negative feelings with ‘personal’ and ‘social’ origins. Thus, the second purpose of this study was to examine the specificity of RVLPFC to social emotion regulation, i.e. whether social emotion regulation is more dependent on this brain area compared to the emotion regulation of personal events. In line with our previous work (He et al., Reference He, Lin, Xia, Liu, Zhang and Elliott2018), this study used subjective rating of negative emotional experience as the main index to assess the emotion regulation effects; also, two measures of eye-tracker recording, i.e. pupil diameter and gaze fixation, were used as contemporary indexes to give an objective assessment of physiological arousal (Bradley et al., Reference Bradley, Miccoli, Escrig and Lang2008; Kinner et al., Reference Kinner, Kuchinke, Dierolf, Merz, Otto and Wolf2017) and attention allocation (van Reekum et al., Reference van Reekum, Johnstone, Urry, Thurow, Schaefer, Alexander and Davidson2007) in the participants during the emotion regulation task.
Materials and methods
Participants
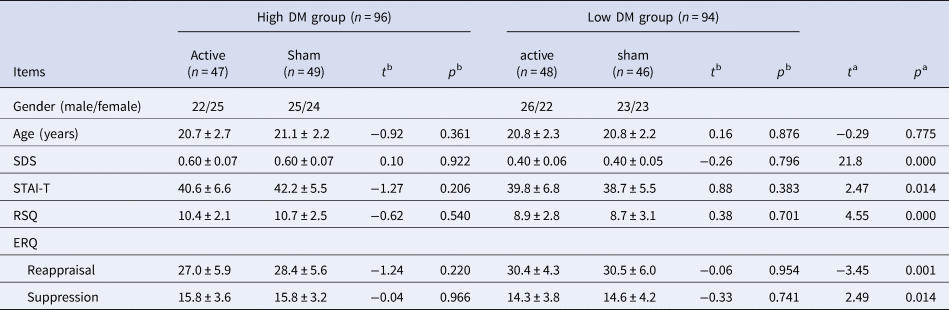
Participants were recruited from Shenzhen University. They were screened using the Beck Depression Inventory Second Edition (BDI-II; Beck et al., Reference Beck, Steer and Brown1996) before the invitation to participate in the experiment. The BDI-II consisted of 21 items and scored from 0 to 63, with a higher score indicating a higher DM. Volunteers with scores ⩽13 (low DM; n = 94) and scores ⩾20 (high DM; n = 96) were invited and labelled as low and high DM participants (Table 1). Besides the 190 participants with low or high DM, this study recruited another 54 participants whose BDI-II scores indicated median DM levels (i.e. 13 < BDI-II < 20). Therefore, a total of 244 participants were included. While the 94 low DM and 96 high DM subjects were compared for the main effect of depression, the 54 median DM subjects were added to the data in order to build a multiple regression model based on a sample with various levels of depression (see ‘Statistics’ section). All participants were right-handed with normal or corrected-to-normal vision; none of them had a history of epilepsy or brain injury. The study protocol was approved by the Ethics Committee of Shenzhen University. Prior to the experiment, participants signed an informed consent form.
Demographical characteristics of the four groups of participants

SDS, Self-Rating Depression Scale; STAI-T, the Trait form of Spielberger's State-Trait Anxiety Inventory; RSQ, Rejection Sensitivity Questionnaire; ERQ, the Emotion Regulation Questionnaire.
Independent samples t test was performed (two-tailed) between high and low DM groups (noted as a) and between active and sham stimulation groups (noted as b).
The experiment was conducted within a week of screening. Before the experiment, participants completed the Self-rating Depression Scale (SDS; Zung et al., Reference Zung, Richards and Short1965; SDS < 0.5 indicates no depression while SDS > 0.5 indicates depression), the Trait form of Spielberger's State-Trait Anxiety Inventory (STAI-T; Spielberger et al., Reference Spielberger, Gorsuch, Lushene, Vagg and Jacobs1983), Rejection Sensitivity Questionnaire (RSQ; Downey and Feldman, Reference Downey and Feldman1996), and Emotion Regulation Questionnaire (ERQ; Gross and John, Reference Gross and John2003; including two subscales of emotional regulation strategies, i.e. cognitive reappraisal and expressive suppression).
During the experiment, participants were randomly assigned into active and sham stimulation groups. For the 190 high and low DM subjects, 95 participants received an active stimulation (47 v. 48 in the high v. low DM group) while the other 95 participants received a sham stimulation (49 v. 46 in the high v. low DM group). There were no significant differences in demographical data between the two tDCS groups (Table 1). For the 54 median DM subjects, 26 v. 26 ones received active v. sham tDCS.
Stimuli
This study used 60 social exclusion images and 60 individual negative images (Fig. 1a). The social exclusion images were the same image set as in our previous study (He et al., Reference He, Lin, Xia, Liu, Zhang and Elliott2018); each image included one rejectee (the person being excluded) and a group of rejectors (the people interacting with each other and excluding the rejectee). The individual negative images were selected from International Affective Picture System (Lang et al., Reference Lang, Bradley and Cuthbert1995), Chinese Affective Picture System (Bai et al., Reference Bai, Ma, Huang and Luo2005), and the Internet. All the 120 images were assessed by another 20 demographically similar college students with low DM. Nine-point-scale ratings showed that there was no significant difference in valence (t 19 = −1.3, p = 0.108; individual negativity = 2.7 ± 0.8; social exclusion = 2.5 ± 0.7; 0 indicates the most negative and 9 indicates the most positive) or arousal (t 19 = 1.4, p = 0.094; individual negativity = 3.4 ± 1.6; social exclusion = 3.7 ± 2.0; 0 and 9 indicate the least and the most arousing) between the two categories of images.
Experimental paradigm and sample images. (a) Sample images of individual negativity and social exclusion. The polygonal areas in the image of social exclusion defined the AOIs for data analysis, with a black area indicating the rejectee and a grey area indicating the rejecters. For the sake of copyright, the persons in the sample images are replaced by the graduate students in the research group. All the four persons in the picture gave their consent for the material to appear in academic journals. (b) Stimulus presentation in one experiment trial in no-reappraisal and reappraisal blocks.

The brightness and contrast of the images were matched between the two categories. All images were presented on an LCD monitor with a visual angle of 3.0 × 3.5°.
Study design and experimental procedure
The study had four variables. The two within-subject factors were regulation type (no-reappraisal v. reappraisal) and category of image (individual negativity v. social exclusion). The two between-subject factors were tDCS type (active v. sham stimulation) and depressive tendency (low v. high DM).
The experimental procedure was adapted from Elliott et al. (Reference Elliott, Lythe, Lee, McKie, Juhasz, Thomas, Downey, Deakin and Anderson2012) and Ochsner et al. (Reference Ochsner, Ray, Cooper, Robertson, Chopra, Gabrieli and Gross2004). In general, a series of images were presented and participants were asked to imagine being the person in the picture. We selected this task (see also Riva et al., Reference Riva, Wirth and Williams2011; Chen and Williams, Reference Chen and Williams2012) because of the following reasons: (1) our previous study used this task (He et al., Reference He, Lin, Xia, Liu, Zhang and Elliott2018) and we want to repeat the previous findings using the same task; (2) this paradigm allows for comparing gaze fixation between rejectee and rejecters while other paradigms such as Cyberball (Eisenberger et al., Reference Eisenberger, Lieberman and Williams2003) and Chat Rooms (Williams et al., Reference Williams, Govan, Croker, Tynan, Cruickshank and Lam2002) do not show the person being excluded (note: Cyberball usually shows hands of the participant but not full-length portrait; Williams and Jarvis, Reference Williams and Jarvis2006); and (3) this task does not need a cover story or fake participants, which makes it fast and easily applicable to lab experiments.
The whole task was divided into four blocks, corresponding to the four within-subject conditions. In order to avoid carry-over effects caused by the reappraisal instruction, the passive viewing task was always performed before the cognitive reappraisal task (see also He et al., Reference He, Lin, Xia, Liu, Zhang and Elliott2018). The 60 individual negative images and 60 social exclusion images were randomly assigned to no-reappraisal and reappraisal blocks, i.e. each block contained 30 images. The order of individual image and social image blocks was balanced across participants. The whole task took 30 min.
As shown in Fig. 1b, each trial began with a central fixation of 2 s, followed by an 8 s image presentation, during which participants were required to watch passively (no-reappraisal block) or down-regulate their negative emotions (reappraisal block). They were then asked to report their level of negative feeling on a 9-point scale (a high score indicated a high level of negativity) using a mouse.
When passively viewing individual negative images, participants were instructed as follows: ‘in this section, please think about how you would feel in a situation similar to that of the person in the picture’. When reappraising individual negative images, participants were instructed as follows: ‘in this section, please image a better outcome or find a different explanation of the situation. For example, you could imagine that the upsetting event that makes the person uncomfortable is caused by misjudgment, or the person could make some change and succeed very soon. After you re-interpret the nature of the scene, please think about how you would feel in this situation if you were the person in the picture’.
When passively viewing social exclusion images, participants were instructed as follows: ‘in this section, please think about how you would feel in a situation similar to that of the person alone in the picture’. When reappraising social exclusion images, participants were instructed as follows: ‘in this section, please image a better outcome or find a different explanation of the situation. For example, you could imagine that the group of people who are interacting with each other are talking about something that the person alone is not interested in, or the person alone could make some change and join the group very soon. After you re-interpret the nature of the scene, please think about how you would feel in this situation if you were the person alone in the picture’.
It should be noticed that cognitive reappraisal mainly includes two strategies, i.e. distancing (see the image from a third-person perspective) and reinterpretation (re-evaluate the situation by changing its outcomes or using a different explanation) (Kanske et al., Reference Kanske, Heissler, Schönfelder, Bongers and Wessa2011; Denny and Ochsner, Reference Denny and Ochsner2014; Zilverstand et al., Reference Zilverstand, Parvaz and Goldstein2017). This study only used the reinterpretation strategy, i.e. participants were required to reappraise images from a first-person perspective. We used one strategy (reinterpretation) instead of two because it could avoid the confounding effect caused by the perspectives taken between strategies (first- v. third-person), i.e. distancing needs a third-person perspective while reinterpretation requires a first-person perspective (He et al., Reference He, Lin, Xia, Liu, Zhang and Elliott2018).
tDCS manipulation
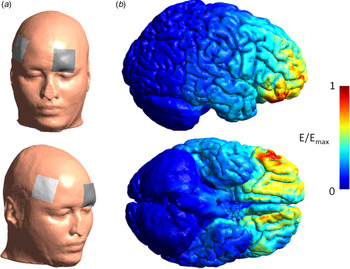
The tDCS device (Brainstim; EMS, Bologna, Italy) and its parameters were the same as in our previous study (He et al., Reference He, Lin, Xia, Liu, Zhang and Elliott2018). In particular, the electrode size was 5 × 5 cm. The anode electrode was placed at the site of F6 according to the international 10/20 EEG system (Riva et al., Reference Riva, Romero, DeWall, Chester and Bushman2015; Cai et al., Reference Cai, Li, Liu, Li, Feng, Wang, Chen and Xue2016; He et al., Reference He, Lin, Xia, Liu, Zhang and Elliott2018) and the cathodal electrode was placed at the site of Fp1 (Miranda et al., Reference Miranda, Lomarev and Hallett2006; Feeser et al., Reference Feeser, Prehn, Kazzer, Mungee and Bajbouj2014; Riva et al., Reference Riva, Romero, DeWall, Chester and Bushman2015; He et al., Reference He, Lin, Xia, Liu, Zhang and Elliott2018; Fig. 2a). The current intensity was set to 2.5 mA (0.1 mA/cm2), which has been shown to be safe for healthy adults (Koenigs et al., Reference Koenigs, Ukueberuwa, Campion, Grafman and Wassermann2009; Cogiamanian et al., Reference Cogiamanian, Vergari, Schiaffi, Marceglia, Ardolino, Barbieri and Priori2011; Fregni et al., Reference Fregni, Nitsche, Loo, Brunoni, Marangolo, Leite, Carvalho, Bolognini, Caumo, Paik, Simis, Ueda, Ekhitari, Luu, Tucker, Tyler, Brunelin, Datta, Juan, Venkatasubramanian, Boggio and Bikson2015; Seibt et al., Reference Seibt, Brunoni, Huang and Bikson2015; He et al., Reference He, Lin, Xia, Liu, Zhang and Elliott2018). For the active stimulation group, current stimulation started 4 min before task onset and lasted for the entire task (a total of 34 min); for the sham stimulation group, current stimulation started 4 min before task onset and lasted for 30 s. The 30 s current stimulation could evoke the itching sensation similar to that evoked under the active stimulation condition, which allowed participants to believe that they were receiving a real tDCS. The stimulation duration of 30 s has been proved to have negligible effects on neural activity (Feeser et al., Reference Feeser, Prehn, Kazzer, Mungee and Bajbouj2014; Riva et al., Reference Riva, Romero, DeWall, Chester and Bushman2015; Marques et al., Reference Marques, Morello and Boggio2018). All 144 participants reported scalp itching at the beginning of the stimulation and believed that they had received current stimulation during the whole task. The simulated electric field is illustrated on an adult brain model in Fig. 2b (SimNIBS software, http://www.simnibs.org; Saturnino et al., Reference Saturnino, Antunes and Thielscher2015).
An illustration of tDCS settings using software SimNIBS. (a) Demonstration of the stimulation site and (b) simulated electric field for the tDCS. The colour represents the electric field strength scaled from 0 (blue) to the individual maximum (red). The maximum of electric field strength locates on the right VLPFC.

Eye-tracker recording and data analysis
The laboratory was illuminated using an LED ceiling lamp with a constant brightness (25 lux). Gaze fixation and pupil diameter were sampled at 60 Hz by a desk-mounted eye tracker [D6; Applied Science Laboratories (ASL), Bedford, USA].
This study employed the two measures provided by the ASL Result Plus. The first measure was pupil diameter. Blinks and missing data (18.2 ± 6.2% per individual) were linearly interpolated by the software. The baseline for pupil diameter was assessed by averaging data during the first 167 ms (the first 10 time samples) after the onset of the image (Silk et al., Reference Silk, Dahl, Ryan, Forbes, Axelson, Birmaher and Siegle2007, Reference Silk, Stroud, Siegle, Dahl, Lee and Nelson2012; Vanderhasselt et al., Reference Vanderhasselt, Remue, Ng, Mueller and De Raedt2015, Reference Vanderhasselt, De Raedt, Nasso, Puttevils and Mueller2018). Then the change in pupil diameter was calculated by subtracting baseline pupil diameter from diameter during a trial.
The second measure was fixation duration. Fixations were defined as a minimal time of 50 ms spent within a 50-pixel diameter region (van Reekum et al., Reference van Reekum, Johnstone, Urry, Thurow, Schaefer, Alexander and Davidson2007). For each image under the social exclusion condition, two polygons were manually drawn to create two areas of interest (AOIs) denoting the ‘rejectee’ and the ‘rejectors’, respectively (Fig. 1a). The percentage of fixation duration was calculated by dividing the fixation duration on the two AOIs by the total fixation duration (Lohani and Isaacowitz, Reference Lohani and Isaacowitz2014; Manera et al., Reference Manera, Samson, Pehrs, Lee and Gross2014; Yi et al., Reference Yi, Feng, Quinn, Ding, Li, Liu and Lee2014; He et al., Reference He, Lin, Xia, Liu, Zhang and Elliott2018).
The eye-tracker data were recorded only in 103 subjects due to availability of the eye-tracker device. Among these subjects, 51 were in the active stimulation group (25 v. 26 in the high v. low DM group) and 52 were in the sham group (25 v. 27 in the high v. low DM group).
Statistics
Descriptive data are presented as mean ± standard deviation, unless otherwise mentioned. All tests were two-tailed and significance level was set at a probability of p < 0.05. Statistical analyses were performed using SPSS Statistics 20.0 (IBM, Somers, USA). Negative emotion rating was given by participants in each trial and averaged across trials under each condition.
For the 190 high and low DM subjects, repeated-measures analysis of variances (ANOVAs) were used to examine influential factors of negative emotion ratings and the two eye-tracker measures. The between-subject factors were tDCS type and DM, while the within-subject factors were regulation type, category of image, and AOI (rejectee v. rejecters).
For all the 244 subjects, a multiple linear regression model was built (enter method) with negative emotion rating as the dependent variable. Predictors of the model included individual difference measures (gender, age, SDS, STAI-T, RSQ, and ERQ) and tDCS type (active v. sham). Cohen's f 2 was used to measure the effect size of regression models; effect sizes of 0.02, 0.15, and 0.35 are considered as small, medium, and large, respectively.
It should be noted that the ANOVA and multiple regression model for negative emotion ratings were used to serve different purposes. The primary aim of this study was to compare the emotion regulation between individuals with high and low DM, and the ANOVA was used to examine this group difference based on 94 low and 96 high DM subjects. In addition to this main purpose, this study also explored which individual characteristics/features could influence emotion regulation, and regression analysis was performed. Considering that the 94 low and 96 high DM subjects did not cover the whole score range of the BDI-II, we additionally recruited 54 median DM participants to produce a representative sample with various levels of depression (n = 244).
Results
Rating of negative emotion
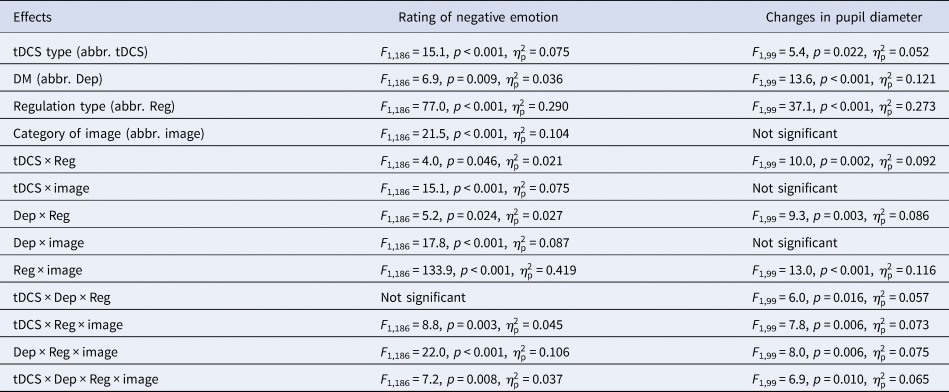
Statistical results of ANOVAs are listed in Table 2. The main effect of regulation type was significant: the rating of negative emotion was lower in the reappraisal block (5.0 ± 1.3) as compared to that in the no-reappraisal block (5.6 ± 1.0). The main effect of category of image was significant: individual negative images (5.4 ± 1.1) were reported to be more negative than social exclusion images (5.2 ± 1.3). The main effect of DM was marginally significant: high DM participants reported higher ratings of negative emotion (5.5 ± 1.0) than low DM participants (5.2 ± 1.3). The main effect of tDCS type was significant: participants in the active stimulation group reported lower ratings of negative emotion (5.1 ± 1.3) than participants in the sham stimulation group (5.6 ± 1.0).
Significant results of the ANOVAs

We observed significant two-way interactions between task and tDCS type, between category of image and tDCS type, and between regulation type and category of image. Further, the three-way interaction of regulation type × category of image × tDCS type was significant (Fig. 3a). To break down the three-way interaction, we tested the interaction between regulation type and tDCS type for individual and social images respectively. For social exclusion images, the interaction of regulation type × tDCS type was significant (F 1,188 = 8.7, p = 0.004,  $\eta _{\rm p}^2 $ = 0.044): although participants in the active stimulation group reported reduced rating of negative emotion in both tasks compared to participants in the sham group, the reduction of negativity rating was more significant in the reappraisal (active v. sham = 4.3 ± 1.4 v. 5.2 ± 1.1) than the no-reappraisal block (active v. sham = 5.4 ± 1.2 v. 5.9 ± 0.8). However for individual negative images, the interaction of regulation type × tDCS type was not significant: the tDCS manipulation influenced both tasks to a similar extent.
Results of emotion rating and pupil diameter. (a) The three-way interaction on ratings of negative emotion (left subplot) and changes in pupil diameter (right subplot). The three interacted factors are regulation type (no-reappraisal v. reappraisal), category of image (individual negative v. social exclusion image), and tDCS type (sham v. active stimulation). Statistical results are given in Table 2. For social exclusion images, although participants in the active stimulation group showed reduced rating of negative emotion and pupil diameters in both tasks compared to participants in the sham group, the reduction of measures was more significant in the reappraisal (negativity rating: F 1,188 = 25.8, p < 0.001,  $\eta _{\rm p}^2 $ = 0.121; pupil diameter: F 1,101 = 11.8, p = 0.001,
 $\eta _{\rm p}^2 $ = 0.104) than the no-reappraisal block (negativity rating: F 1,188 = 9.8, p = 0.002,
 $\eta _{\rm p}^2 $ = 0.050; pupil diameter: F < 1); however the interaction of regulation type × tDCS type was not significant for individual negative images. (b) The three-way interaction on the measure reappraisal advantage of emotion rating (left subplot) and pupil diameter (right subplot). The three interacted factors are category of image, tDCS type, and DM (low v. high DM individuals). For both measures, the four-way interaction of regulation type × category of image × tDCS type × DM was significant (emotion rating: F 1,186 = 7.2, p = 0.008; pupil diameter: F 1,99 = 6.9, p = 0.010). The measure reappraisal advantage was defined as the differential rating between no-reappraisal and reappraisal tasks and simplified the four-way interaction to a three-way interaction. For the active stimulation group, the interaction between category of image and DM was significant (emotion rating: F 1,94 = 27.6, p < 0.001,
 $\eta _{\rm p}^2 $ = 0.227; pupil diameter: F 1,49 = 22.4, p < 0.001,
 $\eta _{\rm p}^2 $ = 0.313); however for the sham stimulation group, this two-way interaction was not significant. Error bars represent standard error of the mean. **p < 0.01, ***p < 0.001.

We also observed significant two-way interactions between regulation type and DM, between category of image and DM, as well as a three-way interaction of regulation type × category of image × DM. We also observed a significant four-way interaction of regulation type × category of image × tDCS type × DM. To interpret the four-way interaction, we defined a measure called reappraisal advantage as the differential rating between no-reappraisal and reappraisal tasks. As a result, the four-way interaction was simplified to a three-way interaction of category of image × tDCS type × DM (F 1,186 = 7.2, p = 0.008,  $\eta _{\rm p}^2 $ = 0.037; Fig. 3b). To interpret the three-way interaction, we tested the interaction between category of image and DM for active and sham stimulation groups. For the active stimulation group, this two-way interaction was significant: while low DM group (1.63 ± 1.14) had a larger reappraisal advantage than high DM group (0.74 ± 0.79) for social exclusion images, the two groups did not show significant difference in reappraisal advantage for individual negative images (high v. low = 0.27 ± 0.80 v. 0.19 ± 1.17). Also, both the effect of DM (F 1,94 = 5.1, p = 0.026,
 $\eta _{\rm p}^2 $ = 0.052) and category of image were significant (F 1,94 = 107.3, p < 0.001,
 $\eta _{\rm p}^2 $ = 0.533). However for the sham stimulation group, neither the interaction between category of image and DM nor the effect of DM was significant; only the effect of category of image was significant (F 1,92 = 36.4, p < 0.001,
 $\eta _{\rm p}^2 $ = 0.284).
Finally, four multiple regression models were built with negative emotion ratings under the four within-subject conditions as single-dependent variables and individual difference measures (gender, age, SDS, STAI-T, RSQ, and ERQ reappraisal) as well as tDCS type (active = 1, sham = 0) as predictors (enter method; n = 244). For the negative emotion rating in the reappraisal of social exclusion images, tDCS type (standardised coefficient β = −0.376, t = −6.7, p < 0.001), SDS score (β = 0.254, t = 4.3, p < 0.001) and STAI-T score (β = 0.208, t = 3.6, p < 0.001) are three significant predictors (R 2 = 0.272, F 7,236 = 12.6, p < 0.001, f 2 = 0.374). Similarly, tDCS type (β = −0.365, t = −6.3, p < 0.001), SDS score (β = 0.211, t = 3.6, p < 0.001) and STAI-T score (β = 0.175, t = 2.8, p = 0.005) are also three significant predictors for the negative emotion rating in the reappraisal of individual negative images (R 2 = 0.222, F 7,236 = 9.6, p < 0.001, f 2 = 0.285). However for the negative emotion rating in the non-reappraisal of social exclusion images and individual negative images, only tDCS type (social exclusion: β = −0.235, t = −3.8, p < 0.001; individual negativity: β = −0.201, t = −3.2, p = 0.002) is the significant predictor (social exclusion: R 2 = 0.095, F 7,236 = 3.5, p = 0.001, f 2 = 0.105; individual negativity: R 2 = 0.081, F 7,236 = 3.0, p = 0.005, f 2 = 0.088).
Changes in pupil diameter
In general, changes in pupil diameter followed a similar pattern to the findings for rating of negative emotion reported above. Some effects did not reach significance (potentially because there were 190 v. 103 datasets for emotion rating v. eye-tracker data). High correlations were found between ratings of negative emotion and changes in pupil diameter (two-tailed Pearson correlations under 16 conditions of tDCS type × DM × regulation type × category of image; r = 0.478 to 0.644, p = 0.001 to 0.016). Pupil diameter during the task was measured in contrast to baseline (resting state), i.e. it is a relative value. Hereafter we call the measure pupil diameter for the sake of conciseness.
The main effect of regulation type was significant: the pupil diameter was smaller in the reappraisal block (0.231 ± 0.065 mm) as compared to that in the no-reappraisal block (0.246 ± 0.052 mm). The main effect of DM was significant: high DM participants had larger pupil diameters (0.255 ± 0.048 mm) than low DM participants (0.222 ± 0.064 mm). The main effect of tDCS type was significant: the participants in the active stimulation group had smaller pupil diameters (0.228 ± 0.054 mm) than the participants in the sham stimulation group (0.249 ± 0.062 mm).
We observed significant two-way interactions between regulation type and tDCS type and between regulation type and category of image. More importantly, the three-way interaction of regulation type × category of image × tDCS type was significant (Fig. 3a). To break down the three-way interaction, we tested the interaction between regulation type and tDCS type for individual and social images respectively. For social exclusion images, the interaction of regulation type × tDCS type was significant (F 1,101 = 19.7, p < 0.001,  $\eta _{\rm p}^2 $ = 0.163): in the reappraisal block, participants in the active stimulation group had smaller pupil diameter compared to participants in the sham group (0.200 ± 0.067 v. 0.243 ± 0.059 mm); this group difference was not significant in the no-reappraisal block (0.239 ± 0.050 v. 0.252 ± 0.063 mm). However for individual negative images, neither the interaction of regulation type × tDCS type nor the main effect of tDCS type was significant.
We also observed a significant two-way interaction between task and depressive tendency, as well as three-way interactions of regulation type × tDCS type × DM and of regulation type × category of image × DM. The most important finding was the significant four-way interaction of regulation type × category of image × tDCS type × DM. To shrink the four-way interaction, we used the measure reappraisal advantage (the differential pupil diameter between no-reappraisal and reappraisal tasks). As a result, the four-way interaction was simplified to a three-way interaction of category of image × tDCS type × DM (Fig. 3b). To break down the three-way interaction, we tested the interaction between category of image and DM for active and sham stimulation groups. For the active stimulation group, this two-way interaction was significant: while low DM group (0.065 ± 0.040 mm) had a larger reappraisal advantage than high DM group (0.012 ± 0.022 mm) for social exclusion images, the two groups did not show significant difference in reappraisal advantage for individual negative images (high v. low = 0.007 ± 0.015 v. 0.009 ± 0.019 mm). Also, both the main effects of DM (F 1,49 = 33.5, p < 0.001,  $\eta _{\rm p}^2 $ = 0.406) and category of image (F 1,49 = 30.7, p < 0.001,
 $\eta _{\rm p}^2 $ = 0.385) were significant. However for the sham stimulation group, neither the interaction nor the main effects were significant.
Fixation duration
For the measure of fixation duration, the within-subject factors were task and AOI.
The main effect of AOI was significant (F 1,99 = 377.4, p < 0.001, $\eta _{\rm p}^2 $ = 0.792): participants showed longer fixation duration for the AOI of rejectee (54.0 ± 5.2%) than the AOI of rejecters (39.9 ± 5.6%).
A significant two-way interaction was observed between tDCS type and AOI (Fig. 4a): although the fixation duration was longer for the AOI of rejectee than for the AOI of rejecters in both the active (F 1,99 = 247.5, p < 0.001,  $\eta _{\rm p}^2 $ = 0.714; 55.1 ± 4.9 v. 38.9 ± 5.0%) and sham stimulation groups (F 1,99 = 137.4, p < 0.001,
 $\eta _{\rm p}^2 $ = 0.581; 53.0 ± 5.3 v. 41.0 ± 5.9%), this AOI effect was more significant in the active stimulation group.
Results of percentage of fixation duration. (a) Fixation duration under different conditions of tDCS type (sham v. active stimulation), AOI (rejectee v. rejecters), and DM (low v. high DM). The two-way interaction between tDCS type and AOI was significant (F 1,99 = 8.6, p = 0.004,  $\eta _{\rm p}^2 $ = 0.080). (b) Fixation duration under different conditions of regulation type (no-reappraisal v. reappraisal), AOI, and DM. The two-way interaction between regulation type and AOI was significant (F 1,99 = 19.5, p < 0.001,
 $\eta _{\rm p}^2 $ = 0.165). Error bars represent standard error of the mean. **p < 0.01, ***p < 0.001.

Also, the two-way interaction between regulation type and AOI was significant (Fig. 4b): although the fixation duration was longer for the AOI of rejectee than for the AOI of rejecters in both the no-reappraisal (F 1,99 = 231.2, p < 0.001,  $\eta _{\rm p}^2 $ = 0.709; 53.0 ± 4.8 v. 40.5 ± 5.8%) and reappraisal blocks (F 1,99 = 361.9, p < 0.001,
 $\eta _{\rm p}^2 $ = 0.785; 55.1 ± 5.4 v. 39.3 ± 5.3%), this AOI effect was more significant in the reappraisal block. No other main effects or interactions were significant.
Discussion
The current study employed tDCS, a powerful tool for understanding and improving brain function (Filmer et al., Reference Filmer, Dux and Mattingley2014), to investigate the causal relationship between neural excitation of the RVLPFC and social/individual emotion regulation in individuals with high and low depressive levels. There are two main findings. First, tDCS over RVLPFC induced a stronger regulation effect on social exclusion than individual negative emotions. Second, this tDCS improved regulation of social exclusion was reduced in high compared to low DM individuals.
The core test of our hypothesis is the four-way interaction between regulation type, category of image, tDCS type and DM. For social exclusion images, anodal tDCS-activated RVLPFC caused reduced reappraisal advantage (i.e. stronger negative emotional experience) in high compared to low DM individuals; however for individual negative images, the tDCS effect was very limited and showed no difference between the two groups. The findings indicate that the emotion regulation ability of low DM individuals was significantly improved by tDCS over RVLPFC, which provides robust experimental support for the causal contribution of RVLPFC in emotion regulation of social exclusion (He et al., Reference He, Lin, Xia, Liu, Zhang and Elliott2018). Compared to low DM controls, however, high DM individuals benefit less from the tDCS, which may be due to a relatively low threshold of social pain and thus a high sensitivity to social exclusion signals in depressed people (Macdonald and Leary, Reference Macdonald and Leary2005). This notion is supported by the higher self-reported ratings of negative emotion as well as the higher score of rejection sensitivity (Table 1) in high compared to low DM participants. According to Beck's Cognitive Model of Depression (Beck and Bredemeier, Reference Beck and Bredemeier2016), depression is accompanied by the formation of self-negative cognitive schemas. High DM individuals tend to think and reason with a negative bias when they look at things in terms of reduced self-evaluation and increased negative expectations. In this experiment, negative events (experiencing the feeling of the person in negative images) may induce excessive self-blame and self-criticism in high DM individuals with self-negative cognitive schema. The use of a single, short-term tDCS intervention may not significantly decrease the negative emotion induced by social exclusion. Considering that high DM individuals benefit less from tDCS compared to low DM individuals, caution should be taken when tDCS is proposed as a clinical treatment (see also Underwood, Reference Underwood2016; Vannorsdall et al., Reference Vannorsdall, van Steenburgh, Schretlen, Jayatillake, Skolasky and Gordon2016; Medina and Cason, Reference Medina and Cason2017; Boayue et al., Reference Boayue, Csifcsák, Aslaksen, Turi, Antal, Groot, Hawkins, Forstmann, Opitz, Thielscher and Mittner2019). We recommend future studies to look at multiple sessions of transcranial magnetic stimulation (TMS) which shows more focused spatial specificity and enhanced effectiveness in clinical applications.
Another possible reason for the less beneficial effect in high DM participants is that depressed individuals are found to use a cognitive reappraisal strategy less frequently than healthy controls (Dryman and Heimberg, Reference Dryman and Heimberg2018; Table 1). Given that RVLPFC is the main area related to cognitive reappraisal (instead of expressive suppression; Dorfel et al., Reference Dorfel, Lamke, Hummel, Wagner, Erk and Walter2014), the stimulation of this region in high DM individuals may not improve their reappraisal performance to the same extent as in low DM individuals. Future studies are needed to test whether depressive individuals with more reappraisal training could benefit more from the tDCS-RVLPFC treatment on emotion regulation. Take a step further, an alternative explanation is that this study chose reinterpretation rather than distancing as the reappraisal strategy. It has been proposed that reinterpretation requires more complicated cognitive processes, and distancing is easier to apply for depressive individuals (Ochsner et al., Reference Ochsner, Ray, Cooper, Robertson, Chopra, Gabrieli and Gross2004; Rive et al., Reference Rive, Mocking, Koeter, van Wingen, de Wit, van den Heuvel, Veltman, Ruhé and Schene2015). High DM participants in our study may find it difficult to use reinterpretation strategy, which compromised their emotion regulation effect. While the current study employed the emotion regulation instruction (reappraisal with a reinterpretation strategy) that was proved effective for low DM participants in our previous study (He et al., Reference He, Lin, Xia, Liu, Zhang and Elliott2018), a valuable avenue for future investigation is to apply distancing strategy to examine whether participants with depression may have more improvement on emotion regulation from stimulated-RVLPFC.
The second finding of this study is that the tDCS-activated RVLPFC produced a larger beneficial effect for emotion regulation of negative experience evoked by social compared to nonsocial events. This result confirms the finding of our previous study (He et al., Reference He, Lin, Xia, Liu, Zhang and Elliott2018) that the RVLPFC has a causal effect on emotion regulation of social exclusion. Previous neuroimaging studies have revealed that the dorsal anterior cingulate cortex (dACC) is the hub of social exclusion processing, and that the RVLPFC down-regulates the social pain via inhibiting the activation of dACC (Eisenberger et al., Reference Eisenberger, Lieberman and Williams2003). In line with the current finding, we speculate that the beneficial effect of RVLPFC on social emotion regulation is due to its modulation of the dACC activity, and increased excitability of RVLPFC caused by tDCS may facilitate prefrontal modulation of dACC response, leading to enlarged emotion reappraisal effect. To verify the idea, we suggest the following study combining tDCS with brain imaging techniques to further investigate the brain mechanism of social exclusion regulation associated with VLPFC and dACC (Riva et al., Reference Riva, Romero, DeWall, Chester and Bushman2015). One might notice that the tDCS targeting at RVLPFC facilitated down-regulation of both individual and social negative feelings, although the effect did not reach significance under individual negative condition (Fig. 3a). This is because while the VLPFC plays a key role in regulation social-related negative emotions (Eisenberger et al., Reference Eisenberger, Lieberman and Williams2003; Masten et al., Reference Masten, Eisenberger, Borofsky, Pfeifer, McNealy, Mazziotta and Dapretto2009; Onoda et al., Reference Onoda, Okamoto, Nakashima, Nittono, Yoshimura, Yamawaki, Yamaguchi and Ura2010; Yanagisawa et al., Reference Yanagisawa, Masui, Furutani, Nomura, Ura and Yoshida2011), emotion regulation associated with nonsocial events/reasons mainly depends on the DLPFC (Buhle et al., Reference Buhle, Silvers, Wager, Lopez, Onyemekwu, Kober, Weber and Ochsner2014; Feeser et al., Reference Feeser, Prehn, Kazzer, Mungee and Bajbouj2014; Kohn et al., Reference Kohn, Eickhoff, Scheller, Laird, Fox and Habel2014; Donofry et al., Reference Donofry, Roecklein, Wildes, Miller and Erickson2016). Before the current work, previous studies examining the role of RVLPFC in emotion regulation were carried out relying on only social exclusion emotions, without presenting individual emotions as baseline (Eisenberger et al., Reference Eisenberger, Lieberman and Williams2003; Masten et al., Reference Masten, Eisenberger, Borofsky, Pfeifer, McNealy, Mazziotta and Dapretto2009; Onoda et al., Reference Onoda, Okamoto, Nakashima, Nittono, Yoshimura, Yamawaki, Yamaguchi and Ura2010; Yanagisawa et al., Reference Yanagisawa, Masui, Furutani, Nomura, Ura and Yoshida2011; Riva et al., Reference Riva, Romero, Dewall and Bushman2012, Reference Riva, Romero, DeWall, Chester and Bushman2015). Also, while recent tDCS studies explored the role of RVLPFC in regulation of negative emotions such as fear, anxiety and sadness (Herrmann et al., Reference Herrmann, Simons, Horst, Boehme, Straube and Polak2018; Vergallito et al., Reference Vergallito, Riva, Pisoni and Romero2018), down-regulation of negative feelings evoked by social exclusion has been neglected. The novel contribution of this study is to test whether the RVLPFC plays a more prominent role in emotion regulation of social compared to individual originated experiences. The current finding suggests that the RVLPFC is a direct and valid target for the treatment of social emotion dysregulation. Excitement of this brain region with tDCS is expected to significantly improve the ability of emotion regulation in patients with social dysfunction, such as depression, social anxiety disorder and autism spectrum disorder (Rive et al., Reference Rive, van Rooijen, Veltman, Phillips, Schene and Ruhe2013; Kupferberg et al., Reference Kupferberg, Bicks and Hasler2016).
The linear regression models demonstrated that tDCS manipulation (active or sham) and self-reported depression and anxiety levels were all predictive of the negative emotion rating under the reappraisal condition, and the predictive effect seems more prominent for the emotion regulation of social exclusion (as revealed by a larger effect size of the model) compared to individual negative events. However under the non-reappraisal condition, only tDCS manipulation affected the negative emotion rating. These findings provide two implications for emotion regulation. First, it highlights the RVLPFC as the crucial brain region of emotion regulation, since all the four models included the tDCS manipulation as an effective predictor. Second, the levels of depression and anxiety could influence explicit but not implicit emotion regulation. In line with this notion, some previous studies showed that implicit emotion regulation is not impaired in depressed patients (e.g. Etkin and Schatzberg, Reference Etkin and Schatzberg2011).
In addition to subjective emotion rating of participants, this study also measured pupil diameter to objectively assess the physiological arousal associated with emotional experience (Bradley et al., Reference Bradley, Miccoli, Escrig and Lang2008). Consistent with our previous study (He et al., Reference He, Lin, Xia, Liu, Zhang and Elliott2018), the result of pupil diameter was generally in accordance with the findings of negative emotion rating, i.e. when participants received tDCS during emotion regulation, decreased negative emotion (self-reported ratings) occurs along with decreased emotional arousal (pupil diameter). Therefore, the pupil diameter finding provides peripheral physiological evidence for the tDCS-induced improvement in emotion regulation ability. We also measured fixation duration as an indicator of attention allocation (van Reekum et al., Reference van Reekum, Johnstone, Urry, Thurow, Schaefer, Alexander and Davidson2007). The results perfectly replicate previous findings (He et al., Reference He, Lin, Xia, Liu, Zhang and Elliott2018) that participants had longer fixation duration for rejectee than rejecters in the social exclusion scenario, mainly because participants were instructed to take self-referential first-person perspective throughout the whole experiment. This attention effect was strengthened by both tDCS and reappraisal instruction. The current finding is consistent with previous studies which revealed that the successful emotional down-regulation of social exclusion is accompanied by increased self-concern (Sethi et al., Reference Sethi, Moulds and Richardson2013). It has been established that reappraisal of negative images requires attentional shifting away from highly salient and aversive part of the picture (e.g. the rejecters in the social exclusion image; Clarke et al., Reference Clarke, Horst and Roberts2015), and that the attentional shifting process needs attentional control function associated with the VLPFC (Wager et al., Reference Wager, Davidson, Hughes, Lindquist and Ochsner2008). In line with the idea, the tDCS-activated VLPFC in this study might facilitate emotion regulation by strengthening the ‘self-focused attention'. Interestingly, depression has no effect on this attentional pattern, i.e. no difference was found between high and low DM individuals. This result suggests that deficits of emotion regulation of social exclusion in depressed people may be unrelated to the attention allocation function of the VLPFC.
Another interesting finding is that reappraisal strategy produced better emotion regulation effect on social exclusion than individual negative images. This result is in agreement with a previous finding that cognitive reappraisal attenuated emotion intensity ratings for social v. nonsocial negative pictures, although only trends were observed (Vrticka et al., Reference Vrticka, Sander and Vuilleumier2011). We reason that negative emotion of social pictures is usually due to relatively simple cause (i.e. social exclusion and rejection), which makes it easier to regulate using reappraisal strategies. In contrast, negative emotion evoked by individual unpleasant pictures may come from various and vaguer sources. Thus the use of a single regulation strategy may not produce satisfactory regulation effect.
Some limitations should be noticed when the current results are interpreted. First, while social exclusion images transferred a straightforward meaning of being rejected by a group, individual negative images transferred ambiguous/general meanings (poor work performance/academic record, deceased relatives or friends, unemployment, etc.). We suggest that future studies use individual negative images with more straightforward meanings (e.g. academic failure; e.g. Pfundmair et al., Reference Pfundmair, Graupmann, Frey and Aydin2015) to exclude the potential influence of clear v. ambiguous negative events on results. Second, this study used hypothetical scenarios in which participants were required to image being the person in the picture. This method could not measure the real feeling of participants when they experience negative situation in reality, thus produce reduced ecological and external validity (Wirth, Reference Wirth, Riva and Eck2016). Future studies employing real-time experience [e.g. Cyberball, Chat Rooms, Ostracism Online (Wolf et al., Reference Wolf, Levordashka, Ruff, Kraaijeveld, Lueckmann and Williams2015), and Get-Acquainted Paradigm (Twenge et al., Reference Twenge, Baumeister, Tice and Stucke2001)] are needed to further verify the findings of this study. Third, the current study used self-reported measures of BDI-II and SDS to screen the participants and missed assessing atypical depression which is characterised by prominent rejection sensitivity (APA, 2013). Clinician-rated measures are therefore needed to screen this subtype of depression in future studies so as to examine rejection sensitivity and emotion regulation between atypical v. other subtypes of depression.
In summary, this study found that the tDCS-activated RVLPFC could improve emotion regulation capacity and thus reduce subjective emotion intensity and physiological arousal of negative experience. Results showed that high DM individuals, as compared to low DM controls, did not achieve the same level of tDCS-induced improvement on emotion regulation of social exclusion based on a single session of short-term tDCS. We recommend future studies to use multiple sessions of tDCS or TMS to continue exploring the treatment of impaired social emotion regulation in depression. Furthermore, this study clearly demonstrated that the RVLPFC plays a more prominent role in emotion regulation of social compared to individual originated negative experience, which helps refine the target brain area in treatment protocols for individuals with social dysfunction including social anxiety, autism spectrum disorder and depression.
Acknowledgements
This study was funded by the National Natural Science Foundation of China (31970980), Shenzhen Basic Research Project (JCYJ20180305124305294 and JCYJ20150729104249783), the Training Program for Excellent Young College Faculty in Guangdong (YQ2015143), and Guangdong-Government Funding for Scientific Research (2016KZDXM009).
Conflict of interest
The Authors have declared that there are no conflicts of interest in relation to the subject of this study.