Nomenclature
-
 $X_M,Y_M,Z_M$
-
body-fixed reference frame
-
$F_{jj}$
-
generated forces on each propeller
-
$T_{jj}$
-
generated torque on each propeller
- m
-
mass of the quadrotor
-
$m_c$
-
mass of the payload
-
$k_c$
-
stiffness between the quadrotor and its payload
- x,y,z
-
positions of the quadrotor
-
$x_{des},y_{des},z_{des}$
-
desired positions of the quadrotor
-
$z_c$
-
vertical position of the payload
-
$U_{1c},U_2,U_3,U_4$
-
inputs control
- g
-
gravitational vector
-
$s_{ii}$
-
sliding surfaces, where
$ii=x,y,z,\phi\,\theta,\psi$
-
$e_{ii}$
-
error between the desired and current state variable
-
$I_{ii}$
-
moment of inertia of the quadrotor
-
$I_{ii}^c$
-
moment of inertia of the payload
-
$L_{ii}$
-
Dryden turbulence scale length, where
$kk=x,y,z$
- V
-
wind velocity
-
$C_{dz}$
-
drag coefficient
-
$A_z$
-
area projected by the UAV


Greek Symbols
-
$\omega_{kk}$
-
angular rotation
-
$\phi,\theta,\psi $
-
orientation angles of the quadrotor
-
$\phi_{des},\theta_{des},\psi_{des} $
-
desired orientation angles of the quadrotor
-
$\lambda_{ii}$
-
tuning coefficient associated with the closed loop
-
$\epsilon_{ii}$
-
controller positive parameters
-
$\eta_{ii}$
-
positive real coefficients of the controller
-
$\gamma$
-
transition bandwidth coefficient
-
$\varPhi_{kk}$
-
power spectral density
-
$\sigma_{kk}$
-
Dryden turbulenece intensity
-
$\omega_{ws}$
-
mean wind speed
-
$\rho$
-
air density


Acronym list
- UAVs
-
Unmanned Aerial Vehicles
- SMC
-
Sliding Mode Control
- PD
-
Proportional Derivative
- GMT
-
Ground Moving Target
- CA
-
Control Allocation
- MAVs
-
Multi-Aerial Vehicles
- FDD
-
Fault Detection and Diagnosis
- LQR
-
Linear Quadratic Regulator
- ASMC
-
Adaptive Sliding Mode Control
- IAE
-
Integral of the Absolute magnitude of the Error
- ITAE
-
Integral of Time multiplied by the Absolute Error
- PSD
-
Power Spectral Density
- FFT
-
Fast Fourier Transform
1.0 Introduction
Unmanned Aerial Vehicles (UAVs) have experienced significant growth in the past several years due to their increasing number of applications and to the use of their related continuous improved technology (sensors, cameras, processors). The ability to carry a variety of payloads enables a UAV to perform tasks in multiple scenarios, such as military operations, aerial photography, surveillance [Reference Mohammed, Idries, Mohamed, Jaroodi and Jawhar1], monitoring traffic flow [Reference Heintz, Rudol and Doherty2], environmental monitoring [Reference Dufek, Traore, Swanson, Fipps and Murphy3–Reference Lin, Liu and Wotton5], rapid transport of medicine [Reference Paredes, Acevedo, Villalta and Furukawa6] and delivery tasks in general [Reference Ahmad, Kumar and Patil7–Reference Kim, Gadsden and Wilkerson10]. One of the main applications of UAVs include the commercial delivery of packages, including the transportation of medication, supplies and fragile substances to remote areas [Reference Zuniga, Munoz, Marquez, Espinoza and Carillo11]. Compared to its conventional design (with no payload), the UAV transportation system presents additional challenges, mainly due to the difficulties encountered by suspended payloads, such as much stronger nonlinearities, as well as more complex adverse dynamic coupling [Reference Nascimento and Saska12].
There are several UAV studies focusing on designing their controllers to fly along a desired trajectory, and to reduce the residual vibration. The constraint forces and moments caused by the connections between the quadrotor and its payload were studied to analyse their influence. In Ref. [Reference Lee, Lee, Yoo, Moon, Lee, Kim and ahk13], the payload was attached to a UAV by using a single wire, and a stabilisation method based on PD control was utilised to attenuate the payload oscillations, as well as to obtain the desired flight trajectory. In the presence of the payload stabilisation method, the oscillations are significantly decreased compared to the absence case. In addition, the quadrotor position is well converged into the desired points.
A target tracking algorithm was developed in Ref. [Reference Zhang and Liu14], based on Sliding Mode Control, for a UAV to track a Ground Moving Target (GMT). The purpose of the algorithm was to maintain a circular motion with respect to the GMT during its UAV trajectory. It is supposed to sense its own states and estimates the GMT. The tracking algorithm is based on SMC, which allows regulating the relative displacements between the UAV and the GMT, in terms of position, velocity and acceleration of the target. However, a camera can also be attached to the UAV as an on-board observation sensor to estimate all its system states and to improve the target tracking process. This camera must have great stability regardless of the environmental disturbances and manoeuvers of the UAV, in order to guarantee an accurate state response of the algorithm.
The Sliding Mode Control (SMC) has been investigated due to its robustness for trajectories tracking under external disturbances [Reference Yang and Xian15]. A second-order SMC was validated under different scenarios, where external disturbances were used as adverse conditions. Numerical simulations and experimental tests were performed and revealed that SMC improved the controller performance (when compared to the PID performance), while minimising the overshoot and steady-state errors, even in the presence of significant wind speeds [Reference Elhennawy and Habib16]. The SMC strategy based on the adaptation of the switching matrix was used to design the attitude control law for a UAV(17). The switching matrix is a diagonal matrix with three elements (corresponding to each degree of freedom of the attitude control), which can be adjusted individually according to the proposed flight trajectory. This strategy was proposed to evaluate the controller performance under external disturbances and to model its uncertainties, while conducting to a fast and precise convergence to the altitude variables.
The combination of the Fast Non-Singular Terminal Sliding Mode Control (FNTSMC) and Control Allocation (CA) strategies was investigated to verify the flight performance of Multi-Rotor Aerial Vehicles (MAVs) subjected to external disturbance. It can be used for any aerial vehicle, while the control allocation was responsible for generating the 3-D attitude, and computing individual thrust commands, the FNTSMC technique was used to design the geometric position and attitude control laws. This strategy minimised the thrust commands, as well as guaranteed singularity-free convergence, finite-time stability and robustness against disturbances. A 3-DOF hover experiment was used to validate the proposed control, and it has shown positive control responses despite of bounded force (defined by known parameters) and torque disturbances [Reference Silva and Santos18].
A robust actuator Fault Detection and Diagnosis (FDD) scheme for a UAV was designed in Ref. [Reference Zhong19]. This method has been tested for several conditions, including external disturbances acting on the UAV as well as partial losses in specific motors. This perturbation that the UAV is subjected to (caused by fault and disturbances), might increase exponentially the UAV vibration and its transported mass, which would affect the onboard accuracy, and decrease its flight performance.
Embedded cameras in UAVs were widely used to estimate their positions and velocities; however, they can also be used to estimate their attitude. A downward-facing strapdown camera was used to take landmarks pictures and determine pairs of vector measurements (from the camera to the landmark). The proposed method investigated the measurements determination, and the technique was divided into three modules: the first module used to detect and identify possible landmarks by processing images, the second was used to determine the vector measurement from the camera to landmark center positions, and the third was used to estimate the UAV attitude from the previous vectors [Reference Santos and Gonçalves20]. It is worth mentioning that the camera must have great stability to perform the desired task, and that any significant and continuous disturbance can affect the final results accuracy.
Beyond guiding the quadrotor on a desired trajectory, a high number of controllers are usually designed to attenuate the load motion, even in the presence of external environmental disturbances. Due to its dynamic and under-actuated system, a cascade controller is commonly chosen for this purpose. A passivity based controller was studied to mitigate the payload disturbances on the quadrotor over a desired flight. It was used not only to control the position of the quadrotor, but also to attenuate its payload oscillation. The passivity-based controller model was decoupled into an inner and outer loop sub-models, where the inner loop stabilised the attitude of the quadrotor, while the outer loop controlled the translational dynamics, including its load dynamics [Reference Godbole and Subbarao21].
A cascade control law, based on an uncertainty and disturbance estimator, was designed for a quadrotor with a slung payload. The controller model relied on a combination of two loops, where the outer loop stabilised the quadrotor along a path beyond estimating disturbances, and the inner loop (attitude tracking) was used to control the desired direction of the lift vector. Numerical simulations have shown that the proposed controller stabilised the quadrotor efficiently under different wind disturbances [Reference Qian and Liu22].
An Adaptive Sliding Mode Control (ASMC) was studied to verify the UAV flight performance under disturbances and unknown mass. The purpose of the ASMC was to maintain its controller performance, since the UAV presented the ability to pick up and deliver payloads of unknown mass, while they are subjected to disturbances during the flight. The SMC design is often composed of two parts: a continuous and a discontinuous one. An integral compensation was added in the discontinuous part of the SMC to ensure the sliding motion, even when abrupt changes in the total mass and inertia were addressed. In comparison to the traditional LQR, the proposed strategy gives a better control performance especially during the mass change and release phases [Reference Wang, Mu and Zhang23].
An optimal control model was proposed for a hexarotor that considered different cost functions and various wind loads. Several simulations were conducted using the objective functions such as “minimum effort”, “collision-free” and “windy environment”. The algorithm based on “modified artificial potential field” was chosen to guide the hexarotor to accomplish safe trajectory tracking as well as to avoid obstacle regions. Experimental tests were also performed to demonstrate the effectiveness of the proposed control approach for hexarotors [Reference Heidari and Saska24].
It is known that two kinds of attachments are frequently used: (i) a compartment that is fixed on the quadrotor body and (ii) the swing load payload which moves freely on a rope. According to some parameters, such as the UAV transported mass, distance and velocity, one attachment has been chosen from these two attachments mentioned above. Drones are very well known for transportation purposes especially after Amazon announcements of their plans to use them to deliver packages to customers [Reference Koiwanit25], including for their use for health products transportation. The advantages of rapid delivery of vaccines, medication and supplies exactly in the places where they are needed, motivating researchers’ efforts to work in the area of drones development.
The feasibility of the UAVs use has been explored in human organ transportation. A commercial drone DJJI M600 Pro was used and a smart cooler was attached directly to the UAV body. In addition, biosensors, vibration sensors, temperature, barometric pressure and altitude measurements sensors were added to the load compartment to provide reliable information regarding the transported organ and the UAV trajectory. Since organ tissues are fragile, they can be deteriorated during the flight by excessive vibrations caused by the quadrotor itself or by continuous external disturbances. Therefore, when an appropriate compartment is attached to the correspondent UAV, it guarantees the best quality of the transported product besides reducing the loss of the organ due to logistic factors [Reference Hampson26].
The impact of drone transportation on the insulin quality was also studied. Experiments were conducted to evaluate the insulin quality after its UAV transportation, since it may become unusable in case when an irreversible aggregation forms due to high temperature or vibrations. For these experiments, a commercial drone (DJI Mavic air) including a box of insulin were attached directly to the body of the UAV. Whenever vibrations affect the UAV frame, they could be sent to the payload, since there was a direct connection between the UAV and its payload. Therefore, by understanding the way in which some adverse factors, such as vibrations, external disturbances, abrupt manoeuvers and other conditions may affect both systems, it might increase the chances to choose an appropriate UAV for specific products transportation, as well as to contribute in the design of its robust attachments [Reference Hii, Courtney and RoyallL27].
This paper investigates a new configuration for a quadrotor type UAV by considering a payload and a flexible attachment system. Dryden continuous gust is also considered during the flight to verify the controller suppression performance and to establish a relationship between both controllers. The main contributions of this paper are: (i) a new dynamic configuration of a quadrotor with a payload using a flexible attachment, (ii) the use of controllers not only to assess the flight performance, as traditionally found in the literature, but also to verify the relative trajectory oscillation influence over the quadrotor dynamics and (iii) the use of Fast Fourier Transform and Performance Indices to evaluate both controllers in different phases of the flight.
This paper is organised in various sections; the Section 2 shows the new dynamic model designed and developed for fragile products transportation, corresponding to a quadrotor with its attached payload model. Two controllers are presented, a Proportional Derivative and a Sliding Mode Controller. Section 3 presents the numerical results obtained by the use of both controllers in mitigating the oscillations occurring between the quadrotor and its load, but also by evaluating the quadrotor performance trajectory under external disturbances. This paper is finalised with concluding remarks presented in Section 4.
2.0 Methodology
The conventional mathematical model of a quadrotor has been described in several Refs. [Reference Fossen28–Reference Shen, Fan and Wang33]. The quadrotor is assumed to be a rigid body, symmetrical around its body-frame origin, with its coordinates axes coinciding with its centre of gravity (CG). The quadrotor is composed of four rotors which are fixed in a cross configuration, and their aerodynamics interactions are neglected. Mathematical modeling has been used to evaluate the effects of vibrations on the payload, which could be a serious challenge to transport safely medical products by the quadrotor.
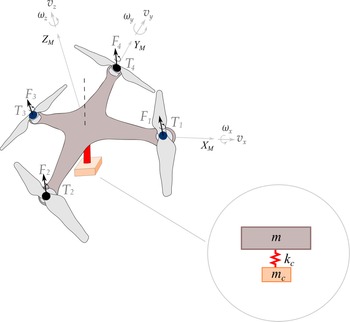
A payload is attached directly to the quadrotor body and due to the proposed configuration, its motion is assumed to take place only in the vertical direction. Both lateral stiffnesses are larger than the vertical stiffness, such that the lateral relative displacements can be neglected. Figure 1 depicts the coupled system, in which the payload is linked to the quadrotor, and any phenomena that quadrotor undergoes is transmitted directly to its payload. Notice that the quadrotor is assumed to be a rigid body, and for this reason its natural frequencies are higher than the frequency associated to the payload connection.
Schematic illustration of a quadrotor and its proposed attachment.

As shown in Fig. 1, the attachment system consists of a stiffness
 $k_c$
oriented in the vertical direction, defined in the body-fixed coordinate system (
 $Z_M$
), in which connects the payload
 $m_c$
to the quadrotor. The equation of motion of the coupled system is presented in Equation (1):
 \begin{equation}\mathbf{M}_{\eta_{c}}(\boldsymbol{\eta}_{c}) \ddot{\boldsymbol{\eta}_{c}}+ \mathbf{C}_{\eta_{c}}(\boldsymbol{\nu,\eta}_{c}) \dot{\boldsymbol{\eta}_{c}} + \mathbf{g}_{\eta_{c}}(\boldsymbol{\eta}_{c})+ \mathbf{K}_{\eta_{c}}(\boldsymbol{\eta}_{c}) \boldsymbol{\eta}_{c} = \boldsymbol{\tau}_{\eta_{c}}(\boldsymbol{\eta}_{c}) + \mathbf{F}_{d}\end{equation}
where
 $\mathbf{M}_{\eta_{c}}(\boldsymbol{\eta}_{c})$
is the inertial matrix,
 $\mathbf{C}_{\eta_{c}}(\boldsymbol{\nu,\eta}_{c})$
represents the Coriolis matrix,
 $\mathbf{g}_{\eta_{c}}(\boldsymbol{\eta}_{c})$
is the gravitational vector,
 $\mathbf{K}_{\eta_{c}}(\boldsymbol{\eta}_{c})$
is the stiffness matrix,
 $\boldsymbol{\tau}_{\eta_{c}}(\boldsymbol{\eta}_{c}) $
denotes the control torque,
 $\mathbf{F}_d$
is the gust vector, and
 $\nu$
is the velocity generalised coordinate in the body-frame. The stiffness matrix
 $\mathbf{K}_{\eta c }(\boldsymbol{\eta}_{c})$
is given by
 $ \mathbf{J}_c \mathbf{M}_{c}^{-1} \mathbf{K}_{c}$
as shown in App. A.0 and
 $\mathbf{K}_{c}$
is expressed as:
 \begin{equation}\mathbf{K}_{c}=\left[\begin{array}{c@{\quad}c@{\quad}c@{\quad}c} \mathbf{0}_{7\times2} & \mathbf{k}_c & \mathbf{0}_{7\times3} & -\mathbf{k}_c\end{array}^{T}\right]\end{equation}
where
 $\mathbf{k}_c= \{ 0 \quad 0 \quad k_c\quad 0 \quad 0 \quad 0 \quad -k_c \}^T$
and
 $\mathbf{0}_{a\times b}$
are zero matrices with a rows and b columns. As already said, the payload moves only in the vertical direction, such that
 $k_x$
and
 $k_y> > >k_z$
, and the x and y coordinates are assumed to be the same with those of
 $x=x_c$
and
 $y=y_c$
(for the quadrotor and its payload, respectively). Therefore, as the lateral displacement can be neglected in the proposed model, the vertical component represents the total significant displacement of the payload. Additionally,
 $\boldsymbol{\eta}_{c}$
is the generalised coordinate’s vector of the quadrotor in the inertial reference frame and is given by:
 \begin{equation}\boldsymbol{\eta}_c=\begin{Bmatrix}x\;\;\;\;\; & y\;\;\;\;\; & z\;\;\;\;\; & \phi\;\;\;\;\; & \theta\;\;\;\;\; & \psi\;\;\;\;\; & z_c\end{Bmatrix}^{T}\end{equation}
where x,y,z and
 $\phi,\theta,\psi$
are the positions and orientation angles of the quadrotor, and
 $z_c$
is the position of the attached mass. The details of the proposed model are found in Appendix A.0, and they emphasise the payload influence on the whole dynamics system.
2.1 Controllers development
The proposed controllers consider four inputs to the dynamic model, such as the vertical altitude z, roll
 $\phi$
, pitch
 $\theta$
and yaw
 $\psi$
angles. The development and comparison of two controllers: Proportional Derivative (PD) and Sliding Mode Control (SMC) is presented in this section. This development aims to achieve not only the UAV trajectory tracking stabilisation, but also to guarantee an attenuation of the relative displacements between the quadrotor and its attached system subjected to external disturbances. These controllers are selected for this study because they are the most used for quadrotor control, as shown in Refs. [Reference Zuniga, Munoz, Marquez, Espinoza and Carillo11, Reference Nascimento and Saska12, Reference Castillo-Zamora, Gomez, Soto and Resendiz34, Reference Derrouaoui, Bouzid and Guiatni35, Reference Lima37]. The comparison between the SMC and the PD controllers has been made to assess the main contributions of this paper, that consists in the new dynamic configuration and vibration suppression over the quadrotor flight phases.
The trajectory tracking technique is designed using two different loops: the “inner” and “outer” loops. The “outer loop” is related to the Position Controller by giving the input
 $U_{1c}$
to the dynamic model, and by providing the set of points (
 $\phi_{des},\theta_{des}$
) for the “inner loop”. The “inner loop” is related to the Attitude Controller, which provides the inputs
 $U_2$
,
 $U_3$
and
 $U_4$
to the dynamic model.
In contrast to conventional quadrotors, the position controller
 $U_{1c}$
requires the combination of the vertical motion equations from the quadrotor with those of the payload output, since the
 $U_{1c}$
must be able to lift the total mass, as shown in App. C.0. As an under actuated system, the compensation for
 $U_{1c}$
is then used for the whole controller, since the inputs and outputs for both loops are directly linked. For instance, the pair (
 $\phi_{des},\theta_{des}$
) depends on the
 $U_{1c}$
to be calculated and at the same time is responsible to generate the other inputs
 $U_2$
and
 $U_3$
. Figure 2 represents the cascade control strategy.
Control strategy for the quadrotor.

The wind model is developed using the Dryden gust methodology applied only in the vertical direction for the quadrotor and its payload, such that the Dryden disturbance is a force defined as
 $\mathbf{F}_{dz}$
. The input control of the dynamic model is calculated using the combination of the inputs
 $U_i$
 $(i=1,2,3,4)$
provided from both loops. Thus, the input control is defined as
 $\boldsymbol{\tau}= \{ 0 \;\; 0 \;\; U_{1c} \;\; U_2 \;\; U_3$
 $ \;\; U_4 \;\; 0 \}^T$
.
2.1.1 Proportional Derivative (PD) control
The Proportional Derivative (PD) control design is described in this sub-section. It is worth mentioning again that the payload is directly attached to the quadrotor frame, and this connection is assumed to link the quadrotor to its payload. Therefore, any disturbance (gust, vibration) affecting the quadrotor may also affect the payload, i.e. the motion of the payload
 $z_c$
is directly related to z. In this sense, as shown in App. C.0, the altitude controller requires a combination of the quadrotor with payload motions in order to accomplish the desired vertical trajectory. The modified control law in the z direction is defined by the total thrust of motors:
 \begin{equation}U_{1c}=\tilde{{m}}(g+r_z)/c \phi c \theta\end{equation}
where
 $c(.)$
is the cosine function, and
 $r_z$
can be written as
 $r_z=k_{pz} (z_{des}-z) + k_{dz} (\dot{z}_{des} - \dot{z})$
. In addition,
 $z_{des}$
and z are the desired and current altitudes,
 $\dot{z}_{des}$
and
 $\dot{z}$
are their time derivatives, and
 $k_{pz}$
and
 $k_{dz}$
are the proportional and derivative gains of the controller, respectively.
For a regular quadrotor,
 $\tilde{{m}}$
is defined only for its mass m (as widely seen in literature [Reference Subudhi and Ezhilarasi36]). However, the new quadrotor can carry out different payload, and the heavier the extra weight added to the quadrotor is, the more its flight altitude is affected. To compensate for the extra weight added to the system,
 $\tilde{{m}}$
is defined by
 $m+m_c$
.
In the inner loop, two phases are required to properly control the quadrotor. Firstly, the total thrust needs to be calculated by use of Equation (4). Secondly, to ensure the motion of the quadrotor in the (x,y) planes, the desired roll and pitch angles (
 $\phi_{des}, \theta_{des}$
) are generated through their expressions, as given in [Reference Lima37]:
 \begin{equation}\phi_{des} = sin^{-1}(s\psi U_x - c\psi U_y)\quad \theta_{des}=sin^{-1}[(U_x-s\psi s\phi)/(c \psi c \phi)],\end{equation}
where the virtual inputs
 $U_x$
and
 $U_y$
are defined as follows:
 \begin{equation}U_x=(r_x \tilde{m})/U_{1c}\quad U_y=(r_y \tilde{m})/U_{1c},\end{equation}
Similar to
 $r_z$
, in the x and y planes,
 $ r_x=k_{px} (x_{des}-x) + k_{dx} (\dot{x}_{des} - \dot{x})$
and
 $ r_y=k_{py} (y_{des}-y) + k_{dy} (\dot{y}_{des} - \dot{y})$
. Moreover, as the inner loop is fully controllable, the torques are applied at roll, pitch and yaw angles
 $(\phi,\theta,\psi)$
. After linearising and applying the necessary simplifications, the rotational equations can be defined as:
 $U_2 = (I_{xx}+\Delta I_{xx}) \ddot{\phi}$
,
 $U_3 =(I_{yy}+\Delta I_{yy}) \ddot{\theta}$
, and
 $U_4 = (I_{zz}+\Delta I_{zz}) \ddot{\psi}$
. Thus, the inputs of the simplified rotational proposed controller are defined as follows:
 \begin{equation}\begin{array}{l}U_2 = k_{p \phi} (\phi_{des}-\phi) + k_{d \phi} (\dot{\phi}_{des}-\dot{\phi}) \\ \\U_3 = k_{p \theta} (\theta_{des}-\theta) + k_{d \theta} (\dot{\theta}_{des}-\dot{\theta}) \\ \\U_4 = k_{p \psi} (\psi_{des}-\psi) + k_{d \psi} (\dot{\psi}_{des}-\dot{\psi}),\end{array}\end{equation}
where
 $k_{pi}$
and
 $k_{di}$
are the proportional and derivative gains defined for the “inner loop”, where (
 $i=\phi,\theta,\psi$
).
2.1.2 Sliding mode control (SMC)
This sub-section presents the design of a Sliding Mode Control (SMC) strategy. The combination between the position and the velocity tracking errors of state variables allows for the development of a second order Sliding Mode Control (SMC). The proposed controller system is divided into two sub-systems: (i) a fully actuated sub-system (
 $\ddot{z}$
and
 $\ddot{\psi}$
) and (ii) an under actuated subsystem (
 $\ddot{x}$
,
 $\ddot{y}$
,
 $\ddot{\phi}$
and
 $\ddot{\theta}$
). The fully actuated controller ensures the convergence of the current variables
 $[z,\psi]$
to the desired ones
 $[z_{des},\psi_{des}]$
. For the vertical motion variable z, a sliding surface equation determines the dynamics of the system by using [Reference Utkin38]:
 \begin{equation}s_z= \lambda_z (z_{des}-z)+(\dot{z}_{des}-\dot{z}),\end{equation}
where
 $\lambda_z$
is a “tuning” parameter associated with the “closed loop bandwidth”. Furthermore, the derivative of
 $s_z$
is calculated with respect to time such as
 $\dot{s}_z= \lambda_z (\dot{z}_{des}-\dot{z})+(\ddot{z}_{des}-\ddot{z})$
.
In fact, the time derivative
 $s_i$
can also be defined by using a discontinuous state function to enforce the proposed controller on the surface, such that
 $\dot{s}_i=-\epsilon_i sat(s_i)-\eta_i s_i$
, where
 $\epsilon_i$
and
 $\eta_i$
are the sliding surface exponential approach coefficients, and sat(.) indicates the saturated function. By combining the time derivative (
 $\dot{s}_z$
), the state function (
 $\dot{s}_i$
) and the equations of motion in the z and
 $z_c$
directions (as seen in [Reference Elhennawy and Habib16]) the corresponding control law input is defined as
 \begin{equation}U_{1c}= \frac{\tilde{{m}}}{c \theta c \phi} (\epsilon_z sat(s_z)+\eta_z s_z + \lambda_z (\dot{e}_z)+\ddot{z}_{des}+g),\end{equation}
where
 $\dot{e}_z$
is the difference between the desired and the calculated state variables (
 $\dot{z}_d$
-
 $\dot{z}$
), and
 $sat(s_i)$
is the saturated function used to alleviate the effect of chattering on the actuators, as shown in [Reference Reinoso, Minchala, Ortiz, Astudillo and Verdugo39]:
 \begin{equation}sat(s_i)=\frac{s_i}{|s_i|+\gamma}\end{equation}
where
 $\gamma$
is the parameter used to define the “transition bandwidth” (which can reduce the chattering effect on the actuators). Likewise to the Proportional Derivative, in the “inner loop”, two phases are required to control the quadrotor. First, the total thrust must be calculated with the Equation (9). Second, to enable the motion of the quadrotor in the (x,y) plane, the desired roll and pitch angles (
 $\phi_{des}, \theta_{des}$
) are generated through two virtual inputs. These inputs are two dependent position states (x, y) for the SMC, and each position state requires virtual inputs to obtain the under-actuated controller parameters. Therefore, the desired angles of roll and pitch for designing the attitude control are obtained with Equation (11) [Reference Vahdanipour and Khodabandeh40]:
 \begin{equation}\phi_{des}= sin^{-1}(u_x s \psi - u_y c\psi)\qquad \theta_{des}= sin^{-1}\left(\frac{u_x c\psi + u_y s\psi}{c \psi} \right)\end{equation}
where
 $u_x$
and
 $u_y$
are defined by
 $u_x=\dfrac{\tilde{m} }{U_{1c}}(\ddot{x}_{des}+\lambda_x \dot{e}_x + \eta_x s_x + \epsilon_x sat(s_x))$
and
 $u_y=\dfrac{\tilde{m}}{U_{1c}}(\ddot{y}_{des}+\lambda_y \dot{e}_y + \eta_y s_y + \epsilon_y sat(s_y))$
, where
 $\lambda_x$
,
 $\lambda_y$
,
 $\eta_x$
,
 $\eta_y$
,
 $\epsilon_x$
and
 $\epsilon_y$
are positive real constants. Similarly,
 $U_2$
,
 $U_3$
and
 $U_4$
are obtained following the same steps as the ones mentioned previously for
 $U_{1c}$
, therefore they are obtained with next Equation (12):
 \begin{equation}\begin{array}{l}U_2= \dfrac{I_{xx}+\Delta I_{xx}}{l}(\ddot{\phi}_{des}+ \lambda_{\phi}\dot{e}_{\phi} + \eta_{\phi} s_{\phi} + \epsilon_{\phi} sat(s_{\phi}))-[(I_{yy}+\Delta I_{yy})-(I_{zz}+\Delta I_{zz})]l \dot{\theta} \dot{\psi} \\ \\U_3= \dfrac{I_{yy}+\Delta I_{yy}}{l}(\ddot{\theta}_{des}+ \lambda_{\theta}\dot{e}_{\theta} + \eta_{\theta} s_{\theta} + \epsilon_{\theta} sat(s_{\theta}))-[(I_{zz}+\Delta I_{zz})-(I_{xx}+\Delta I_{xx})]l \dot{\phi} \dot{\psi} \\ \\U_{4}=(I_{zz}+\Delta I_{zz})(\ddot{{\psi}}_{des} + \lambda_{\psi} (\dot{e}_{\psi}) + \eta_{\psi} s_{\psi} + \epsilon_{\psi} sat(s_{\psi}))-[(I_{xx}+\Delta I_{xx}) \\[5pt] \qquad \;-(I_{yy}+\Delta I_{yy})] \dot{\theta} \dot{\phi}\end{array}\end{equation}
where
 $\lambda_{\phi}$
,
 $\lambda_{\theta}$
,
 $\lambda_{\psi}$
,
 $\epsilon_{\phi}$
,
 $\epsilon_{\theta}$
,
 $\epsilon_{\psi}$
,
 $\eta_{\phi}$
,
 $\eta_{\theta}$
and
 $\eta_{\psi}$
are also positive real constant parameters.
2.2 Performance indices
Performance indices are employed to evaluate both controllers in different phases of flight, as well as their relative oscillations. A system exhibits its best performance when the controller parameters are adjusted to reach the minimum values of the performance indices [Reference Dorf and Bishop41]. The first index is called the “Integral of the Absolute magnitude of the Error” (IAE), which is used in numerical simulations and is defined with the next Equation (13):
 \begin{equation}IAE=\int_{0}^{T}|e_o(t)|dt,\end{equation}
where
 $|e_o(t)|$
is the absolute oscillation error, and is given by the difference between the quadrotor and the load displacements (
 $|z_c-z|$
). T is the final time of each flight phase (since the trajectory is divided into three phases: taking-off, cruise and landing). Another proposed performance index is called the “Integral of Time multiplied by the Absolute Error” (ITAE), that is designed to reduce the errors at the beginning of the signal, as well as to obtain the steady-state error:
 \begin{equation}ITAE=\int_{0}^{T} t|e_o(t)|dt,\end{equation}
where t is the simulation time. Other performance indices can be found in Ref. [Reference Trentin, Cenale, da Silva and Ribeiro42].
2.3 Dryden continuous gust
Turbulence, also called wind gust, is described as a brief change of wind velocity caused by atmospheric pressure and temperature. Therefore, a realistic model is required to evaluate its effects on a UAV [Reference Zhang, Zhou, Zhao, Dai and Zhou43], and the Dryden and Von Kármán are two of the most common models used to study the wind effects on UAVs. The expression of the Dryden Power Spectral Density (PSD) defining the turbulence velocity in the vertical direction is represented by [Reference Beal44, Reference Botez, Boustani, Vayani, Bigras and Wong45]:
 \begin{equation}\varPhi_z(\Omega) =\sigma_z^2 \frac{L_z}{\pi}\frac{1+3(L_z\Omega)^2}{(1+(L_z\Omega)^2)^2}\end{equation}
Fundamentally, a Power Spectral Density (PSD) function is parameterised using the turbulence scale length (
 $L_z$
) and standard deviations (or turbulence intensities), defined as
 $\sigma_z$
. For lower-altitudes than 60m, these parameters are given by
 $L_z=h$
and
 $ \sigma_z=0.1 w_{ws}$
, where
 $w_{ws}$
denotes the mean wind speed and h is the flying altitude of the quadrotor. Then, in order to generate the wind gust velocity, a white noise signal is filtered through a shaping function, as shown on Fig. 3.
Process for generating Dryden wind velocity model.

The relationship between the Power Spectral Density (PSD) and the transfer function is given by [Reference Lv, Yang and Chai46]:
 \begin{equation}\varPhi_i(\Omega)=|G(j\omega)^2|=G^*(j\omega) G(j\omega),\end{equation}
where
 $*$
indicates the complex conjugate of the transfer function. The transfer function of the shaping filter can be obtained by decomposing the PSD, as seen in Equation (16), and in [Reference Aboudonia, Rashad and El-Badawy47]:
 \begin{equation}G_z(s)=\frac{v_{z_d(s)}}{\eta_z(s)}=\sigma_z \sqrt{\frac{L_z}{\pi V}} \dfrac{1+\dfrac{\sqrt{3}L_z}{V}s}{\left(1+\dfrac{L_z}{V}s\right)^2},\end{equation}
where
 $\eta_z$
denotes the white Gaussian noise in the frequency domain. V is the wind velocity and s is the Laplace variable (which can be replaced by
 $j\omega$
in order to solve the Equation (17)). Therefore, after finding the wind velocity
 $v_{z_d}$
and converting it into time, the wind gust velocity in the inertial reference can be represented as
 $ v_{wz}=\bar{v}_{wz}+v_{z_d}$
, where
 $\bar{v}_{wz}$
denotes the mean wind velocity in the z direction. Finally, the Dryden disturbance
 $F_{dz}$
, that acts on the UAV during a flight, is defined as:
 \begin{equation}F_{dz}=-\frac{1}{2} \rho C_{dz}A_z(\dot{z}-v_{wz})^2sgn(\dot{z}-v_{wz}),\end{equation}
where
 $\rho$
is the air density,
 $C_{dz}$
is the drag coefficient,
 $sgn(.)$
denotes the sign function,
 $A_{z}$
is the area projected by the UAV and
 $\dot{z}$
is the velocity along the z axis, respectively. The same steps are required to design the Dryden disturbance force that acts on the payload, switching only the velocity of the payload
 $\dot{z}_c$
instead of
 $\dot{z}$
. The forces and Dryden components along the (x, y) axes are detailed in Appendix B.0.
3.0 Results and discussion
The dynamic parameters of the quadrotor with an attached payload are presented in Table 1 in terms of their physical and geometrical properties. The initial yaw angle is considered as
 $\psi = 0.5$
rad, while the other desired initial states (
 $x,y,z,\phi,\theta,\psi$
) are defined as equal to zero. The controller gains of both controllers (PD and SMC) are listed in Table 2. The PD gains were initially selected according to their values previously employed in Ref. [Reference Lima37], and the new SMC gains were chosen based on the pole placement method. The defining step of the controller gains is very important to obtain a successful controller design. These following results are obtained by integrating Equation (1) in time domain, using Matlab software. The Fourth Order Runge-Kutta algorithm was employed with time step
 $2\times 10^{-4}$
s.
Parameters of the quadrotor model

Controller gains computed for the PD and SMC methodologies

The flight trajectory used to evaluate the relative trajectory oscillation is shown in Fig. 4, and this trajectory is built for three phases: transient
 $P_1$
, cruise
 $P_2$
and landing
 $P_3$
. The first phase occurs between the beginning of a flight and the time when the quadrotor reaches the desired altitude (in the absence of transient effects). The second phase represents the cruise path, where the quadrotor flies horizontally at the same altitude, while the third phase covers the descent until the quadrotor lands on the groundFootnote 1.
It is worth mentioning that the controller has no direct actuation on the payload, allowing the payload to move freely in the vertical direction. On the other hand, the controller acts directly on the quadrotor motion, by orientating its flight on a pre-defined trajectory and suppressing residual oscillations. Therefore, due to the direct impact of the controller, the payload displacements are larger than the quadrotor, and influenced by the attachment stiffness
 $k_c$
.
Trajectory of the quadrotor in the z direction, showing the desired trajectory (solid red line), the quadrotor path (solid blue line) and the payload displacement (dashed black line).

The relative trajectory oscillation is defined by the difference between the vertical displacement of the payload and the vertical displacement of the quadrotor, therefore it is denoted by
 $z-z_c$
. In the beginning of the flight, when a transient effect occurs, the oscillations can be attenuated differently by using both controllers (SMC and PD). Figure 5 shows the oscillation of each controller during the first phase
 $P_1$
. The relative trajectory oscillation between the quadrotor and its payload can then be calculated with a Fast Fourier Transform (FFT), denoted by
 $|Z|$
.
Relative trajectory oscillation in the transient phase, for the PD (dashed blue line), and the SMC (solid red line).

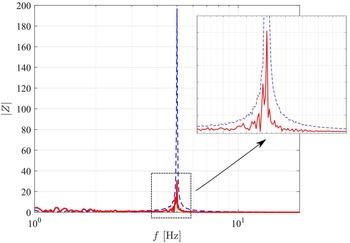
As seen in Fig. 5, the SMC presents better performance compared to that of the PD, as the transient phase has less effect the SMC case. Figure 6 shows the frequency spectrum of the oscillation, for which the SMC amplitude peak is approximately 35% of the PD. Notice that the payload displacement
 $z_c$
is different when comparing the SMC and the PD controllers performance. The SMC laws guarantee a better adherence to the quadrotor trajectory, and therefore higher oscillation suppression as results in comparison to the PD performance results.
Frequency spectrum of the relative trajectory oscillation at
 $P_1$
, for the PD (dashed blue line), and the SMC (solid red line).

Both controllers are used to evaluate the performance of a quadrotor when is subjected to an external disturbance during the second phase
 $P_2$
. The proposed controllers are designed to reduce the relative trajectory oscillation produced by the coupling of a quadrotor with its attached mass.
When a UAV is subjected to the external disturbances, its trajectory is suddenly changed, and depending on the coupling parameters adopted, the relative displacement can be either enhanced or reduced. Thereby, the controllers must not only stabilise the tracking, but they should also guarantee an attenuation of the oscillations. Figure 7 shows the effect of an external disturbance during the second (cruise) phase
 $P_2$
for both controllers. The difference in the vertical direction of the quadrotor and its payload is due to the physical distance of the proposed attachment. The payload is translated vertically below from the CoG of the quadrotor, in order to allow the payload to move freely in this respective direction.
Trajectory affected by a vertical Dryden wind disturbance using: a) the PD, and b) the SMC, showing the desired trajectory (solid red line), the quadrotor (solid blue line) and the payload displacement (dashed black line).

In the absence of external disturbance, the signal has its main impact only for a specific frequency, while in the presence of external disturbance, the response is affected during a range of frequencies, as seen in Fig. 8. Moreover, the peak is smaller and the band is narrower than when a disturbance impacts on the trajectory. It can be seen in Fig. 7 that the SMC reduces the oscillation more than the PD. Especially at the time when a disturbance is applied to the system [25–40]s, not only the peak amplitude calculated with the SMC is smaller than that calculated with the PD, but the time required for the system to return to a minimum oscillation is also reduced.
Frequency spectrum of the relative trajectory oscillation during the cruise phase
 $P_2$
, that shows the presence of disturbance (solid red line), and the absence of disturbance (solid black line).

The SMC is able to reduce the gust effect more than the PD mainly because its formulation allows one to consider boundary uncertainties. Note that a discontinuous state function (
 $\dot{s}_i=-\epsilon_i sat(s_i)-\eta_i s_i$
) was used to enforce the proposed controller on the surface, which improves the SMC with respect to the PD in terms of noise reduction and trajectory adherence. This approach allowed the quadrotor to follow smoothly its desired path, and therefore to ensure lower effects on its payload performance. Figure 8 illustrates the presence and absence of an external disturbance. Figure 9 shows the relative trajectory oscillation between the quadrotor and the payload during the second phase
 $P_2$
.
Relative trajectory oscillation in the second (cruise) phase, for the PD (dashed blue line), the SMC (solid red line), and and the boundaries of the external disturbance (solid black lines).

Likewise, by applying the Fast Fourier Transform (FFT) to the signal (
 $z_c-z$
), it can be shown that the peak calculated with the SMC is around eight times smaller than that found by using the PD. Figure 10 shows the frequency spectrum when an external disturbance is applied on the quadrotor and its attached system during the cruise phase.
Frequency spectrum of the relative trajectory oscillation during the second phase
 $P_2$
, obtained with the PD (dashed blue line), and the SMC (solid red line).

In the last phase of landing (
 $P_3$
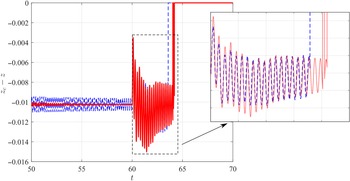
), the controllers can attenuate the relative trajectory oscillation, however in contrast to the other two phases, the SMC presents a slight increase of oscillation amplitudes compared to the PD when the quadrotor begins the landing process [60–64]s. On the other hand, when the analysis covers the whole
 $P_3$
phase [50–70]s, the SMC still gives a better performance than the PD. Figure 11 shows the relative trajectory oscillations when a quadrotor is in the landing process, while Fig. 12 presents the frequency spectrum of the signal.
Relative trajectory oscillation in the landing phase, for the PD (dashed blue line), and the SMC (solid red line).

Frequency spectrum of the relative trajectory oscillation during phase
 $P_3$
, for the PD (dashed blue line), and the SMC (solid red line).

To compare the performance indices of the two controllers, a percentage parameter can be defined as
 $P_{pi} = 100 \frac{P_{SMC}}{P_{PD}}$
, where
 $P_{pi}$
is the percentage of the performance index (IAE and ITAE), defined in Section 2.2),
 $P_{SMC}$
is the index calculated at each phase for the Sliding Mode Control and
 $P_{PD}$
is the index calculated by the Proportional Derivative. Table 3 shows the performance indices calculated for each flight phase.
Based on the Table 3 all performance indices percentages show an advantage for using the SMC rather than the PD (since all percentage of performance indices are lower than 100%, thus they indicate a higher values of
 $P_{PD}$
than the
 $P_{SMC}$
values). For instance, by considering the
 $P_{IAE}$
at the transient phase, the SMC requires only 35.40% of the energy spent by the PD. In addition, when an external disturbance is added to the dynamic system during the cruise phase
 $P_2$
, a more significant reduction can be observed, since the
 $P_{SMC}$
represents only 11.38% of the energy required by the
 $P_{PD}$
. Thereby, when analysing the results obtained for the third phase, the SMC shows a better performance than the PD (with smaller oscillation amplitude, around 49% less interference with the quadrotor and on-board loads dynamics).
Therefore, the SMC controller ensures a more robust stabilisation of the relative trajectory oscillation than PD. Following several tests, as described in [Reference Scalea, Retaino, Blankenship, Bartlett and Wereley48], it was found that the take-off and landing phases have a significant influence on the flight, reinforcing the importance to study them individually. Thereby the highest oscillation amplitudes are depicted during the
 $P_1$
and
 $P_3$
phases, as shown in Figs 5 and 11, respectively. Figures 13 and 14 show the relationship between the natural frequency and its highest peak reached by the relative displacement during the first and third phases, respectively.
The
 $A_m$
term refers to the maximum amplitude reached by the quadrotor. Without changing its controller performance (by switching the gains, propellers velocities or other parameters), different structural parameters, such as stiffness can be chosen with the aim to obtain a lower maximum amplitude. As shown in Fig. 13, the peak of oscillation can thus be significantly reduced depending on the analysed range of frequencies. In addition as shown previously, the SMC gives a better reduction of relative displacements than the PD during the first (transient) phase, which can clearly be observed by the marker position (
 ${\boldsymbol{*}},{\boldsymbol{+}}$
) on Fig. 14. Similarly, in the third phase, the maximum amplitude decreases with the increase of the natural frequency (
 $\omega_r$
).
Performance indices [%] for the controllers during three trajectory phases

Maximum amplitude reached by the quadrotor during the take-off phase, for the PD (
 $\boldsymbol{-*}$
) and the SMC (- -
 $\boldsymbol{+}$
).

Maximum amplitude reached by the quadrotor during the landing phase, for the PD (
 $\boldsymbol{-*}$
) and the SMC (- -
 $\boldsymbol{+}$
).

4.0 Final remarks
This paper investigates the dynamics of a quadrotor with a vibrating payload. The attachment system is composed by a stiffness and an attached mass, which ensures the payload to oscillate only vertically. Two controllers were used to investigate the relative trajectory oscillation between the quadrotor and the payload, as well as the quadrotor performance under external winds disturbances. The proposed strategy allows to compare both controllers (SMC and PD) results in different flight phases and to understand the impact of external disturbances, and manoeuvers on the quadrotor flight. The Sliding Mode Controller has a fast response to fit to the trajectory, especially to compare its performance to the Proportional Derivative (PD). The SMC’s faster convergence to the desired point in space is related to its robust control law even under uncertainty parameters (such as external disturbance), which guides and fits strongly the quadrotor trajectory on its proposed path.
In addition, to establish a performance metrics, the Fast Fourier Transform “FFT” of the relative trajectory oscillation, between the quadrotor and its payload, was evaluated to verify how the frequency range impacted the system. It was shown that in the presence of external disturbances, the quadrotor was affected by a larger frequency spectrum and had a significant effect on its energy (represented by its peak) in comparison to its behaviour in the absence of external disturbances. When analysing the effects of external disturbances (during the second phase
 $P_2$
), the SMC clearly gives a better performance than the PD. The performance indices were also calculated to measure the trajectory tracking of the quadrotor and the payload. The performance index is about ten times smaller (for the SMC than for the PD) indicating the lower relative trajectory oscillations. The use of a more robust controller can thus improve not only the trajectory tracking but can also reduce the vibration sent to the payload.
The recommendations for future works include the analysis of the controller performance, by considering an external disturbance in different phases of a flight, such as take-off, landing or sudden change of altitude. The understanding of the undesired vibration influence on the whole flight is also an interesting topic for further investigations in this field.
Acknowledgments
The first author would like to thanks to the Brazilian Coordination for the Improvement of Higher Education Personnel (CAPES) - Finance Code 001 for his scholarship. The second author thanks to the NSERC for the Canada Research Chair Holder Tier 1 in Aircraft Modeling and Simulation Technologies Program. The third author gives special thanks to the National Council for Scientific and Technological Development (CNPq) Grant no. 429963/2016-5 for its financial support.
Declaration of conflicting interests
The authors declared no potential conflicts of interest with respect to the research, authorship, and/or publication of this paper.
A.0 Dynamic equations
The general motion of the quadrotor was already described in Equation (1), in which the main matrices were defined as follows [Reference Kim, Kang and Park29]:
 \begin{equation}\begin{array}{l}\mathbf{M}_{\eta c}(\boldsymbol{\eta}_{c}) = \mathbf{I}_{7\times7} \\[5pt] \mathbf{C}_{\eta c}(\boldsymbol{\nu,\eta}_{c}) =\mathbf{J}_c \mathbf{M}_{c}^{-1}\mathbf{C}_c\mathbf{J}_c^{-1}-\dot{\mathbf{J}}_c \mathbf{J}_c^{-1} \\[5pt] \mathbf{g}_{\eta c }(\boldsymbol{\eta}_{c}) = \mathbf{J}_c \mathbf{M}_{c}^{-1}\mathbf{g}_{0 c} \\[5pt] \mathbf{K}_{\eta c }(\boldsymbol{\eta}_{c}) = \mathbf{J}_c \mathbf{M}_{c}^{-1} \mathbf{K}_{c} \\[5pt] \boldsymbol{\tau}_{\eta c}(\boldsymbol{\eta}_{c}) = \mathbf{J}_c \mathbf{M}_{c}^{-1} \boldsymbol{\tau}\end{array},\end{equation}
where
 $\dot{\mathbf{J}}_c$
is the derivative of the transformation matrix with respect to time. The main matrices of Equation (19) are shown below:
 \begin{equation}\mathbf{M}_{c}=diag(m+m_{c},m+m_{c},m,(I_{xx}+I_{xx}^{c}),(I_{yy}+I_{yy}^{c}),(I_{zz}+I_{zz}^{c}),m_{c}),\end{equation}
where
 $\mathbf{M}_{c}$
is the inertial matrix, and the Coriolis matrix
 $\mathbf{C}_c$
can be expressed as:
 \begin{equation}\mathbf{C}_c=\left[\begin{array}{c@{\quad}c@{\quad}c@{\quad}c@{\quad}c@{\quad}c@{\quad}c} 0 & -(m+m_{c}) \omega_z & m \omega_y & 0 & 0 & 0 & m_{c} \omega_{y}\\[5pt] (m+m_{c}) \omega_z & 0 & -m \omega_x & 0 & 0 & 0 & -m_{c} \omega_{x}\\[5pt] -m \omega_y & m \omega_x & 0 & 0 & 0 & 0 & 0\\[5pt] 0 & 0 & 0 & 0 & 0 & I_{1} \omega _y & 0\\[5pt] 0 & 0 & 0 & I_{2}\omega_z & 0 & 0 & 0\\[5pt] 0 & 0 & 0 & 0 & I_{3} \omega_{x} & 0 & 0\\[5pt] -m_{c}\omega_{y} & m_{c} \omega_{x} & 0 & 0 & 0 & 0 & 0\end{array}\right],\end{equation}
where
 $I_1,I_2$
and
 $I_3$
are the moments of inertia along the x,y,z axes, and were defined as
 $ I_{1} = (I_{zz}+I_{zz}^{c})-(I_{yy}+I_{yy}^{c})$
,
 $I_{2} = (I_{xx}+I_{xx}^{c})-(I_{zz}+I_{zz}^{c})$
and
 $I_{3} = (I_{yy}+I_{yy}^{c})-(I_{xx}+I_{xx}^{c})$
, respectively, where
 $I_{ii}$
is related to the quadrotor and
 $I_{ii}^c$
refers to the coupled system moments of inertia (
 $ii=x,y,z$
). In addition, the gravitational vector is defined as
 $\mathbf{g}_{0 c} = \{ -mg s\theta \;\; mg c\theta s\phi \;\; mg c\theta c\phi \;\; 0 \;\; 0 \;\; 0 \;\; m_c g c\theta c\phi \}^{T}$
.
A new transformation matrix
 $\mathbf{J}_c$
is considered by using the relationship
 $\boldsymbol{\eta}_c= \mathbf{J}_c \boldsymbol{\nu}_c$
, where
 $\mathbf{J}_c$
is defined:
 \begin{equation}\mathbf{J}_c=\left[\begin{array}{c@{\quad}c}\mathbf{J}(\boldsymbol{\eta})\quad & \mathbf{0}_{6 \times 1} \\[5pt] \mathbf{j}_{n}\quad & c\theta c\phi\end{array}\right],\end{equation}
and
 $\mathbf{J}(\boldsymbol{\eta})$
is defined as:
 \begin{equation}\mathbf{J}(\boldsymbol{\eta}) =\left[\begin{array}{c@{\quad}c@{\quad}c@{\quad}c@{\quad}c@{\quad}c}c\psi c\theta & s\phi s\theta c\psi-c\phi s\psi & c\phi s\theta c\psi + s\psi s\phi & 0 & 0 & 0 \\[5pt] s\psi c\theta & s\phi s\theta s\psi + c\phi c\psi & c\phi s\theta s\psi - s\phi c\psi & 0 & 0 & 0 \\[5pt] -s\theta & s\phi c\theta & c\phi c\theta & 0 & 0 & 0 \\[5pt] 0 & 0 & 0 & 1 & s \phi t \theta & c\phi t \theta \\[5pt] 0 & 0 & 0 & 0 & c \phi & -s \phi \\[5pt] 0 & 0 & 0 & 0 & s\phi / c \theta & c\phi / c\theta\end{array}\right],\end{equation}
where
 $\mathbf{j}_{n}= \{ -s\theta \;\;\;\;\; c\theta s\phi \;\;\;\;\; 0 \;\;\;\;\; 0 \;\;\;\;\; 0 \;\;\;\;\; 0 \}$
. For numerical simulations, the second order differential equation Equation (1) can be represented in the state space form as follows:
 \begin{equation}\dot{\boldsymbol{x}}_{s}(t) = \mathbf{A}_{c} \boldsymbol{x}_{s}(t) + \mathbf{B} \mathbf{u}(t) + \mathbf{X}_{gc},\end{equation}
where
 $\boldsymbol{x}_s= \begin{Bmatrix} \dot{\boldsymbol{\eta}}_{c}\;\;\; & \boldsymbol{\eta}_{c} \end{Bmatrix}^T$
is the state vector,
 $\mathbf{u}(t) = \begin{Bmatrix} \boldsymbol{\tau}_{\eta c}\;\;\;\; & \mathbf{0}_{7\times1} \end{Bmatrix}^{T}$
is the input vector,
 $\mathbf{X}_{\eta c} = \begin{Bmatrix} -\mathbf{M}_{\eta c}^{-1} \mathbf{g}_{\eta c}\;\;\;\; & \mathbf{0}_{7\times1}\end{Bmatrix}^T$
is the state vector of gravity, and the dynamic and input matrices are defined as:
 \begin{equation}\mathbf{A}_{c}=\begin{bmatrix}-\mathbf{M}_{\eta c}^{-1}\mathbf{C}_{\eta c}\;\;\;\;\; & -\mathbf{M}_{\eta c}^{-1} \boldsymbol{K}_{\eta c} \\[5pt] \mathbf{I}_{7\times7}\;\;\;\;\; & \mathbf{0}_{7\times7}\end{bmatrix}\quad \mathbf{B}=\begin{bmatrix}\mathbf{M}_{\eta c}^{-1} \\[5pt] \mathbf{0}_{7\times7}\end{bmatrix}.\end{equation}
For the proposed quadrotor modeling, its equations of the motion carrying a payload are used. In order to simplify the mathematical model for the numerical implementation of the controller, the UAV is considered at its hovering condition. At that specific position,
 $\omega_x \approx \dot{\phi}$
,
 $\omega_y \approx\dot{\theta}$
,
 $\omega_z \approx \dot{\psi}$
, yielding the next equations:
 \begin{equation}\begin{array}{l}(m+m_c) \ddot{x} = (c\phi s \theta c \psi + s \psi s \phi) U_1\\[5pt] (m+m_c) \ddot{y} = (c \phi s \theta s \psi - s \phi c \psi) U_1\\[5pt] m \ddot{z} = -mg + (c \phi c \theta) U_1\\[5pt] (I_{xx}+\Delta I_{xx}) \ddot{\phi} = ((I_{yy}+\Delta I_{yy})-(I_{zz}+\Delta I_{zz})) \dot{\theta} \dot{\psi} + U_2\\[5pt] (I_{yy}+\Delta I_{yy}) \ddot{\theta} = ((I_{zz}+ \Delta I_{zz})-(I_{xx}+\Delta I_{xx})) \dot{\psi} \dot{\phi} + U_3\\[5pt] (I_{zz}+\Delta I_{zz} )\ddot{\psi} = ((I_{xx}+\Delta I_{xx})-(I_{yy}+\Delta I_{yy})) \dot{\phi} \dot{\theta} + U_4 \\[5pt] m_c \ddot{z}_c = - m_c g\end{array},\end{equation}
where m,
 $m_c$
,
 $I_{xx}$
,
 $I_{yy}$
,
 $I_{zz}$
are the parameters of the controller for the quadrotor with the payload, and
 $\Delta I_{xx}$
,
 $\Delta I_{yy}$
and
 $\Delta I_{zz}$
are parameters related to the uncertainties dues to the payload dynamics added to the quadrotor dynamics. The equations of motion can also be rewritten as
 $\ddot{k}=f_{k}+g_{k} U_j + \Delta f_{k}$
, (such that
 $k=x,y,z,\phi,\theta,\psi,z_c$
and
 $j=1,2,3,4$
). For instance, the second-order derivative of roll
 $\ddot{\phi}$
is expressed with next formulation
 $\ddot{\phi}=[(\dot{\theta} \dot{\psi}(I_{yy}-I_{zz}))/I_{xx}]+[1/I_{xx}]U_2+[-(\dot{\theta} \dot{\psi}(I_{yy}-I_{zz})+U_2)\Delta I_{xx}/[I_{xx}(I_{xx}+\Delta I_{xx})]+\dot{\theta}\dot{\psi}(\Delta I_{yy}-\Delta I_{zz})(I_{xx}+\Delta I_{xx})]$
.
B.0 Dryden gust modeling
Section 2.3 shows the Dryden gust turbulence equations in z direction shows the Dryden gust turbulence equations in the z direction. The Power Spectral Densities (PSD) of the turbulence velocities in the x and y directions are expressed as:
 \begin{equation}\begin{array}{l}\varPhi_x(\Omega)=\sigma_x^2 \dfrac{2 L_x}{\pi}\dfrac{1}{1+(L_x \Omega)^2},\end{array}\end{equation}
 \begin{equation}\begin{array}{l}\varPhi_y(\Omega) =\sigma_y^2 \dfrac{L_y}{\pi}\dfrac{1+3(L_y\Omega)^2}{(1+(L_y\Omega)^2)^2},\end{array}\end{equation}
where the turbulence scale length and intensity in the x and y directions can be defined as shown below:
 \begin{equation}L_x=\frac{h}{(0.177+0.000823h)^{1.2}}\quad \sigma_x=\frac{\sigma_z}{(0.177+0.000823h)^{0.4}},\end{equation}
where
 $L_y=L_x$
and
 $\sigma_y=\sigma_x$
. The transfer functions of shaping filters on their directions are expressed as:
 \begin{equation}\begin{array}{l}G_x(s)=\dfrac{v_{x_d(s)}}{\eta_x(s)}=\sigma_x \sqrt{\dfrac{2L_x}{\pi V}} \dfrac{1}{1+\dfrac{L_x}{V}s}, \\ \\G_y(s)=\dfrac{v_{y_d(s)}}{\eta_y(s)}=\sigma_y \sqrt{\dfrac{L_y}{\pi V}} \dfrac{1+\frac{\sqrt{3}L_y}{V}s}{\left(1+\dfrac{L_y}{V}s\right)^2}.\end{array}\end{equation}
The wind velocities in the inertial reference frame can be represented using two equations
 $v_{wx}=\bar{v}_{wx}+v_{x_d} $
and
 $v_{wy}=\bar{v}_{wy}+v_{y_d}$
. Moreover, the proposed wind modeling is used in numerical simulations to obtain the external disturbances impact on the quadrotor motion. Thus, the wind force generated by use of Dryden equations can be shown on Fig. 15 during an interval of time between 25 and 40s.
Wind disturbance force generated by the Dryden gust oriented in the z direction.

C.0 Adapted controller
The “total thrust” is the force required to lift the quadrotor and its payload. The quadrotor is functioning only in its vertical direction z (the full equation of motion is used for the control law design), while for the proposed model, it is necessary to combine the vertical equations of motion for both systems, including
 $\ddot{z}$
and
 $\ddot{z}_c$
accelerations, as follows:
 \begin{equation}m\ddot{z}+mg+ m_c \ddot{z}_c+m_c g= (c\phi c\theta) U_1,\end{equation}
where
 $\ddot{z}_c=\ddot{z}+\delta$
, such that the acceleration difference is
 $\delta=\ddot{z}_c-\ddot{z}$
. In order to design the control law in the z direction, it is assumed that
 $\delta=0$
(since the control is needed for guiding the quadrotor with its payload at the reference altitude z). Therefore, the new controller equation for the vertical direction is defined as
 $(m+m_c)(\ddot{z}+g)=(c\phi c\theta) U_1$
, in which for convenience
 $m+m_c$
is replaced by
 $\tilde{m}$
. The total thrust of motors using the Sliding Mode Control (SMC) is represented by:
 \begin{equation}U_{1c}= \frac{\tilde{{m}}}{c \theta c \phi} (\epsilon_z sat(s_z)+\eta_z s_z + \lambda_z (\dot{e}_z)+\ddot{z}_{des}+g).\end{equation}
Overall, the conventional control does not take into account the effect of the attached mass, because of the fact that the only mass that needs to be lifted is that of the quadrotor itself. Figure 16 shows the impact of the extra mass attached to the quadrotor on its tracking trajectory using the conventional input control
 $U_{1c}$
. The load masses range from 1% to 20% of the quadrotor mass.
Trajectory influenced by the value of the attached mass
 $m_c$
, where the desired trajectory (solid red line
 $\boldsymbol{-}$
),
 $m_c=0.022$
(solid blue line
 $\boldsymbol{-}$
),
 $m_c=0.22$
(dashed black line
 $\boldsymbol{- -}$
), and
 $m_c=0.44$
(dash-dotted yellow line
 $\boldsymbol{- .}$
).

As seen on Fig. 16, the value of the load affects directly the altitude reached by the quadrotor, when
 $\tilde{m}=m$
. Increasing the gain value of the controller or the propeller velocity are two of the possible solutions adopted to compensate the loss in altitude. Thereby, besides spending more energy to fit the proposed trajectory, the vibration level might be increased (since the propellers velocities are increased), decreasing the quadrotor performance. A compensation in the controller is proposed to maintain the quadrotor stability and the desired altitude, defined as
 $\tilde{m}=m+m_c$
. Therefore, by using this procedure, the quadrotor keeps the desired altitude regardless of the extra mass added to the system.