Implication
Diet composition affects gaseous emissions from a pig slurry. The incorporation of fibre-rich co-products into fattening pig diets results in a shift of N excretion from urine to faeces and a decrease in slurry pH, resulting in a reduction in NH3 emission. Conversely, the amount of faeces increases in pigs fed a high-fibre diet resulting in a higher potential of methane production per pig produced.
Introduction
Pig production in Europe is concentrated in specific areas, which have an economic advantage but also cause environmental damage dealing with the local surplus of slurry. Slurry from livestock farms is the principal source of ammonia (NH3) emission (European Centre for Ecotoxicology and Toxicology of Chemicals (ECETOC), 1994) and it contributes to methane (CH4) emissions due to the anaerobic digestion of organic matter (OM) during storage (Hashimoto et al., Reference Hashimoto, Chen and Varel1981; Husted, Reference Husted1994; Steed and Hashimoto, Reference Steed and Hashimoto1994). NH3 emissions contribute to the formation of acid rains, and subsequently to soil acidification, and the formation of small particles in the air. In addition, these emissions can lead to the pollution of subground and surface water inducing eutrophication of aquatic ecosytems. In the case of CH4 emissions, these contribute to global warming (Steed and Hashimoto, Reference Steed and Hashimoto1994). Many studies have attempted to reduce such gaseous emissions through diet modifications (crude protein (CP) and/or fibre content). Reducing the CP content, associated with a supplement in amino acids, or the addition of fibres to the diet, achieves a reduced N excretion and subsequent ammonia emission (Mroz et al., Reference Mroz, Jongbloed, Beers, Kemme, de Jong, van Berkum and van der Lee1993; Canh et al., Reference Canh, Verstegen, Aarnink and Schrama1997 and Reference Canh, Sutton, Aarnink, Verstegen, Schrama and Bakker1998; Portejoie et al., Reference Portejoie, Dourmad, Martinez and Lebreton2004; Aarnink and Verstegen, Reference Aarnink and Verstegen2007). The modification of the diets could also influence the production of methane from the slurry, but very few studies have been carried out on this subject. Zeeman (Reference Zeeman1991) and Velthof et al. (Reference Velthof, Nelemans, Oenema and Kuikman2005) have shown that a decrease in the CP content of the diet (from 18% to 14%, Velthof et al., Reference Velthof, Nelemans, Oenema and Kuikman2005) reduced the production of methane (from 6.1 to 4.8 g C/kg of manure), while the increase in fibre content (from 129 to 245 g/kg, Velthof et al., Reference Velthof, Nelemans, Oenema and Kuikman2005) increased it (from 4.4 to 5.8 g C/kg of manure).
The recent peak in the price of cereals has highlighted the competition between animal feed and human food demands. In this context, other raw materials are considered as an alternative to cereals in animal diets. Among the reasons leading to this competition (particularly in the United States and Europe), the government policy to incorporate biofuel (up to 5.75% in Europe by 2010, European Directive 2003/30/CE) plays a major role. Such policies lead to the development of a biofuel processing industry that produces fibre-rich co-products, such as wheat distillers’ dried grains with solubles (DDGS) or sugar beet pulp (SBP) in the case of ethanol production, and oilseed meal in the case of biodiesel production. The recycling of such co-products in animal feed represents an economical and maybe an ecologically sound alternative. There is a wide variation in the quality of these co-products depending on the raw material and the technology used to treat the biomass. For economic reasons, some farmers process their own biodiesel from rapeseed, leading to a high-fat rapeseed meal (up to 15% crude fat compared to about 2% crude fat for an industrial process). Such co-products have been mostly used in cow diets and their use is increasing in pig diets. Consequently, the influence of European biofuel processing co-products incorporated into pig diets on pig production and on their subsequent manure ‘environmental’ impacts (methane and nitrogen emissions) remains to be addressed.
In this context, the aim of this study was to investigate the effects of different biofuel co-products (DDGS, SBP and high fat level rapeseed meal) in pig diet on (i) the digestibility of nutrients and energy, (ii) the excretory patterns of N and C and (iii) ammonia and methane emission.
Material and methods
Animals and experimental design
Twenty Piétrain × (Landrace × Large White) castrated male pigs, with an average initial body weight (BW) of 50 (±3) kg, were housed individually in metabolic cages in an environment-controlled room (24 ± 1°C). Cage operation controlled the amount of feed and water consumed on a daily basis. Only male pigs were chosen in order to enable the separate collection of urine and faeces. The pigs were assigned to five dietary treatments according to a complete randomised block design (based on initial age and BW). The 23-day experimental period consisted of a 13-day adaptation period to allow the pigs to become accustomed to the cage and the diet and a 10-day period during which urine and faeces were collected.
Diets and feeding
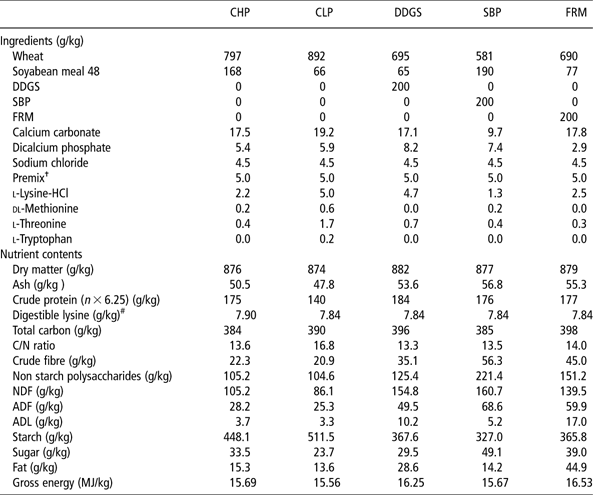
Five experimental diets mainly based on wheat and soyabean meal were formulated: two control diets, a control high-protein (CHP) diet with 17.5% of CP and a control low-protein (CLP) diet with 14.0% of CP, and three experimental diets with 20% of (i) DDGS, (ii) SBP or (iii) fatty rapeseed meal (FRM). The composition and chemical contents of diets are given in Table 1. The feeding level was increased gradually during the adaptation period from 1.4 to 2 kg/day according to the appetite of the animals and from 2 to 2.2 kg/day during the collection period. The pigs received their diet in mash form (2 l water/kg feed) in two equal meals (given at 0800 and 1630 h). Five litres of additional water were also provided each day. Feed refusals and spillage were collected daily and analysed for dry matter (DM) content. For each diet, a representative sample of feed was collected during the experimental period, measured for its DM content and subsequently used for chemical analyses.
Ingredients and nutrient contents of the experimental diets
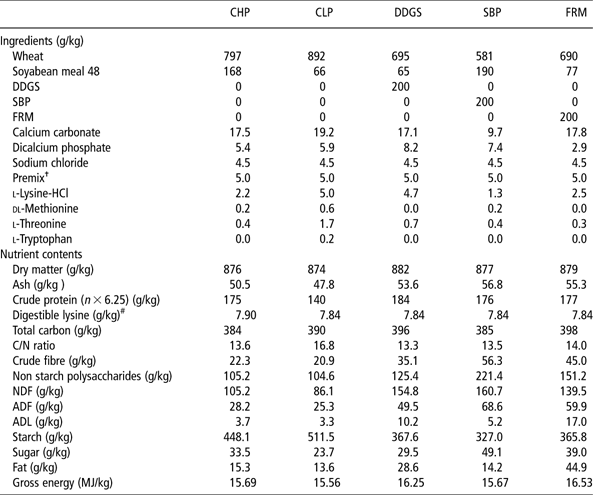
CHP = control high protein; CLP = control low protein; DDGS = dry distiller’s grain with solubles; SBP = sugar beet pulp; FRM = fatty rapeseed meal.
†Trace elements and vitamins premix.
Calculated according to INRA-AFZ (2004).
Pig management
Urine was collected daily from each pig and weighed. During the digestibility trial (10 days), a 1% aliquot of urine was daily sampled, acidified (30 ml of 3.6 N H2SO4/l of urine), aggregated for each pig and stored at 4°C. The remaining fresh urine was then transferred to a 200-l container to be gathered per dietary treatment and stored in a chamber at 10°C. At the end of the collection period, acidified urine and fresh urine were homogenised and sampled for chemical analyses. Faeces were also collected daily, weighed, pooled for each pig and stored at 4°C. At the end of the collection period, faeces were mixed and homogenised for each pig and sub-sampled for DM analysis and freeze dried for chemical analyses. A part of the fresh faeces was then mixed per dietary treatment and sub-sampled. Parts of the urine and faeces per dietary treatment were mixed in the proportions excreted, homogenised and stored as slurry at 4°C until analysis and laboratory measurements of ammonia and methane emissions. Pigs were weighed at the beginning and end of the collection period.
Emission monitoring
Ammonia emissions were measured using a pilot scale system developed by Portejoie et al. (Reference Portejoie, Dourmad, Martinez and Lebreton2004). Two measurements were made per diet. The slurry used for the ammonia emission was kept at 4°C until measurement. Ammonia emissions were determined for a period of 16 days. Samples of 5 kg slurry were placed in each measurement unit. Ammonia emissions were trapped daily in 50 ml H2SO4 (2N). Ammonia concentration and mass of acid were determined.
For the estimation of CH4 emissions, the International Panel on Climate Change (IPCC, 1997) proposed a procedure based on the maximum methane-producing capacity (B 0) of the waste (also known as the ultimate methane productivity or the biochemical methane potential). This procedure was adapted by Vedrenne et al. (Reference Vedrenne, Béline, Dabert and Bernet2007) and modified further for this study to reflect the characteristics of the slurry used as follows. The B 0 was determined for the slurry from each dietary treatment. This was achieved in batch assays in triplicates using 330 ml glass bottles (liquid volume 120 ml) at 38°C with an OMinoculum/OMsubstrate ratio of 0.1. The inoculum (pH: 7.8, ammoniacal: N 3.2 g/kg, total Kjeldahl N: 4.4 g/kg, OM: 3.8%, DM: 5.5%) added in each bottle originated from an anaerobic digestion tank fed with pig slurry and a co-substrate (a horse feed rich in fibre). This allowed the same inoculum to be used for all CH4 measurements. Inoculum (2.4 g, corresponding to 80 mg OM) and corresponding amounts of slurry were placed in the bottles, after which water was added to reach the 120 ml liquid volume. The contents of the bottles were flushed with N2-gas and the bottles were sealed with butyl rubber stoppers. In order to determine the B 0 of the inoculum, bottles with inoculum only were incubated in the same run under the same conditions. During incubation, biogas production was regularly monitored (every 1 to 10 days, depending on biogas production) by pressure measurement of the headspace using a Digitron® manometer 2085 P (Devon, England; absolute pressure meter, 0 to 2000 ± 1 mbar) equipped with Minisart® RC4 filter (Goettingen, Germany; 0.45 μm). From this point, the procedure followed the one developed by Vedrenne et al. (Reference Vedrenne, Béline, Dabert and Bernet2007).
Chemical analyses
For determining nutrient digestibility, DM, OM, nitrogen (N), carbon (C), gross energy, crude fat, crude fibre and cell wall fractions were analysed for both diets and faeces produced.
For diet samples and freeze-dried faeces samples, Association of Official Analytical Chemists (AOAC) (1990) methods were used for measuring DM, ash, total nitrogen, carbon (using NC analyzer (Thermo® Delft, The Netherlands)), Weende crude fibre and crude fat (extracted with petroleum ether). Gross energy (GE) content was measured using an adiabatic bomb calorimeter (IKA, Staufen, Germany). Cell wall fractions (NDF, ADF and ADL) were determined according to the methods of Van Soest and Wine (Reference Van Soest and Wine1967) by using a sequential procedure with amylolytic (thermamyl 120 l) treatment. Starch content was measured for diet samples using the Ewers polarimetric method (EEC, 1972) and the sugar content – corresponding to alcohol-soluble carbohydrates – obtained according to the method of Luff-Schoorl (Bureau Interprofessionnel d’Études Analytiques (BIPEA), 1976). Nitrogen in urine was measured on acidified material using the Dumas method and energy content was obtained after freeze-drying approximately 30 ml of urine in polyethylene bags.
The pH and total ammoniacal nitrogen were determined from fresh faeces and fresh urine. Volatile fatty acid (VFA) contents were also measured on the soluble part of the fresh faeces by liquid chromatography using the method of Peu et al. (Reference Peu, Béline and Martinez2004). For ammonia emission study, slurry was analysed for pH, total nitrogen and total ammoniacal nitrogen at the beginning and end of the 16-day experiment. The NH3 trapped was measured by distillation-titration.
Calculations
Apparent total tract digestibility coefficients of DM, OM, N, C, cell wall fractions and energy in diets were calculated according to standard procedures (Noblet and Perez, Reference Noblet and Perez1993). Digestible energy (DE) content corresponds to the difference between GE intake and the energy loss in faeces, whereas metabolic energy (ME) content corresponds to the difference between DE and the energy loss in urine.
The cumulative ammonia emissions for each treatment were calculated by multiplying the mass of acid by the ammonia concentration. The percentage of emission was determined by dividing cumulative ammonia emission by the initial total nitrogen concentration in each measurement unit.
B 0 values were determined by the following equations:



where n is the measurement number, P (n ) and P (n − 1) are the pressures at the current measurement and at the previous one, CH4(n ) and CH4(n − 1) are the methane contents in biogas at the current measurement and at the previous one, R is the Planck constant (8.314 J/mol per K), V H is the volume of the headspace, T is the incubating temperature in Kelvin (K) and Pγ is the pressure at the standard temperature and pressure (1 atm) and Tx is the temperature at the standard temperature and pressure (273 K) and M OM is the total amount of OM added.
Statistical analysis
Data concerning characteristics of fresh effluents collected during the digestibility trial, N and C balance and nutrient digestibility were analysed by ANOVA as a completely randomised design with dietary treatment as the main effect using the GLM procedure of SAS statistical package (1988, SAS Institute, Inc., Cary, NC, USA). Experimental units were individual pigs. Results from laboratory volatilisation studies were also analysed by ANOVA, with duplicates as experimental units and dietary treatment as the main effect. Results from laboratory methane emissions (B 0) were also analysed by ANOVA, with triplicates as experimental units and dietary treatment as the main effect. Average values for the composition of slurry before and after storage were calculated but no statistical analysis could be performed on these criteria because only one value was available for each treatment.
Results
Digestibility of nutrients, energy and animal performance
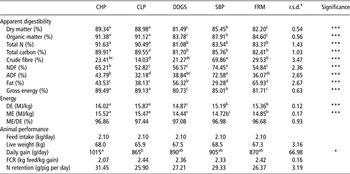
The digestibility of nutrients and energy, and animal performance were significantly negatively affected by the incorporation of co-products. The digestibility of DM, OM and GE decreased significantly (P < 0.05) by 8% to 9% for DDGS and FRM diets and by 4% to 5% for SBP diet compared to the control diets (Table 2). The addition of fibre sources to the diet significantly reduced (P < 0.05) the digestibility of total N and C by 10% and 7%, respectively, compared to the control diets. In the same way, the addition of DDGS significantly reduced DE by 7%. The addition of SBP and FRM significantly decreased (P < 0.05) DE by 5% compared to the control diets. The addition of DDGS, SBP and FRM to the diets significantly decreased (P < 0.05) ME by 7%, 5% and 4%, respectively, compared to the control diets. Since no or very limited feed refusal was observed, animals from the five treatments consumed the same amount of feed. The addition of fibre sources to the pig diets tended to decrease the average daily gain (ADG) of pigs receiving the high fibre diets compared to the CHP diet. Growth rate was also slower for pigs receiving the CLP diet compared to the CHP diet.
Effect of treatments on animal performance and digestibility of nutrients and energy

CHP = control high protein; CLP = control low protein; DDGS = dry distiller’s grain with solubles; SBP = sugar beet pulp; FRM = fatty rapeseed meal; DE = Digestible energy; ME = Metabolizable energy.
a,b,cValues with different superscripts differ significantly between diets (P < 0.05).
†Residual standard deviation.
Influence of dietary treatments on the amount and composition of effluents
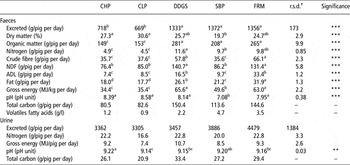
The addition of fibre sources to pig diets had a significant influence (P < 0.05) on the characteristics of faeces in contrast to urine, which was not affected (Table 3). Indeed, the amount of faeces excreted per pig was on average doubled for the pigs receiving the three high-fibre diets compared to the two control diets. The DM contents of faeces decreased significantly (P < 0.05) by 11%, 32% and 15% when pigs were fed DDGS, SBP and FRM diets, respectively, compared to the two control diets. The addition of DDGS, SBP and FRM significantly increased the amount of OM excreted per pig and per day by 89%, 40% and 78%, respectively, compared to the two control diets. The addition of DDGS, SBP and FRM to the diets significantly increased (P < 0.05) the faecal excretory patterns of both N and C by 137% and 87%, 98% and 41%, and 100% and 80%, respectively, compared to the control diets. The amount of crude fibre, NDF, ADL and fat excreted in faeces per pig and per day were also significantly (P < 0.05) increased for pigs fed DDGS, SBP and FRM, compared to the control diets. Finally, the addition of co-products to pig diets increased faeces GE and VFA contents. Faeces pH values were also lower (by 0.25 to 1.31 pH unit) with the fibrous diets compared to the control diets.
Influence of dietary treatments on effluent composition

CHP = control high protein; CLP = control low protein; DDGS = dry distiller’s grain with solubles; SBP = sugar beet pulp; FRM = fatty rapeseed meal.
a,b,cValues with different superscripts differ significantly between diets (P < 0.05).
†Residual standard deviation.
Nitrogen and carbon balances
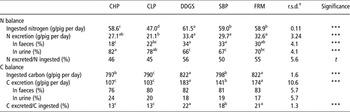
The amount of N ingested was significantly lower for the CLP diet (Table 4). This resulted in a lower total N excretion for CLP treatment than for the other treatments. The addition of DDGS, SBP and FRM tended to increase the amount of N excreted per pig and per day, compared to the CHP diet, by 23%, 10% and 20%, respectively. The partition of N excreted among urine and faeces was also affected by dietary treatments. A higher proportion of N was excreted in faeces for the three high-fibre diets (+32% on average compared to the CLP diet), whereas the lowest proportion of N excreted in faeces (18%) was measured for the CHP diet.
Influence of treatments on the excretory patterns of N and C

CHP = control high protein; CLP = control low protein; DDGS = dry distiller’s grain with solubles; SBP = sugar beet pulp; FRM = fatty rapeseed meal.
a,b,cValues with different superscripts differ significantly between diets (P < 0.05).
†Residual standard deviation.
Daily C excretion was significantly (P < 0.05) increased by the addition of the three co-products, compared to the two control diets which did not differ (Table 4), by 72%, 32% and 63%, respectively. However, the partition of C excretion between urine and faeces did not differ between treatments, with about 80% of C excreted in the faeces.
Ammonia volatilisation and B 0 ultimate methane production potential
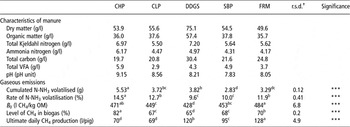
The volatilisation of ammonia and the production of methane were significantly (P < 0.05) affected by the dietary treatments. The addition of fibre sources to the diets and the lowering of CP content (CLP diet) significantly reduced (P < 0.05) the cumulated N-NH3 volatilised from slurry by 31% to 49% and the rate of ammonia volatilisation by 12% to 32% (Table 5) compared to the CHP diet.
Effect of dietary treatments on characteristics of manure, ammonia volatilisation and ultimate methane production

CHP = control high protein; CLP = control low protein; DDGS = dry distiller’s grain with solubles; SBP = sugar beet pulp; FRM = fatty rapeseed meal.
a,b,cValues with different superscripts differ significantly between diets (P < 0.05).
†Residual standard deviation.
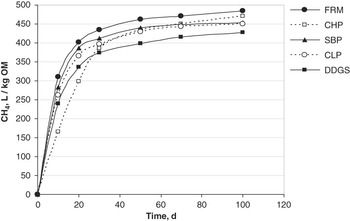
The effect of treatments on the cumulated production of CH4 according to the time of incubation is presented in Figure 1. A fast increase in production is measured over the first 40 days in all treatments. Thereafter, the production of CH4 tends to reach a plateau and a maximum, the B 0 value, is reached after 80 to 100 days of fermentation. Compared to the CHP diet, the addition of DDGS and SBP significantly reduced B 0 by 9% and 4%, respectively, whereas B 0 increased by 3% with the addition of FRM to the diet. The reduction of CP content in the CLP diet also reduced B 0 by 5% compared to the CHP diet. The ranking of the different treatments for cumulated CH4 production remained unchanged according to time, except in the case of the CHP treatment. Over the first 20 days the production of CH4 was the lowest for CHP treatment, whereas after 100 days of incubation it was the highest, together with FRM treatment. This indicates a delay in CH4 production from the slurry from this treatment.
Effect of treatments on cumulated production of CH4.

Owing to the difference in the daily amount of OM excreted per pig according to treatments, the addition of fibre sources affected much more the amount of methane emitted per pig and per day. Indeed, compared to the two control diets, the addition of DDGS, SBP and FRM increased the amount of methane emitted by 73%, 37% and 84%, respectively (Table 5).
Discussion
Digestibility of diets and animal performance
It has been reported that dietary fibre and particularly soluble dietary fibre increases the viscosity of the digesta (Bach Knudsen and Hansen, Reference Bach Knudsen and Hansen1991; Noblet and Le Goff, Reference Noblet and Le Goff2001). Increased viscosity in the small intestine might slow gut transit time (Bach Knudsen and Hansen, Reference Bach Knudsen and Hansen1991; Noblet and Le Goff, Reference Noblet and Le Goff2001) due to suppressed intestinal contractions (Cherbut et al., Reference Cherbut, Albina, Champ, Doublier and Lecannu1990), which in turn leads to less mixing of dietary components with endogenous digestive enzymes (Johnston et al., Reference Johnston, Noll, Renteria and Shurson2003). The changes in the physical characteristics of the intestinal contents due to the presence of specific fibre components may influence gastric emptying, dilute gastrointestinal enzymes and absorbable compounds in the gut and slow down the diffusion or mobility of enzymes, substrates and nutrients to the absorptive surface (FAO, 1998). This phenomenon could explain the decrease in the digestibility of nutrients such as DM, OM, N and C. Zervas and Zijlstra (Reference Zervas and Zijlstra2002) compared the effect of inclusion of 10% soya hull and 5% SBP (178 and 174 g NDF/kg diet) to a commercial pig diet (110 g NDF/kg diet). Soya hull decreased the faecal digestibility of protein by approximately 0.07%, whereas with SBP which contains more soluble fibre it was decreased by approximately 0.13% per g NDF/kg diet. In this study, the addition of 20% DDGS, SBP and FRM to the pig diets decreased the protein digestibility by 0.20%, 0.13% and 0.22% per g NDF/kg diet, respectively, and confirmed the results of Zervas and Zijlstra (Reference Zervas and Zijlstra2002).
Kass et al. (Reference Kass, Van Soest, Pond, Lewis and McDowell1980) showed that growth rate and feed efficiency in pigs are reduced as the dietary fibre level is increased. Several mechanisms account for this phenomenon: (i) dietary fibre serves to dilute the dietary energy content; (ii) the energetic efficiency of absorbed VFA resulting from microbial fermentation of fibre in the large intestine is lower compared with glucose absorption in the small intestine (Grieshop et al., Reference Grieshop, Reese and Fahey2001); (iii) the dietary fibre-mineral interactions reduce N utilisation and increase rates of passages (Calvert, Reference Calvert1988). In this study, the pigs received the same amount of feed per day. The ME and DE values of the diets with co-products being lower, this resulted in a lower ME and DE energy intake for these diets. This could be the main reasons for the slower ADG measured with these diets. However, these results must be taken with care because of the limited number of animals and the short duration of the experiment. The lower ADG measured with the CLP diet compared to the CHP diet is more difficult to explain. It could be related to insufficient supplies of secondary limiting amino acids (i.e. valine) due to the low CP content.
Characteristics of faeces and urine and N and C balances
According to Egron et al. (Reference Egron, Tabbi, Guilbeaud, Chevalier and Cadore1996), the increase in faecal mass when animals are fed high-fibre diets may be due to a combination of several factors: (i) a larger amount of indigestible fibre excreted, (ii) a greater ability of digesta to retain water from the fibre excreted, (iii) the excretion of undigested products due to the fibres. The lowest DM content of faeces from diets rich in fibre is confirmed in our study, as well as the increased faecal excretion. The addition of fibre sources, however, had no effect on the quantity of urine excreted. This may be related to the fact that the amount of water allocated per day per pig was fixed, in order to avoid spillage, and not distributed ad libitum as in similar studies (Massé et al., Reference Massé, Croteau, Massé, Bergeron, Bolduc, Ramonet, Meunier-Salaun and Robert2003). The excretory route of N was modified in pigs fed co-products compared to the control diets. Fibre increases the flow of fermentative energy substrate and N (of both exogenous and endogenous origin) into the large intestines. Under fermentation conditions (as with higher dietary intake), ammonia is partially derived from the bloodstream and used by the microflora for the new synthesis of bacterial proteins, which are excreted in the faeces. Owing to the fact that the incorporation of ammonia into bacterial protein results in an overall decrease in ammonia available for absorption into the blood and subsequent assembly into urea, a shift in the excretory pattern takes place with more N excreted in the faeces and a concomitant decrease in urinary N pattern excretion (Low, Reference Low1985). Very few studies have evaluated the effect of dietary fibre source incorporation on excretory C patterns. Vu et al. (Reference Vu, Prapaspongsa, Poulsen and Jørgensen2009) have proposed prediction equations for faecal C excretion by growing pigs showing that faecal C was mainly correlated to the digestibility of OM, the pig BW and the N intake. In this study, in agreement with these results, C excretion in the faeces increases as a consequence of the low digestibility of nutrients (protein, fibre and fat), but this had only limited effects on the partition of excreted C between urine and faeces, faeces being the major route of C excretion in all situations. A second explanation as for N excretion could be found in higher bacterial activity in the digestive tract and especially possibly a higher bacterial excretion in the faeces.
Gaseous emissions
The ammoniacal N content in slurry from diets with added fibre sources, with about 17.5% CP, is almost equivalent to that of the slurry from the control CLP diet with 14% CP and much lower than that of the slurry from the control CHP diet with 17.5% CP. Sommer and Husted (Reference Sommer and Husted1995) showed that the ammoniacal N content is an important factor of variation of effluent pH. The N that is assimilated in organic form via bacterial protein production into the large intestine and excreted in the faeces is less rapidly degraded to ammonia as compared to urea, which is rapidly converted into ammonia. Canh et al. (Reference Canh, Verstegen, Aarnink and Schrama1997) and Mroz et al. (Reference Mroz, Moeser, Vreman, van Diepen, van Kempen, Canh and Jongbloed2000) reported that the addition of fermentable fibre to the diet will most likely lead to higher VFA production in the large intestine, thus resulting in a lower slurry pH, which has been shown to diminish ammonia emissions. These VFA are produced by the bacterial degradation of fibres such as pectin, cellulose and hemicellulose. In this study, the pH of slurry from diets rich in fibre is reduced, in agreement with the results obtained by Canh et al. (Reference Canh, Verstegen, Aarnink and Schrama1997 and Reference Canh, Sutton, Aarnink, Verstegen, Schrama and Bakker1998). In agreement with the results of Portejoie et al. (Reference Portejoie, Dourmad, Martinez and Lebreton2004), the decrease in dietary CP from 17.5% to 14.0% resulted in about 30% reduction in ammonia volatilisation. The incorporation of fibre sources to the diet, without reducing CP content, resulted in about 40% reduction in ammonia emission compared to the CHP diet, which is in line with the results obtained by Canh et al. (Reference Canh, Sutton, Aarnink, Verstegen, Schrama and Bakker1998).
The production of methane in the process of anaerobic digestion depends on several factors: the effluent pH, the temperature and the physicochemical characteristics of effluent including the ammoniacal nitrogen and VFA contents (Vedrenne et al., Reference Vedrenne, Béline, Dabert and Bernet2007). The methodology to measure B 0 implies a dilution with water and a control of the temperature of incubating samples. These precautions are taken in order to prevent the inhibitions due to ammoniacal N and to optimise the development of the pool of bacteria associated with anaerobic digestion. In the literature, the B 0 values of pig slurry vary between 290 and 480 ml CH4/g OM. Our results are within this range (428 to 484). Velthof et al. (Reference Velthof, Nelemans, Oenema and Kuikman2005) showed that methane production was positively correlated with slurry DM, carbon and VFA contents. They also showed that the B 0 of slurry was lower for diets with low protein levels. This effect is most likely due to low levels of VFA in slurry during anaerobic digestion (Zeeman, Reference Zeeman1991). Velthof et al. (Reference Velthof, Nelemans, Oenema and Kuikman2005) also showed that methane production depends on the dietary content of fibre non starch polysaccharides: less fibres in the diet and in slurry resulting in less methane production. This is because methane production is related to the total carbon content and VFA content of slurry. Our results are consistent with the results of these authors. The highest B 0 are measured with slurry from diets high in fibre or/and CP contents (FRM, CHP and SBP). However, it is interesting to note that the B 0 of the slurry from DDGS treatment is the lowest, although the CP and fibre contents are similar to those of slurry from SBP and FRM treatments. This could be explained by the fact that the manufacturing process of DDGS requires heating steps that may be causing reactions between protein and other molecules, such as lignin, resulting in products hardly degradable by the bacteria involved in the anaerobic digestion. Conversely, the increased B 0 measured for the slurry from the FRM diet could be related to its higher fat content. The different dynamic of methane production between the low and the high-protein treatments could be related to the initial composition of the slurry. Hansen et al. (Reference Hansen, Angelidaki and Ahring1998) have shown that a high concentration in ammoniacal N may inhibit methane production. The higher initial ammoniacal N content and pH of CHP slurry would have delayed methane production, whereas its higher VFA content would have favoured a higher B 0 value, compared to CLP treatment. The calculation of the correlations between B 0 and the initial composition of OM from the five slurries indicates that the variation of B 0 is mainly related to the slurry fat content (g/g OM) (B 0 = 1800 fat +278, r = 0.89, P < 0.05) and to a lesser extent to the slurry C content (g/g OM) (B 0 = 892 C – 85.5, r = 0.65, P < 0.05). This is in agreement with the results from different studies showing that the addition of different fat sources to cow or pig manure increases methane production during anaerobic digestion (Li et al., Reference Li, Sasaki, Yamashita, Seki and Kamigochi2002).
When the potential methane production is expressed per pig and per day, differences among treatments are much more marked. This is mainly related to the difference in excretion of OM. When the production of CH4 is not controlled, which is often the case when slurry is stored in the piggery or outside, most often over long periods of time, this will result in increased CH4 emissions to the atmosphere with harmful effects on the environment. Conversely, in the case of anaerobic treatment, the increased CH4 production will contribute to increased energy production as heat and/or electricity, which has a positive environmental impact.
Conclusion
This study has shown that adding biofuel co-products, rich in fibre, to pig diets results in a shift of nitrogen excretion from urine to faeces, a decrease in slurry pH and an increase in the amount of slurry C, OM and VFA. This results in a decrease in the rate of volatilisation of ammonia during storage and an increase in the production of methane. Thus, the composition of the diet and its effect on the quantity and characteristics of the effluent should be considered in the context of optimising waste collection procedures and waste treatments to minimise uncontrolled emissions of ammonia and methane, or in some situations, to maximise the controlled emission of methane.
Acknowledgements
The authors gratefully acknowledge G. Guillemois for the preparation of diets, F. Le Gouevec and R. Janvier for taking care of the animals and manure collection and sampling, and Yolande Jaguelin-Peyraud, Anne Pasquier and Fabienne Pontrucher for laboratory analysis. This study received a PhD grant financed by the ADEME and the Regional Council of Brittany and financial supports from the PSDR ‘Biodecol2’ research programme and from the PhASE department of INRA.