




No CrossRef data available.
Article contents
Low positive emotionality in young children: Association with EEG asymmetry
Published online by Cambridge University Press: 07 April 2005
Abstract
Low positive emotionality (PE; e.g., listlessness, anhedonia, and lack of enthusiasm) has been hypothesized to be a temperamental precursor or risk factor for depression. The present study sought to evaluate the validity of this hypothesis by testing whether low PE children have similar external correlates as individuals with depression. This paper focused on the external correlate of EEG asymmetry. Previous studies have reported that individuals at risk for depression exhibited a frontal EEG asymmetry (greater right than left activity). Others have reported an association with posterior asymmetries (greater left than right activity). In the present study, children classified as having low PE at age 3 exhibited an overall asymmetry at age 5–6 with less relative activity in the right hemisphere. This asymmetry appeared to be largely due to a difference in the posterior region because children with low PE exhibited decreased right posterior activity whereas high PE children exhibited no posterior asymmetry. These findings support the construct validity of the hypothesis that low PE may be a temperamental precursor or risk factor for depression.
We gratefully acknowledge Jurgen Kayser's assistance and advice.
Information
- Type
- Research Article
- Information
- Copyright
- © 2005 Cambridge University Press
Personality is often conceptualized as a hierarchical structure, with an upper tier consisting of several “superfactors” that are each divisible into a larger number of narrower traits or “facets.” The two personality superfactors included in most models of personality are extraversion/positive emotionality (PE) and neuroticism/negative emotionality (NE). PE includes positive affect (e.g., joy), behavior activation, and affiliation. NE is characterized by increased sensitivity to negative stimuli, resulting in a large range of negative moods such as sadness, fear, anxiety, guilt, and anger. These two dimensions are hypothesized to be orthogonal to each other (Tellegen, 1985; Watson, Wiese, Vaidya, & Tellegen, 1999), suggesting that individuals can either be high on one, both or neither.
Depression researchers have long been interested in the relationship between temperament or personality and depression (Klein, Durbin, Shankman, & Santiago, 2002; von Zerssen & Akiskal, 1998). Although high NE is hypothesized to be a temperamental risk factor for a number of psychopathological conditions, including depression, low PE has been hypothesized to be a temperamental risk factor that is specific to depression (Clark & Watson, 1991). Individuals with low PE are characterized by a tendency to experience low positive affect, listlessness, anhedonia, and lack of enthusiasm (Tellegen, 1985; Watson et al., 1999). These individuals are often considered to have a deficit in reward seeking behaviors, and have been described as exhibiting a “low approach affective style” (Davidson, 1994) or a deficit in a behavioral activation system (Depue & Iacono, 1989; Fowles, 1994; Gray, 1994).
The majority of investigations of the relation between low PE and depression have focused on adults (Clark, Watson, & Mineka, 1994). The theory, however, has important implications for developmental psychopathologists interested in identifying precursors and risk factors that precede the onset of the disorder (Davidson et al., 2002; Hamburg, 1998). There are several ways that low PE has been hypothesized to lead to depression in children. According to Meehl (1975) and Hamburg (1998), children with low PE have a diminished capacity for pleasure; therefore, rewards are not experienced as pleasurable, and consequently, positive reinforcement is less effective. Without effective positive reinforcement, skill development in children becomes a frustrating endeavor. Hamburg (1998, pp. 394–395) writes the following:
Most of the skills a child develops, whether interpersonal or noninterpersonal, are learned via schedules of intermittent reinforcement—sometimes the child hits the right note on the piano, sometimes not; sometimes she amuses someone with something she says, sometimes not … For a child with [low PE], correct responses would not feel very different from incorrect responses. As a result, the learning process feels like an uninterrupted series of incorrect responses … She experiences it all as difficult, frustrating, and unrewarding.
The end result of this process is that low PE children may (a) have a more restricted repertoire of skills and coping strategies (Fredrickson, 2001), (b) fail to develop a sense of self-efficacy and mastery (Bandura, Pastorelli, Barbaranelli, & Caprara, 1999), and (c) develop depressogenic schemas characterized by themes of helplessness and worthlessness (Hamburg, 1998), all of which may contribute to an increased risk for depression.
Consistent with this theory, a few studies have reported preliminary evidence for the relation between childhood low PE and risk for depression. Neff and Klein (1992) found that toddlers of mothers with a history of major depressive disorder exhibited less appetitive behavior and lower positive affect than the offspring of never depressed mothers in naturalistic home observations. Field, Healy, Goldstein, Perry, Bendell, Schanberg, Zimmerman, and Kuhn (1988) found similar results in laboratory observations of infants of mothers with elevated depressive symptoms. Both of these studies, however, compared the temperaments of children at risk, by virtue of maternal depression, with those not at risk. An alternative approach would be to compare individuals with and without the hypothesized temperament on their risk for depression (Klein & Anderson, 1993).
The current study is part of a larger project that seeks to test and elaborate the hypothesis that low PE is a precursor of, or risk factor, for depression. To fully test the hypothesis, low PE children would need to be followed longitudinally to see if they are more likely to develop depression than a comparison group. Because such a study is costly, our program is based on a construct validation approach (Cronbach & Meehl, 1955). We selected a series of features to evaluate the external validity of the low PE–depression link. In other words, if low PE children exhibit external correlates that are also associated with risk for depression, the hypothesis that low PE is a precursor/risk factor for depression would be supported. We have chosen to focus primarily on two external correlates: family history of depression, and the asymmetry of an EEG recorded at rest. In our first paper we found that low PE children had higher rates of maternal depression than high PE children (Durbin, Klein, Hayden, Buckley, & Moerk, in press). This paper reports the results for EEG recorded at rest.
A secondary aim of this study is to explore whether high NE is also related to risk for depression (Shankman & Klein, 2003). As stated earlier, PE and NE are often conceptualized as orthogonal dimensions of personality (Tellegen, 1985), and high NE has been hypothesized to be a nonspecific risk factor for several disorders, including depression (Clark & Watson, 1991). In the present study, we also examined whether high NE or the combination of low PE and high NE is related to EEG asymmetry. Because we were primarily interested in low PE and only secondarily interested in high NE, we selected subjects on the basis of PE and left NE free to vary.
EEG Asymmetry, Temperament, and Depression
Much of the research examining whether particular patterns of resting EEG are associated with depression and personality arise from Davidson's approach–withdrawal model (Davidson, 1994; Davidson et al., 2002). This model proposes that individuals predisposed to depression have an “affective style” that can be characterized by a deficit in reward seeking motivation. According to the model, this “low approach affective style” is associated with an asymmetry in frontal brain activity due to a decrease in left frontal regions (with less activity being operationalized as greater alpha band power). The approach–withdrawal model also proposes that individuals with high NE are predisposed for anxiety and have a tendency to overwithdraw from negative stimuli. An asymmetry in frontal brain activity due to an increase in right frontal regions is hypothesized to be associated with this anxiety-prone “high withdrawal affective style” (see Heller, Nitschke, & Miller, 1998). It is important to note that although both of these affective styles are hypothesized to be associated with a frontal asymmetry, the “low approach” is due to a decrease in left regions whereas the “high withdrawal” is due to an increase in right regions.
Several studies have reported that individuals with depression (Gotlib, Ranganath, & Rosenfeld, 1998; Henriques & Davidson, 1991) and individuals who have recovered from depression (Gotlib et al., 1998; Henriques & Davidson, 1990) displayed an alpha asymmetry indicative of lower relative left frontal activity (although see Pizzagalli et al., 2002, and Reid, Duke, & Allen, 1998, for inconsistent findings). Researchers have also found that children of depressed individuals exhibited this frontal alpha asymmetry while at rest (Dawson, Frey, Panagiotides, Osterling, & Hessl, 1997; Field, Pickens, Fox, & Nawrocki, 1995) and during the elicitation of positive affect (Dawson, Frey, Self, Panagiotides, Hessl, Yamada, & Rinaldi, 1999; Jones, Field, Fox, Davalos, & Gomez, 2001).
Similar to the present study, several researchers have also examined the association between childhood temperament and the hypothesized frontal EEG asymmetry. The majority of these studies have focused on behavioral inhibition, a temperament that is characterized by wariness and fear in the presence of unfamiliar people and objects (Kagan, 1994, 1997). This construct overlaps with both low PE (e.g., low approach and sociability) and high NE (e.g., anxiety, fear), but differs from both in that it is limited to novel contexts. Fox and colleagues reported a frontal asymmetry for infants who cried when separated from their mother (Davidson & Fox, 1989), and for preschool and elementary school children who displayed social reticence in a peer situation (Schmidt & Fox, 1994). Recently, Fox, Henderson, Rubin, Calkins, and Schmidt, (2001) reported that children classified as behaviorally inhibited across several time points from infancy through early childhood displayed the proposed asymmetry as well. Children who were cross-sectionally classified as behaviorally inhibited at each time point, however, did not consistently display the hypothesized asymmetry at each assessment point. Similar findings were also reported by Davidson and Rickman (1999). Several of these studies only computed an EEG asymmetry score (i.e., right hemisphere activity minus left hemisphere activity), making it impossible to determine if the asymmetry was due to a decrease in left, an increase in right, or a combination of the two (Tomarken & Keener, 1998).
Posterior regions of the brain have also received attention in resting EEG studies of depression. Several researchers have reported a posterior asymmetry due to a decrease in right posterior activity in adults with depression (Bruder, Fong, Tenke, Leite, Towey, Stewart, McGrath, & Quitkin, 1997; Henriques & Davidson, 1990; Kentgen, Tenke, Pine, Fong, Klein, & Bruder, 2000; Reid et al., 1998; although not Henriques & Davidson, 1991; Schaffer, Davidson, & Saron, 1983) and in children of parents who both had major depression (Bruder, Tenke, Warner, Nomura, Grillon, Hille, Leite, & Weissman, in press). In contrast to the frontal asymmetry, the interpretation of the posterior asymmetry in depression has not been discussed in terms of the approach–withdrawal model but in terms of emotional information processing. The right posterior region of the brain has been associated with the processing of emotional information in lesion studies (Pell, 1999; Tucker, Watson, & Heilman, 1977), event-related potential (ERP) studies (e.g., Kayser, Tenke, Nordby, Hammerborg, Hugdahl, & Erdmann, 1997), and neuropsychological studies (see Heller, Nitschke, & Miller, 1998; Borod, 1992, for review). Depressed individuals' decreased activity in right posterior regions is hypothesized to be associated with low levels of emotional arousal, and a reduced ability to accurately judge the affective significance of stimuli (see Heller, 1990; Bruder, 2003). Consistent with this hypothesis, depressed individuals have exhibited reduced activity over right parietal regions during the processing of emotional stimuli (Kayser, Bruder, Tenke, Stewart, & Quitkin, 2000).
To summarize, there are two primary hypotheses for the present study. Compared to high PE children, those classified as low PE will exhibit EEG asymmetries similar to those reported for depressed individuals. That is, compared to high PE children, low PE children will exhibit a frontal asymmetry due to reduced left frontal activity and/or a posterior asymmetry due to reduced right posterior activity.
A secondary aim of the study is to examine the relation between NE and EEG asymmetry. Specifically, we wanted to explore (a) whether NE is associated with frontal or posterior asymmetries and (b) whether NE moderates the relation between PE and EEG asymmetry.
Methods
Subjects
Subjects were selected from a larger study of temperamental precursors of depression in a sample of 3-year-olds (Buckley, Klein, Durbin, Hayden, & Moerk, 2002; Durbin et al., in press). Briefly, 100 preschool age children from the community were assessed with a comprehensive laboratory battery designed to tap multiple temperament traits, a Q-sort completed by an experimenter following each of two behavioral observations conducted in the home (Buckley et al., 2002), and parental reports. Children were recruited from advertisements in newspapers, flyers in local preschools, and commercial mailing lists. All children were screened for major health problems and developmental disabilities. Children were administered the Peabody Picture and Vocabulary Test (PPVT) to screen for the presence of gross cognitive impairment.
Laboratory assessment of child temperament
Children were selected for the present study based on their performance on the laboratory battery. The battery consisted of various components of the Laboratory Temperament Assessment Battery (Lab-TAB; Goldsmith, Reilly, Lemery, Longley, & Prescott, 1995), a standardized set of laboratory episodes designed to elicit different emotional responses. Including a warm-up period, the entire assessment lasted between 1.5 and 2 hr. Episodes were ordered so as to prevent carryover effects in that no episodes presumed to evoke similar affective responses occurred consecutively. Each episode was also followed by a brief play break to allow the child to return to a neutral state. Mothers were present in the room for all episodes, with two exceptions noted below. Episodes are described in the order in which they were conducted, along with the trait(s) each was designed to elicit.
Risk Room (fearfulness; activity level)
In this episode, employed in studies of behavioral inhibition (Kagan, 1997), the child was allowed to play with novel/ambiguous stimuli, including a cloth tunnel, small staircase, balance beam, and two “scary” items (Halloween mask; a large black box decorated with eyes and teeth). After 5 min of free play, the experimenter returned to the room and asked the child to play with each object.
Tower of Patience (engagement; inhibitory control)
The child and experimenter took turns building a tower with cardboard blocks. The experimenter adhered to a schedule of delays (5, 10, 15, 20, and 30 s) before taking her turn, forcing the child to wait longer each time to take his or her turn.
Arc of Toys (PE; NE; noncompliance)
This episode included 4 min of free play with toys (play shopping cart and food, toy bowling ball and pins, stuffed animal, hula-hoop, truck, and toy lawn mower). The experimenter then asked the child to clean up the play area.
Stranger Approach (fearfulness)
The child was left alone briefly in the assessment room. A male research assistant entered the room and spoke to the child in a neutral voice while gradually walking closer. Mothers were not present in the assessment room for this episode.
Make That Car Go (PE; engagement)
The experimenter and child raced with two remote-controlled racecars.
Transparent Box (NE; engagement)
The experimenter locked an appealing toy in a transparent box, and left the child with a set of incorrect keys to open the box. After 3.5 min, the experimenter returned, explaining that she had accidentally left the wrong keys. The child was then encouraged to use the correct key to open the box and was allowed to play with the toy.
Pop-Up Snakes (PE)
The experimenter showed the child a can that appeared contain potato chips, but actually contained coiled spring snakes. The experimenter demonstrated the trick, and encouraged the child to surprise his or her mother with the snakes.
Snack Delay (NE; inhibitory control)
In this episode, the child was instructed to wait for the experimenter to ring a bell before eating a piece of candy. The experimenter waited a systematic series of delays before ringing the bell (10, 20, and 30 s).
Impossibly Perfect Green Circles (NE)
The experimenter repeatedly asked the child to draw a circle on a large piece of paper, which the experimenter then mildly criticized.
Popping Bubbles (PE; activity level)
The child and experimenter played together with a bubble-shooting toy.
Painting a Picture (PE)
The child was allowed to play freely with watercolor pencils and crayons.
Box Empty (NE)
The child was given a gift-wrapped empty box to open, under the pretense that an appealing toy was inside. After a brief interval in which the child was left alone to discover that the box was empty, the experimenter returned with several small toys for the child to keep, explaining that she had forgotten to place the toys inside. Mothers were not present during this episode.
Children's behaviors were videotaped and coded (see Durbin et al., in press, for a detailed description of the coding). Raters watched an entire episode and made a global rating for each trait based upon all behaviors thought relevant to that trait. The same traits were rated in each episode, regardless of the emotion the episode was designed to elicit. Facial, vocal, and bodily indicators of each emotion were coded separately and then averaged to produce composite variables reflecting overall emotional expression. Scales were comprised of the average of summed ratings of each trait across all episodes. In this report, we examine ratings of PE and NE (including fear, sadness, and anger). We also include ratings of compliance to explore whether any differences are attributable to a tendency for noncompliant behavior. Interrater reliability was assessed on a subsample of 15 cases. The median intraclass correlation was .82, and ranged from .66 (for fear) to .94 (for PE). Lab ratings of temperament also demonstrated moderately high convergent validity with home observations of temperament.
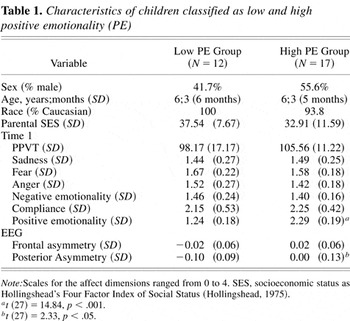
Children falling in the upper and lower 25% on the PE dimension were invited to return for another laboratory assessment when they were between the ages 5 and 6. Because of ties in rank order, 52 children were eligible for follow-up. This assessment was similar to the first Lab-TAB, but modified for slightly older children. Forty-one (78.8%) of the possible 52 children participated in this follow-up evaluation. Of this sample, 73.2% (N = 30) were right handed (see section on Lateral preference) and agreed to participate in an additional EEG study session. One child had to be excluded due to an inadequate number of artifact-free epochs, yielding a final sample of 29 (12 low PE children, 17 high PE children). The 29 children who participated were compared to the 23 who did not on gender, age, all of the above temperamental traits, PPVT, race, parental socioeconomic status (SES), and parental education. None of the comparisons were significant. Table 1 gives characteristics of the low and high PE children. For the 29 children in the present study, PE at age 3 was highly correlated with PE at age 5–6, r (N = 29) = .68, p < .001, and children who were categorized as high and low PE differed on PE at follow-up, t (27) = 4.18, p < .001.
Characteristics of children classified as low and high positive emotionality (PE)

Lateral preference
Lateral preference was determined from performance on a battery of eight tasks that assessed hand, foot, and eye preference (e.g., kick a ball, write name, look through a keyhole, etc.; Longoni & Orsini, 1988). All 29 children had a right lateral preference on at least six of eight tasks.
Procedure
Resting EEGs were recorded in a sound attenuated booth during six 60-s blocks in which children either had their eyes open (O) or closed (C) in one of two counterbalanced orders (OCCOOC or COOCCO). During the blocks, children were instructed to remain still and to inhibit blinks or eye movements during each recorded period. During the eyes open condition, children were instructed to fixate on a spot on the wall. Data were collected without knowledge of children's temperamental classification.
As other EEG researchers have done with children this age (Ashman & Dawson, 2002; Fox, Schmidt, Calkins, Rubin, & Coplan, 1996) the procedure had a “space” motif to increase compliance and decrease the amount of movement related artifact in the data. For example, the electrode cap and sound attenuation booth were referred to as a “space helmet” and “spaceship,” respectively. Children were given prizes for each successful “mission” (i.e., the six 60-s blocks).
Electrophysiological recording and analyses
Scalp EEG was recorded from six lateral pairs of electrodes (F7/F8, F3/F4, T7/T8, C3/C4, P7/P8, and P3/P4) and from one midline electrode (Cz) using an electrode cap (tin electrodes, Electro Cap International, Inc.) with a left ear reference. Additional electrodes at supra- and infraorbital sites surrounding the right eye were used to monitor eyeblinks and vertical eye movement and electrodes at right and left outer canthi monitored horizontal eye movements. Data were also collected from the right ear to rereference the scalp data off-line to a linked-ear reference. The electrode cap was connected to a chest harness to reduce the likelihood of movement. All electrodes' impedances were below 5 kΩ and homologous electrodes (e.g., F3/4) were within 1.5 kΩ of each other. The EEG was recorded with a Grass Neurodata acquisition system at a gain of 10 K (5 K for eye channels) with a bandpass of 1–30 Hz. A PC-based EEG acquisition system (Neuroscan 4.1) acquired and digitized the data continuously at 1000 Hz over each 60-s block.
Data were segmented into consecutive 2.048-s epochs every 1.024 s (50% overlap; yielding approximately 180 epochs/condition) and then examined for evidence of amplifier saturation. After referencing to a linked ear reference off-line, epochs contaminated by blinks, eye movements, and movement-related artifacts were excluded from analyses. These criteria produced artifact-free data, as verified by direct visual inspection of the raw data. This method of dealing with artifacts has been shown to preserve spectral power across bands better than the widely used method of EOG correction, particularly in children, who typically display these types of artifacts more than adults (Somsen & van Beek, 1998). The low PE and high PE groups did not differ on mean number of accepted epochs during the O, low PE = 50, high PE = 56, t (27) = 0.63; or C, low PE = 47, high PE = 60, t (27) = 1.24, p > .10, conditions. The EEG was tapered over the entire 2.048 s by a Hanning window to suppress spectral side lobes. Artifact-free data that have been attenuated at the beginning and end of an epoch are recovered in adjacent (overlapping) epochs.
Power spectra were computed off-line from EEG data using a fast Fourier transform. The average absolute alpha power was then computed for each electrode site and then log10 transformed to normalize the data. For the alpha band, 7–12 Hz was used instead of the standard adult band because children do not have the same frequency bands as adults (Pivik, Broughton, Coppola, Davidson, Fox, & Nuwer, 1993). This range was empirically validated by assuring that the alpha peak was approximately centered in this band for every subject.
Statistical analyses
To generate regional alpha values, electrode sites were pooled within anterior (F7/F8, F3/F4), central (T7/T8, C3/C4), and posterior (P7/P8, P3/P4) regions for each hemisphere.1
We also examined the lateral (7/8) and medial (3/4) rows separately and found patterns similar to when we pooled electrodes within regions.
Given the recent finding by Miller, Fox, Cohn, Forbes, Sherrill, and Kovacs (2002) that male and females with a history of depression exhibit opposite frontal EEG asymmetries, our first model also included gender as a between-groups variable. Gender did not significantly interact with group so gender was dropped from the ANOVA. Interestingly, there was a significant Hemisphere × Sex interaction with boys having greater relative activity in the right hemisphere and girls have greater relative activity in the left, F (1, 25) = 6.07, p = .021. This is consistent with the controversial finding that males tend to rely more heavily on right hemisphere or visuospatial processing and females tend to make greater use of left hemisphere or verbal processing (see Bryden, McManus, & Bulmanfleming, 1994, for discussion of gender differences and lateralization).
As expected, the ANOVA revealed that there was more alpha power (less activity) in the posterior than anterior and central regions and during the eyes closed than open conditions. The Eyes factor did not interact with group. Thus, we examined group differences in mean log alpha power averaged across the two eye conditions in a three-way Region × Group × Hemisphere ANOVA.
Results
Preliminary comparisons between low PE and high PE children (defined at age 3) were conducted to determine whether these children differed on any variable of interest other than PE (see Table 1). The two groups did not differ on gender, age, race, PPVT, Hollingshead's Four Factor Index of Social Status (Hollingshead, 1975), or ratings of sadness, fear, anger, overall NE, and compliance. As with the larger sample from which the present one was drawn (see Durbin et al., in press), PE and NE were relatively orthogonal dimensions of temperament (r = −.07 in this sample).
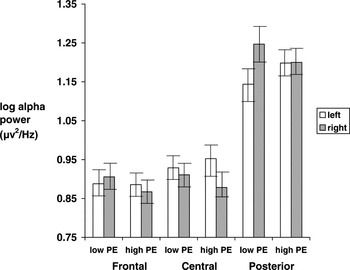
A three-way ANOVA of alpha power (region, hemisphere, group) yielded a significant Group × Hemisphere interaction, F (1, 27) = 6.84, p = .01, η2 = .20. Simple effects analyses indicated that the children who were in the low PE group at age 3 exhibited less activity (increased alpha) over the right hemisphere relative to left, F (1, 27) = 9.01, p < .01, but the high PE group did not exhibit this asymmetry, F (1, 27) = 0.24, p = .63.
The Group × Hemisphere × Region interaction was not significant, F (2, 27) = 1.93, p =.17. Nevertheless, because of a priori hypotheses regarding asymmetries in specific regions, simple effects analyses were used to evaluate asymmetries in frontal, central, and posterior regions separately. For the frontal region, there was no significant Group × Hemisphere interaction, F (1, 27) = 2.37, p = .14, η2 = .08. For the central region, there was also no significant Group × Hemisphere interaction, F (1, 27) = 2.68, p = .12, η2 = .09. For the posterior region, however, there was a significant Group × Hemisphere interaction, F (1, 27) = 5.42, p < .05, η2 = .17. Simple effects analyses indicated that the low PE group exhibited less relative activity (greater alpha power) in the right posterior region, F (1, 27) = 9.56, p < .01, but the high PE group exhibited nearly symmetrical levels of posterior activity across both hemispheres, F (1, 27) = .004, p = .95 (see Figure 1).

Hemispheric asymmetries of EEG alpha power by region. The higher the alpha power, the lower the activity; error bars are standard errors.
Even though PE was generally stable from age 3 to age 5–6, because the groups were defined by their age 3 temperament assessment and EEG was recorded at age 5–6 we examined the EEG asymmetries in children whose score on the PE dimension remained stable from age 3 to 5–6. As stated in the Methods section, children were invited to return for follow-up only if they were in the top and bottom 25% on the PE dimension. Children in the low PE group (at age 3) were considered to have stable PE scores if their follow-up PE score was below the median. Children in the high PE group (at age 3) were considered to have stable PE scores if their follow-up PE score was above the median. Twenty-three (10 low, 13 high) of the 29 children (79%) in the previous analyses had stable temperament. Analyses of EEG data for these 23 children were nearly identical to the larger sample.
We next explored whether EEG asymmetry was related to NE (sadness, fear, anger, overall NE) and compliance. Because these were continuous dimensions (and were approximately normally distributed throughout the sample) rather than dichotomously selected groups (like our PE groups), we ran Pearson correlations between these dimensions and asymmetry indexes. Three asymmetry indices were computed; one for frontal, one for central, and one for posterior electrodes. Following the guidelines of Pivik et al. (1993), each asymmetry index was computed as the log10 of alpha power at recording sites on the left minus those on the right (e.g., log10 left posterior − log10 right posterior). For both of the indices, higher values indicate more relative right sided activity. None of these temperament dimensions significantly correlated with frontal, central, or posterior asymmetries (p > .10 for all rs). This contrasts with the difference exhibited by our PE groups on posterior asymmetry (see Table 1).3
The asymmetry indices were not correlated with mean alpha power for the region (ps > .50), suggesting that subjects with higher asymmetries did not simply have higher overall alpha power.
Although NE was not related to hemispheric asymmetry, it is possible that NE (or any of the NE dimensions) moderated the relation between PE and hemispheric asymmetry. Following the guidelines of Aiken and West (1991) to test interactions, we ran multiple regressions where the DV was the asymmetry index and the IVs were PE, NE, and the interaction term (PE × NE). Both PE and NE were centered around their respective means. We ran separate multiple regressions for each NE dimension (sadness, fear, anger, overall NE) and for each region. The interaction term (PE × NE) was not significant for any of these regressions, suggesting that NE did not moderate the relation between PE and asymmetry.
Finally, because hemispheric asymmetries measures may differ depending on the reference (Bruder et al., 1997; Debener, Beauducel, Brocke, & Kayser, 2000), all analyses were recomputed after rereferencing the epoched data to Cz. Results were nearly identical for a Cz and linked ear reference.
Discussion
This paper evaluated whether the temperamental dimension of PE in children is related to hemispheric asymmetry, as assessed by resting EEG. We found that children classified as low PE at age 3 exhibited an overall hemispheric asymmetry at age 5–6, with less activity (increased alpha) over the right hemisphere relative to left. This asymmetry appeared to be largely due to a posterior asymmetry. Low PE children exhibited greater alpha (i.e., less activation) in the right posterior region of the brain relative to the left posterior region, whereas high PE children did not exhibit a posterior asymmetry.
Along with our findings that low PE is related to maternal history of depression (Durbin et al., in press), the present paper provides construct validity (Cronbach & Meehl, 1955) for the hypothesis that low PE is a temperamental precursor or risk factor for depression. That is, children whose temperament is classified as low PE exhibited a similar pattern of EEG asymmetry as depressed individuals (Bruder et al., 1997; Henriques & Davidson, 1990; Reid et al., 1998) and individuals at risk for depression by virtue of having two depressed parents (Bruder et al., in press).
One question that remains, however, is whether (and how) an asymmetry in brain activity contributes to the development of depression. A posterior asymmetry due to decreased activity in right posterior regions (increased alpha power) of the brain has been shown to be associated with low emotional arousal and abnormal processing of emotional stimuli (Borod, 1992; Heller et al., 1998; Kayser et al., 2000). It is possible that the low PE children in the present study have a decreased ability to accurately judge the affective significance of stimuli, and this is reflected in their responses to the emotion provoking situations of the Lab-TAB. This deficit may be specific to responses to positive stimuli, as none of the dimensions of NE (fear, anger, sadness) were related to a hemispheric asymmetry. The notion that abnormal processing of positive affective stimuli may be related to depression is consistent with the theory proposed by Meehl (1975) and Hamburg (1998) in which a deficit in hedonic response systems leads to a reduction in perceived positive reinforcement, producing decreased exploration and mastery behavior, and resulting in cognitive and interpersonal vulnerabilities to depression.
A secondary aim of the study was to explore whether NE was related to risk for depression independent of, or in combination, with low PE. We did not find an association between NE or any of its components and hemispheric asymmetry, nor did we find that NE moderated the relation between PE and posterior asymmetry. It is important to note, though, that children were preselected on the basis of their PE scores, not their NE scores. We might have found different results if we selected extreme groups on NE, rather than simply correlating EEG asymmetry and NE (which was normally distributed in our sample). On the other hand, our lack of findings for NE are consistent with the fact that we did not find an association between NE and maternal history of depression (Durbin et al., in press). If NE is a risk factor for depression, this relationship may not emerge until an older age.
The present investigation did not find support for the hypothesis that a frontal asymmetry is associated with PE. There are several possible reasons for this. Frontal asymmetries may be more likely to occur in adult EEG studies because certain areas of the prefrontal cortex that are hypothesized to be related to the approach system (e.g., dorsolateral prefrontal cortex; Davidson et al., 2002) do not fully develop until adolescence. This explanation, however, cannot account for why other studies reported the hypothesized frontal asymmetry in much younger children with a familial risk for depression (Dawson et al., 1999; Field et al., 1995). Moreover, there is no evidence to suggest that the prefrontal cortex has to be fully developed in order to exhibit the hypothesized asymmetry.
Another possible reason for our failure to find a significant frontal asymmetry is that this asymmetry may only be moderately stable (Tomarken, Davidson, Wheeler, & Doss, 1992) and can be influenced by state variables (Blackhart, Kline, Donohue, LaRowe, & Joiner, 2002; Debener, Beauducel, Nessler, Brocke, Heilemann, & Kayser, 2000). It is therefore possible that repeated assessments of resting EEG may be necessary to detect it (Davidson, 1998; Hagemann, Naumann, Thayer, & Bartussek, 2002).4
Although the majority of studies that have looked at the reliability of EEG asymmetry have focused on frontal asymmetries, there is some evidence that the posterior asymmetry is more stable across time (Debener, Beauducel, Nessler, Brocke, Heilemann, & Kayser, 2000) and has slightly better internal consistency (Coan & Allen, 2003) than the frontal asymmetry.
Finally, studies that have found frontal asymmetries in children at risk for depression defined risk as having a parent with depression (Dawson et al., 1999; Field et al., 1995) whereas we defined it on the basis of child temperament.
Previous studies that examined the association between childhood temperament and EEG have focused on frontal asymmetries in children classified as behaviorally inhibited (Davidson & Rickman, 1999; Fox et al., 2001). It is difficult to compare the present results to those studies as the constructs of low PE and high NE both differ from behavioral inhibition. Behavioral inhibition refers to wariness and fearfulness in novel situations (Kagan, 1997). It includes elements of PE (low approach to novel stimuli) and NE (anxiety). However, it differs from low PE in that low PE is evident even in familiar and nonthreatening situations. In addition, high NE is much broader than behavioral inhibition in that it includes anger, sadness, and fear, in situations that are not necessarily novel.
The present study had many strengths. Temperament was assessed through observation of the child during a comprehensive laboratory battery. To confirm the expected properties of alpha power, EEG was recorded while subjects had their eyes open and closed. Although this is standard in adult EEG studies (Pivik et al., 1993), many child EEG studies have not included both conditions, probably due to the difficulty of recording artifact-free data in children and infants. Other strengths included analyzing the data using different reference electrodes (linked ears and Cz).
The present study also had several limitations. First, even though there is evidence to suggest that alpha activity is significantly (negatively) associated with regional cerebral perfusion or positron emission tomography activity (Larson, Davidson, Abercrombie, Ward, Schaefer, Jackson, Holden, & Perlman, 1998), alpha band power may not be an adequate indicator of cortical activity in all regions of the brain. Second, EEG assessments were done at age 5–6, and children were classified as high and low PE at age 3. However, this probably led to an underestimate of the association between EEG and PE. Moreover, the findings remained when the analyses were restricted to children with stable PE scores from age 3 to age 5–6. Third, because we did not find a significant Group × Hemisphere × Region interaction, we cannot conclude that the asymmetry was specific to the posterior region. Fourth, because of the paucity of electrode sites, our discussion is limited to differences in broad regions (e.g., right posterior) rather than specific portions of the brain. Nevertheless, the montage in the present study included more electrodes than are typically used with children.
Finally, it is important to note that the relationship between decreased activity in right posterior regions and low PE may not directly reflect a causal relationship (e.g., EEG asymmetry causes temperament or temperament causes EEG asymmetry). Both variables may be “caused” by a third variable, or they may actually reflect the same process measured at different levels (i.e., the behavioral and electrophysiological; Davidson, 1994; Tomarken, 1999). For example, our findings might be due to asymmetries in neurochemical systems of the brain. There is a great deal of evidence to suggest that the serotonergic system (which projects prominently to posterior regions of the brain) is more lateralized to the right hemisphere (see Wittling, 1995). It is also possible that the relation between temperament and EEG patterns may be mediated by parenting practices (Dawson, Ashman, & Carver, 2000). Regardless of the nature of the association, however, our data are consistent with the hypothesis that both EEG asymmetry and low PE temperament are potential indicators of an underlying liability for depression.
References
REFERENCES
Aiken, L. S., &
West, S. G.
(1991).
Multiple regression: Testing and interpreting interactions.
Thousand Oaks, CA:
Sage.
Ashman, S. B., &
Dawson, G.
(2002).
Maternal depression, infant psychobiological development, and risk
for depression.
In
S. H. Goodman &
I. H. Gotlib (Eds.),
Children of depressed parents: Mechanisms of risk and implications
for treatment
(pp.
37–58).
Washington, DC:
American Psychological Association.
Bandura, A.,
Pastorelli, C.,
Barbaranelli, C., &
Caprara, G.
(1999).
Self-efficacy pathways to childhood depression.
Journal of Personality and Social Psychology
76,
258–269.Google Scholar
Blackhart, G. C.,
Kline, J. P.,
Donohue, K. F.,
LaRowe, S. D., &
Joiner, T. E.
(2002).
Affective responses to EEG preparation and their link to resting
anterior EEG asymmetry.
Personality and Individual Differences
32,
167–174.Google Scholar
Borod, J. C.
(1992).
Interhemispheric and intrahemispheric control of emotion: A focus on
unilateral brain damage.
Journal of Consulting and Clinical Psychology
60,
339–348.Google Scholar
Bruder, G. E.
(2003).
Frontal and parietotemporal asymmetries in depressive disorders:
Behavioral, electrophysiologic and neuroimaging findings.
In
K. Hugdahl &
R. J. Davidson (Eds.),
The asymmetrical brain (pp.
719–742).
Cambridge, MA:
MIT Press.
Bruder, G. E.,
Fong, R.,
Tenke, C. E.,
Leite, P.,
Towey, J. P.,
Stewart, J. E.,
McGrath, P. J., &
Quitkin, F. M.
(1997).
Regional brain asymmetries in major depression with or without an
anxiety disorder: A quantitative electroencephalographic study.
Biological Psychiatry
41,
939–948.Google Scholar
Bruder, G. E.,
Tenke, C. E.,
Warner, V.,
Nomura, Y.,
Grillon, C.,
Hille, J.,
Leite, P., &
Weissman, M. M.
(in press).
Electroencephalographic measures of regional hemispheric activity in
offspring at risk for depressive disorders.
Biological Psychiatry.
Bryden, M. P.,
McManus, I. C., &
Bulmanfleming, M. B.
(1994).
Evaluating the empirical support for the
Geschwind–Behan–Galaburda Model of cerebral
lateralization.
Brain and Cognition
26,
103–167.Google Scholar
Buckley, M. E.,
Klein, D. N.,
Durbin, C. E.,
Hayden, E. P., &
Moerk, K. C.
(2002).
Development and validation of a Q-sort procedure to assess
temperament and behavior in preschool-age children.
Journal of Clinical Child & Adolescent Psychology
31,
525–539.Google Scholar
Coan, J. A., &
Allen, J. J. B.
(2003).
Frontal EEG asymmetry and the behavioral activation and inhibition
systems.
Psychophysiology
40,
106–114.Google Scholar
Clark, L. A., &
Watson, D.
(1991).
Tripartite model of anxiety and depression: Psychometric evidence
and taxonomic implications.
Journal of Abnormal Psychology
100,
316–336.Google Scholar
Clark, L. A.,
Watson, D., &
Mineka, S.
(1994).
Temperament, personality, and the mood and anxiety disorders.
Journal of Abnormal Psychology
103,
103–116.Google Scholar
Cronbach, L. J., &
Meehl, P. E.
(1955).
Construct validity in psychological tests.
Psychological Bulletin
52,
281–302.Google Scholar
Davidson, R. J.
(1994).
Asymmetric brain function, affective style, and psychopathology: The
role of early experience and plasticity.
Development and Psychopathology
6,
741–758.Google Scholar
Davidson, R. J.
(1998).
Anterior electrophysiological asymmetries, emotion, and depression:
Conceptual and methodological conundrums.
Psychophysiology
35,
607–614.Google Scholar
Davidson, R. J., &
Fox, N. A.
(1989).
Frontal brain asymmetry predicts infants response to maternal
separation.
Journal of Abnormal Psychology
98,
127–131.Google Scholar
Davidson, R. J.,
Lewis, D. A.,
Alloy, L. B.,
Amaral, D. G.,
Bush, G.,
Cohen, J. D.,
Drevets, W. C.,
Farah, M. J.,
Kagan, J.,
McClelland, J. L.,
Nolen–Hoeksema, S. &
Peterson,
B. S.
(2002).
Neural and behavioral substrates of mood and mood regulation.
Biological Psychiatry
52,
478–502.Google Scholar
Davidson, R. J., &
Rickman, M. D.
(1999).
Behavioral inhibition and the emotional circuitry of the brain:
Stability and plasticity during the early childhood years.
In
L. A. Schmidt &
J. Schulkin (Eds.),
Extreme fear, shyness, and social phobia: Origins, biological
mechanisms, and clinical outcomes
(pp.
67–87).
New York:
Oxford University Press.
Dawson, G.,
Ashman, S. B., &
Carver, L. J.
(2000).
The role of early experience in shaping behavioral and brain
development and its implications for social policy.
Development and Psychopathology
12,
695–712.Google Scholar
Dawson, G.,
Frey, K.,
Panagiotides, H.,
Osterling, J., &
Hessl, D.
(1997).
Infants of depressed mothers exhibit atypical frontal brain
activity: A replication and extension of previous findings.
Journal of Child Psychology and Psychiatry and Allied
Disciplines
38,
179–186.Google Scholar
Dawson, G.,
Frey, K.,
Self, J.,
Panagiotides, H.,
Hessl, D.,
Yamada, E., &
Rinaldi, J.
(1999).
Frontal brain electrical activity in infants of depressed and
nondepressed mothers: Relation to variations in infant behavior.
Development and Psychopathology
11,
589–605.Google Scholar
Debener, S.,
Beauducel, A.,
Brocke, B., &
Kayser, J.
(2000).
Resting anterior EEG alpha asymmetry and affective style: Effects of
electrode location and reference.
Journal of Psychophysiology,
14,
62.Google Scholar
Debener, S.,
Beauducel, A.,
Nessler, D.,
Brocke, B.,
Heilemann, H., &
Kayser, J.
(2000).
Is resting anterior EEG alpha asymmetry a trait marker for
depression?
Neuropsychobiology
41,
31–37.Google Scholar
Depue, R. A., &
Iacono, W. G.
(1989).
Neurobehavioral aspects of affective disorders.
Annual Review of Psychology
40,
457–492.Google Scholar
Durbin, C. E.,
Klein, D. N.,
Hayden, E. P.,
Buckley, M. E., &
Moerk, K. C.
(in press).
Temperamental emotionality and familial risk for mood disorders in
preschoolers.
Journal of Abnormal Psychology.
Field, T.,
Healy, B.,
Goldstein, S.,
Perry, S.,
Bendell, D.,
Schanberg, S.,
Zimmerman, E. A., &
Kuhn, C.
(1988).
Infants of depressed mothers show depressed behavior even with
nondepressed adults.
Child Development
59,
1569–1579.Google Scholar
Field, T.,
Pickens, J.,
Fox, N. A., &
Nawrocki, T.
(1995).
Relative right frontal EEG activation in 3- to 6-month-old infants
of “depressed” mothers.
Developmental Psychology
31,
358–363.Google Scholar
Fowles, D. C.
(1994).
A motivational theory of psychopathology. In
W. D. Spaulding (Ed.),
Integrative views of motivation, cognition and emotion. Nebraska
symposium on motivation.
(Vol. 41, pp.
181–238).
Lincoln, NE:
University of Nebraska.
Fox, N. A.,
Henderson, H. A.,
Rubin, K. H.,
Calkins, S. D., &
Schmidt, L. A.
(2001).
Continuity and discontinuity of behavioral inhibition and
exuberance: Psychophysiological and behavioral influences across the first
four years of life.
Child Development
72,
1–21.Google Scholar
Fox, N. A.,
Schmidt, L. A.,
Calkins, S. D.,
Rubin, K. H., &
Coplan, R. J.
(1996).
The role of frontal activation in the regulation and dysregulation
of social behavior during the preschool years.
Development and Psychopathology
8,
89–102.Google Scholar
Fredrickson, B. L.
(2001).
The role of positive emotions in positive psychology: The
broaden-and-build theory of positive emotions.
American Psychologist
56,
218–226.Google Scholar
Goldsmith, H. H.,
Reilly, J.,
Lemery, K. S.,
Longley, S., &
Prescott, A.
(1995).
Laboratory Temperament Assessment Battery: Preschool version.
Unpublished manuscript.
Gotlib, I. H.,
Ranganath, C., &
Rosenfeld, J. P.
(1998).
Frontal EEG alpha asymmetry, depression, and cognitive
functioning.
Cognition & Emotion
12,
449–478.Google Scholar
Gray, J. A.
(1994).
Framework for a taxonomy of psychiatric disorder. In
S. H. M. Van Goozen,
N. E. Van de Poll, &
J. A. Sergeant (Eds.),
Emotions: Essays on emotion theory (pp.
29–59).
Hillsdale, NJ:
Erlbaum.
Hagemann, D.,
Naumann, E.,
Thayer, J. F., &
Bartussek, D.
(2002).
Does resting electroencephalograph asymmetry reflect a trait? An
application of latent state–trait theory.
Journal of Personality and Social Psychology
82,
619–641.Google Scholar
Hamburg, S. R.
(1998).
Inherited hypohedonia leads to learned helplessness: A conjecture
updated.
Review of General Psychology
2,
384–403.Google Scholar
Heller, W.
(1990).
The neuropsychology of emotion: Developmental patterns and
implications for psychopathology.
In
N. L. Stein,
B. Leventhal, &
T. Trabasso (Eds.),
Psychological and biological approaches to emotion (pp.
167–211).
Hillsdale, NJ:
Erlbaum.
Heller, W.,
Nitschke, J. B., &
Miller, G. A.
(1998).
Lateralization in emotion and emotional disorders.
Current Directions in Psychological Science
7,
26–32.Google Scholar
Henriques, J. B., &
Davidson, R. J.
(1990).
Regional brain electrical asymmetries discriminate between
previously depressed and healthy control subjects.
Journal of Abnormal Psychology
99,
22–31.Google Scholar
Henriques, J. B., &
Davidson, R. J.
(1991).
Left frontal hypoactivation in depression.
Journal of Abnormal Psychology
100,
535–545.Google Scholar
Hollingshead, A. B.
(1975).
Four Factor Index of Social Status.
Unpublished manuscript.
Jones, N. A.,
Field, T.,
Fox, N. A.,
Davalos, M., &
Gomez, C.
(2001).
EEG during different emotions in 10-month-old infants of depressed
mothers.
Journal of Reproductive and Infant Psychology
19,
295–312.Google Scholar
Kagan, J.
(1994).
Galen's prophecy: Temperament in human nature.
New York:
Basic Books.
Kagan, J.
(1997).
Temperament and the reactions to unfamiliarity.
Child Development
68,
139–143.Google Scholar
Kayser, J.,
Bruder, G. E.,
Tenke, C. E.,
Stewart, J. W., &
Quitkin, F. M.
(2000).
Event-related potentials (ERPs) to hemifield presentations of
emotional stimuli: Differences between depressed patients and healthy
adults in P3 amplitude and asymmetry.
International Journal of Psychophysiology
36,
211–236.Google Scholar
Kayser, J.,
Tenke, C.,
Nordby, H.,
Hammerborg, D.,
Hugdahl, K., &
Erdmann, G.
(1997).
Event-related potential (ERP) asymmetries to emotional stimuli in a
visual half-field paradigm.
Psychophysiology
34,
414–426.Google Scholar
Kentgen, L. M.,
Tenke, C. E.,
Pine, D. S.,
Fong, R.,
Klein, R. G., &
Bruder, G. E.
(2000).
Electroencephalographic asymmetries in adolescents with major
depression: Influence of comorbidity with anxiety disorders.
Journal of Abnormal Psychology
109,
797–802.Google Scholar
Klein, D. N., &
Anderson, R. L.
(1993).
The behavioral high-risk paradigm in the mood disorders. In
G. A. Miller (Ed.),
The behavioral high-risk paradigm in psychopathology (pp.
199–221).
New York:
Springer.
Klein, D. N.,
Durbin, C. E.,
Shankman, S. A., &
Santiago, N. J.
(2002).
Depression and personality. In
I. H. Gotlib &
C. L. Hammen (Eds.),
Handbook of depression (pp.
115–140).
New York:
Guilford Press.
Larson, C. L.,
Davidson, R. J.,
Abercrombie, H. C.,
Ward, R. T.,
Schaefer, S. M.,
Jackson, D. C.,
Holden, J. E., &
Perlman, S. B.
(1998).
Relations between PET-derived measures of thalamic glucose
metabolism and EEG alpha power.
Psychophysiology
35,
162–169.Google Scholar
Longoni, A. M., &
Orsini, L.
(1988).
Lateral preferences in preschool children: A research note.
Journal of Child Psychology and Psychiatry and Allied
Disciplines
29,
533–539.Google Scholar
Meehl, P. E.
(1975).
Hedonic capacity: Some conjectures.
Bulletin of the Menninger Clinic
39,
295–307.Google Scholar
Miller, A.,
Fox, N. A.,
Cohn, J. F.,
Forbes, E. E.,
Sherrill, J. T., &
Kovacs, M.
(2002).
Regional patterns of brain activity in adults with a history of
childhood-onset depression: Gender differences and clinical
variability.
American Journal of Psychiatry
159,
934–940.Google Scholar
Neff, C., &
Klein, D. N.
(1992).
The relationships between maternal behavior and psychopathology and
offspring adjustment in depressed mothers of toddlers.
Paper presented at the Annual Meeting of the Society for
Research in Psychopathology, Palm Springs, CA.
Pell, M. D.
(1999).
The temporal organization of affective and non-affective speech in
patients with right-hemisphere infarcts.
Cortex
35,
455–477.Google Scholar
Pivik, R. T.,
Broughton, R. J.,
Coppola, R.,
Davidson, R. J.,
Fox, N., &
Nuwer, M. R.
(1993).
Guidelines for the recording and quantitative analysis of
electroencephalographic activity in research contexts.
Psychophysiology
30,
547–558.Google Scholar
Pizzagalli, D. A.,
Nitschke, J. B.,
Oakes, T. R.,
Hendrick, A. M.,
Horras, K. A.,
Larson, C. L.,
Abercrombie, H. C.,
Schaefer, S. M.,
Koger, J. V.,
Benca, R. M.,
Pascual–Marqui, R. D., &
Davidson, R. J.
(2002).
Brain electrical tomography in depression: The importance of symptom
severity, anxiety, and melancholic features.
Biological Psychiatry
52,
73–85.Google Scholar
Reid, S. A.,
Duke, L. M., &
Allen, J. J. B.
(1998).
Resting frontal electroencephalographic asymmetry in depression:
Inconsistencies suggest the need to identify mediating factors.
Psychophysiology
35,
389–404.Google Scholar
Schaffer, C. E.,
Davidson, R. J., &
Saron, C.
(1983).
Frontal and parietal electroencephalogram asymmetry in depressed and
nondepressed subjects.
Biological Psychiatry
18,
753–762.Google Scholar
Schmidt, L. A., &
Fox, N. A.
(1994).
Patterns of cortical electrophysiology and autonomic activity in
adults' shyness and sociability.
Biological Psychology
38,
183–198.Google Scholar
Shankman, S. A., &
Klein, D. N.
(2003).
The comorbidity between depression and anxiety: An evaluation of the
tripartite, approach-withdrawal and valence-arousal models.
Clinical Psychology Review
23,
605–637.Google Scholar
Somsen, R. J. M., &
van Beek, B.
(1998).
Ocular artifacts in children's EEG: selection is better than
correction.
Biological Psychology
48,
281–300.Google Scholar
Tellegen, A.
(1985).
Structures of mood and personality and their relevance to assessing
anxiety with an emphasis on self-report.
In
A. H. Tuma &
J. D. Maser (Eds.),
Anxiety and the anxiety disorders (pp.
681–706).
Hillsdale, NJ:
Erlbaum.
Tomarken, A. J.
(1999).
Methodological issues in psychophysiological research. In
P. C. Kendall,
J. N. Butcher, &
G. N. Holmbeck (Eds.),
Handbook of research methods in clinical psychology
(2nd ed., pp.
251–275).
New York:
Wiley.
Tomarken, A. J.,
Davidson, R. J.,
Wheeler, R. E., &
Doss, R. C.
(1992).
Individual differences in anterior brain asymmetry and fundamental
dimensions of emotion.
Journal of Personality and Social Psychology
62,
676–687.Google Scholar
Tomarken, A. J., &
Keener, A. D.
(1998).
Frontal brain asymmetry and depression: A self-regulatory
perspective.
Cognition & Emotion
12,
387–420.Google Scholar
Tucker, D. M.,
Watson, R. T., &
Heilman, K. M.
(1977).
Discrimination and evocation of affectively intoned speech in
patients with right parietal disease.
Neurology
27,
947–950.Google Scholar
von Zerssen, D., &
Akiskal, H. S.
(1998).
Personality factors in affective disorders: Historical developments
and current issues with special reference to the concepts of temperament
and character.
Journal of Affective Disorders
51,
1–5.Google Scholar
Watson, D.,
Wiese, D.,
Vaidya, J., &
Tellegen, A.
(1999).
The two general activation systems of affect: Structural findings,
evolutionary considerations, and psychobiological evidence.
Journal of Personality and Social Psychology
76,
820–838.Google Scholar
Wittling, W.
(1995).
Brain asymmetry in the control of autonomic-physiologic
activity.
In
R. J. Davidson &
K. Hugdahl (Eds.),
Brain asymmetry (pp.
305–357).
Cambridge, MA:
MIT Press.
Characteristics of children classified as low and high positive emotionality (PE)
Hemispheric asymmetries of EEG alpha power by region. The higher the alpha power, the lower the activity; error bars are standard errors.
 You have
Access
- 60
- Cited by