Implications
The metabolic status of dairy cows is hard and expensive to measure. This research shows an interesting potential of mid-IR analysis of milk to provide information on the metabolic status of cows through prediction of blood components. This fast, cost-effective and world spread technology could allow the development of new management and breeding strategies for dairy cows in order to improve health and welfare of cows, as well as income of farmers.
Introduction
Between 30% and 50% of dairy cows suffer from metabolic and infectious diseases around the time of calving (LeBlanc, Reference LeBlanc2010) and ~75% of diseases in dairy cows occur in the first month after calving (Suthar et al., Reference Suthar, Canelas-Raposo, Deniz and Heuwieser2013). The negative energy balance (NEB), experimented by most of the dairy cows, can alter the normal metabolism in the periparturient period and predisposes to metabolic and infectious diseases. Altered energy metabolism induces inflammation (Wathes et al., Reference Wathes, Cheng, Chowdhury, Fenwick, Fitzpatrick, Morris, Patton and Murphy2009), liver damage and dysfunctions (Turk et al., Reference Turk, Juretic, Geres, Turk, Rekic, Simeon-Rudolf and Svetina2004), and impairs hormone regulation (Esposito et al., Reference Esposito, Irons, Webb and Chapwanya2014) as well as immune response (Hammon et al., Reference Hammon, Evjen, Dhiman, Goff and Walters2006; Moyes et al., Reference Moyes, Drackley, Morin, Rodriguez-Zas, Everts, Lewin and Loor2010). This consequently increases the risk of ketosis, milk fever, displaced abomasum, locomotion issues, retained placenta, metritis and mastitis (Collard et al., Reference Collard, Boettcher, Dekkers, Petitclerc and Schaeffer2000; LeBlanc, Reference LeBlanc2010; Esposito et al., Reference Esposito, Irons, Webb and Chapwanya2014). In addition, imbalanced metabolic status can impact uterine health (Hammon et al., Reference Hammon, Evjen, Dhiman, Goff and Walters2006), inhibit luteinizing hormone pulse frequency and reduce IGF-I level in blood (Butler, Reference Butler2000), withal of which can reduce reproductive performance (Esposito et al., Reference Esposito, Irons, Webb and Chapwanya2014).
On dairy farms, problems associated with an imbalanced metabolic status can be a major source of economic losses. For example, McArt et al. (Reference McArt, Nydam and Overton2015) estimate that the averaged total cost per case of hyperketonemia was $289. Considering the high incidence and the cost of such problems, there is a clear interest to have information on the metabolic status of cows during the postpartum period. For example, this information could allow the development of breeding or management strategies to limit the costs associated with the negative impacts of imbalanced metabolic status.
The blood contents of some metabolites and hormones in plasma are used as key indicators of the metabolic status of cows. Among them, glucose, non-esterified fatty acids (NEFA) and β-hydroxybutyrate (BHB) have been identified as the major metabolites related to the degree of physiological imbalance (Ingvartsen et al., Reference Ingvartsen, Dewhurst and Friggens2003; Ingvartsen, Reference Ingvartsen2006). Glucose is an important substrate for mammary metabolism and lactose synthesis (Bell and Bauman, Reference Bell and Bauman1977). Providing sufficient amounts of glucose to the mammary gland is necessary to enable high milk production (Drackley et al., Reference Drackley, Overton and Douglas2001). It has been identified by Bjerre harpoth et al. (Reference Bjerre-Harpøth, Friggens, Thorup, Larsen, Damgaard, Ingvartsen and Moyes2012) and Moyes et al. (Reference Moyes, Larsen and Ingvartsen2013) as an important metabolite in link with metabolic imbalance. When the glucose demand exceeds the gluconeogenesis capacity of the liver due to NEB, the glucose concentrations in blood decreases and the use of glucose as energy is reduced (Ingvartsen, Reference Ingvartsen2006; Esposito et al., Reference Esposito, Irons, Webb and Chapwanya2014). Insufficient blood glucose level induces the use of fat as an alternate fuel source, leading to body reserve mobilization, which is reflected by an increase in blood NEFA concentration (Leblanc, Reference LeBlanc2010; Esposito et al., Reference Esposito, Irons, Webb and Chapwanya2014). When the supply of NEFA overloads the liver, NEFA degradation products are diverted to produce ketone bodies (Esposito et al., Reference Esposito, Irons, Webb and Chapwanya2014). Among the ketone bodies, BHB has been identified as a successful biomarker for ketosis (Suthar et al., Reference Suthar, Canelas-Raposo, Deniz and Heuwieser2013; McArt et al., Reference McArt, Nydam and Overton2015). Complementary to these blood metabolites, IGF-I has been highlighted as a biomarker of altered liver metabolic status (Fenwick et al., Reference Fenwick, Llewellyn, Fitzpatrick, Kenny, Murphy, Patton and Wathes2008). When the liver is impacted because of NEB, expression of key genes involved in synthesis and stability of IGF-I is altered which leads to a decrease of IGF-I level in the blood (Wathes et al., Reference Wathes, Fenwick, Cheng, Bourne, Llewellyn, Morris, Kenny, Murphy and Fitzpatrick2007). It is therefore useful to have information on glucose, NEFA, BHB and IGF-I contents separately. However, as they provide complementary information on metabolic status, the ideal phenotype to predict would be a combination of these components in order to globally evaluate the metabolic status of cows.
To predict the metabolic status of cows at a farm scale, biomarkers should be easily accessible and hence assessed in milk. Among the potential milk biomarkers, the Fourier transform mid-IR (FT-MIR) spectra of milk is a promising candidate. These spectra are composed by absorbance values resulting from interaction between chemical bonds and mid-IR light at different wavenumbers (Gengler et al., Reference Gengler, Soyeurt, Dehareng, Bastin, Colinet, Hammami, Vanrobays, Lainé, Vanderick, Grelet, Vanlierde and Froidmont2016). It can therefore be considered as a ‘mirror’ of fine physico-chemical properties of milk. This fast and cost-effective technology is currently available in many countries.
Previous studies focused on predicting the energy status of cows via feed related variables such as energy balance, residual feed intake or dry matter intake (McParland et al., Reference McParland, Banos, Wall, Coffey, Soyeurt, Veerkamp and Berry2011 and Reference McParland, Lewis, Kennedy, Moore, McCarthy, O’Donovan, Butler, Pryce and Berry2014; Shetty et al., Reference Shetty, Løvendahl, Lund and Buitenhuis2017). However, the NEB is likely to impacts differently the dairy cows following their resilience and their ability to cope with this imbalance (Herdt, Reference Herdt2000), and is therefore not giving exact information on the metabolic status. Others studies provided information on the metabolic status through milk metabolites, such as acetone, BHB or citrate (de Ross et al., Reference de Roos, van den Bijgaart, Hørlyk and de Jong2007; Grelet et al., Reference Grelet, Bastin, Gelé, Davière, Johan, Werner, Reding, Fernandez Pierna, Colinet, Dardenne, Gengler, Soyeurt and Dehareng2016). However, there is a lack of information available in the literature about the direct prediction of key blood components related with metabolic status. To our knowledge, only few studies attempted to predict blood BHB concentrations from the milk FT-MIR spectra, and reached, respectively, R 2 of calibration of 0.54 (Broutin, Reference Broutin2015) and R 2 of validation of 0.43 (Belay et al., Reference Belay, Dagnachew, Kowalski and Ådnøy2017). Gelé et al. (Reference Gelé, Ferrand-Calmels, Brun-Lafleur, Werner and Gollé-Leidreiter2015) focused to estimate the ketosis risk by combining blood NEFA and BHB and obtained a sensitivity of 81% and a specificity of 69%. The possibility to use milk FT-MIR spectra to predict the key blood metabolites and hormones linked with an imbalanced metabolic status separately, as well as the potential combination of these variables into a global metabolic status of cows still need to be investigated. This work aims to (1) confirm the possibility to predict blood BHB using FT-MIR spectra of milk, (2) evaluate the potential of milk FT-MIR spectra to predict individually blood glucose, IGF-I and NEFA, and (3) to evaluate the possibility to predict the metabolic status of cows based on the clustering of these blood components.
Material and methods
Sampling and registration protocol
The data in this study were collected as a part of Work Package 3 from the Genotype plus Environment (GplusE) FP7-Project (http://www.gpluse.eu). Common sampling and registration protocols were followed in six experimental herds: AFBI (Agri-Food and Biosciences Institute, UK), Aarhus University (Denmark), CREA (Research Center for Animal Production and Aquaculture, Italy), CRA-W (Walloon Agricultural Research Centre, Belgium), FBN (Leibniz Institute for Farm Animal Biology, Germany) and UCD (University College Dublin, Ireland). A total of 241 cows, with parities ranging from 1 to 7, were sampled. Cows were sampled from 1 to 50 days in milk (DIM). Information on the number of cows sampled in each experimental herd, parity and the forage type offered is shown in Table 1.
Overview of cows sampled and forage type offered within the study

n Cows=number of cows sampled; n PP=number of primiparous cows sampled, n MP=number of multiparous cows sampled; MY=mean daily milk yield during days 1 to 50 post calving; AFBI=Agri-Food and Biosciences Institute, UK; AU=Aarhus University, Denmark; CREA=Research Center for Animal Production and Aquaculture, Italy; CRA-W=Walloon Agricultural Research Centre, Belgium; FBN=Leibniz Institute for Farm Animal Biology, Germany; UCD=University College Dublin, Ireland.
Blood analysis
For each of the 241 cows, two blood samples were collected postpartum. One sample was taken at 14 DIM to reflect the physiological status in the transition period without being influenced by calving per se. The second sample was taken at 35 DIM when milk yield and nutrient needs should be close to maximum. Samples were collected in tubes with heparin or serum clot activator, and centrifuged at 2500 g for 10 min to harvest plasma and serum. Samples were stored at −20°C, with plasma subsequently analyzed at Aarhus University for metabolites (glucose, NEFA and BHB) and serum at UCD for IGF-I. Glucose was determined according to standard procedures by Siemens Diagnostics® (Clinical Methods for ADVIA 1800), whereas NEFA were determined using the Wako, NEFA C ACS-ACOD assay method. β-Hydroxybutyrate was determined by measuring absorbance at 340 nm due to the production of NADH at alkaline pH in the presence of BHB dehydrogenase. Concentrations of IGF-1 were determined using a radioimmunoassay following acid–ethanol extraction using the method previously described by Beltman et al. (Reference Beltman, Forde, Furney, Carter, Roche, Lonergan and Crowe2010).
Clustering
The approach consists of the creation of differentiated ‘metabolic status’ of cows by applying a clustering method on the blood components of interest. This methodology has been developed by Salavati and Genotype plus Environment Consortium (Reference Salavati2017). A new set of phenotypes was defined by k-means clustering based on actual observations for each of plasma glucose, plasma BHB, plasma NEFA and serum IGF-I. Beforehand, a logarithmic 10 transformation was applied to IGF-I, NEFA and BHB to normalize distributions and all the variables were mean-centered across the two sampling period (DIM14 and DIM35). K-means clustering groups data following Euclidian distances between samples and centre of clusters. The balance between cohesion within clusters and a reasonable number of groups was obtained with three or four groups. Considering both physiological interpretations and better results obtained when developing FT-MIR models, only the three groups clustering is presented in this work. The clustering was realized jointly for the primiparous and the multiparous cows (ALL). Primiparous and multiparous cows were also separated to realize specific clustering on the two data sets (PP) and (MP).
Fourier transform mid-IR analysis of milk
Twice weekly, AM and PM representative milk samples of the whole milking were collected for each cow with ICAR approved milk recording devices (Afi-Lite Pro, Afimilk Israel). The samples were preserved at 4°C with bronopol 0.02%. Analyses were conducted locally on FT2 and FT6000 spectrometers (Foss, Hillerød, Denmark) or at CRA-W (Belgium) by a Standard Lactoscope FT-MIR automatic (Delta Instruments, Drachten, The Netherlands). Morning and evening spectra were combined into a daily spectrum by a weighted average taking into account the AM and PM milk yields. The spectra of the different instruments were standardized to be merged into a common data set following the procedure described in Grelet et al. (Reference Grelet, Fernández Pierna, Dardenne, Baeten and Dehareng2015).
Mid-IR models development
The distribution of NEFA and BHB were not normally distributed, with a higher proportion of low values. The distribution of these two components was edited in order to artificially normalize the distribution by a random removing of low value (Grelet et al., Reference Grelet, Bastin, Gelé, Davière, Johan, Werner, Reding, Fernandez Pierna, Colinet, Dardenne, Gengler, Soyeurt and Dehareng2016). In addition, a logarithmic (base 10) transformation was tested on reference values of these two components in order to approach a normal distribution. The reference values were merged to the closest spectra in time, based on the sampling date, within a limit of 2 days. Practically, 84% of reference values were merged with the spectra of the same day or ±1 day and only 16% were merged with the spectra of ±2 day. As pretreatment of FT-MIR spectra, a first derivative was used with a gap of five wavenumbers. The spectral areas selected were constituted by 212 wavenumbers from 968.1 to 1577.5 cm−1, 1731.8 to 1762.6 cm−1, 1781.9 to 1808.9 cm−1 and 2831.0 to 2966.0 cm−1. These areas were selected to exclude noisy parts of the spectrum induced by water and areas not repeatable among different instruments after analysis of common samples (Grelet et al., Reference Grelet, Bastin, Gelé, Davière, Johan, Werner, Reding, Fernandez Pierna, Colinet, Dardenne, Gengler, Soyeurt and Dehareng2016). Parity and corresponding daily milk yield (l/cow) were included with spectra as predictors in models. The predictors were mean-centred to equally scale spectral and additional data. These pretreatments were carried out with programs developed in Matlab v9.3.0 (The Mathworks, Inc., Natick, MA, USA). Quantitative models predicting blood components were developed using modified partial least squares regression with Winisi software (Foss, Hillerød, Denmark). Discriminant models aiming to differentiate the global metabolic status were developed with partial least squares discriminant analysis (PLS-DA) with the PLS toolbox v. 8.5.1 (Eigenvector Research, Inc.,Wenatchee, WA, USA). Models were developed to predict the metabolic status of animals based on ALL cows data set, but also to predict the specific clustering of the PP or the MP cows. In the quantitative models, samples with residuals higher than 2.5 times the SD of the global residuals were considered as outliers (Rousseeuw et al., Reference Rousseeuw, Debruyne, Engelen and Hubert2006). This is performed as a security step to exclude potential biased data due to issues with sampling, sample conservation and analysis. Data sets were too small to perform an external validation. Indeed, splitting data from a reduced initial data set underestimate the performances of the model because both calibration and validation data sets contain a low number of samples covering few and different information (Bagby et al., Reference Bagby, Parker and Taylor1994); information being spectral variability due to different cows, lactation stages and feeding systems in the current work. Moreover, this work is a preliminary step aiming to evaluate the potential of FT-MIR spectra of milk to predict the variables of interest and not to develop a robust model to be used in routine conditions. The models were tested using cross-validation with four subsets randomly constituted, both for quantitative and discriminants models. The statistics of the quantitative models, in both calibration and cross-validation steps, were expressed in terms of R 2 (determination coefficient), RMSE and ratio performance/deviation. The statistics of the discriminant models were expressed in terms of sensitivity (percentage of classification into the good cluster), specificity (percentage of the others clusters to be predicted as others clusters) and global accuracy (global percentage of correct classification).
Results and discussion
Blood component models
After merging the blood reference values with the milk spectral data, the milk yields and parity information, missing data meant that the size of the final merged data sets were 380 for glucose, NEFA and BHB, and 387 for IGF-I. Descriptive statistics of the initial data set are shown in Table 2. It can be considered that 41% of the cows mobilize body reserves highly with plasma NEFA above the critical threshold of 0.57 mEq/l (Ospina et al., Reference Ospina, Nydam, Stokol and Overton2010). Only 8% of the cows are in (sub)clinical ketosis with BHB above 1.2 mmol/l (Duffield et al., Reference Duffield, Kelton, Leslie, Lissemore and Lumsden1997). Artificial modification of NEFA and BHB distribution reduced the number of data to 234 and 205, respectively. The exclusion of samples with residuals higher than 2.5 times the SD of the global residuals leads to removing of 10, 8, 4 and 7 outliers which represents 3%, 2%, 2% and 3% of the data for glucose, IGF-I, NEFA and BHB, respectively. Logarithmic transformation of the reference values improved only the performances of BHB model and was not retained for final NEFA model. In the current study, the best models for glucose, IGF-I and NEFA were obtained with the addition of the milk yield and parity as predictors with the FT-MIR spectra of milk, but the improvements were limited. The addition of these variables did not improve the BHB model. This seems to be an artefact due to a slight difference in the outlier removing as the addition of variables containing complementary information should theoretically bring more precision to the model.
Descriptive statistics of the initial blood composition data set

NEFA=non-esterified fatty acids; BHB=β-hydroxybutyrate.
Glucose, NEFA and BHB analyzed in plasma and IGF-I analyzed in serum of dairy cows.
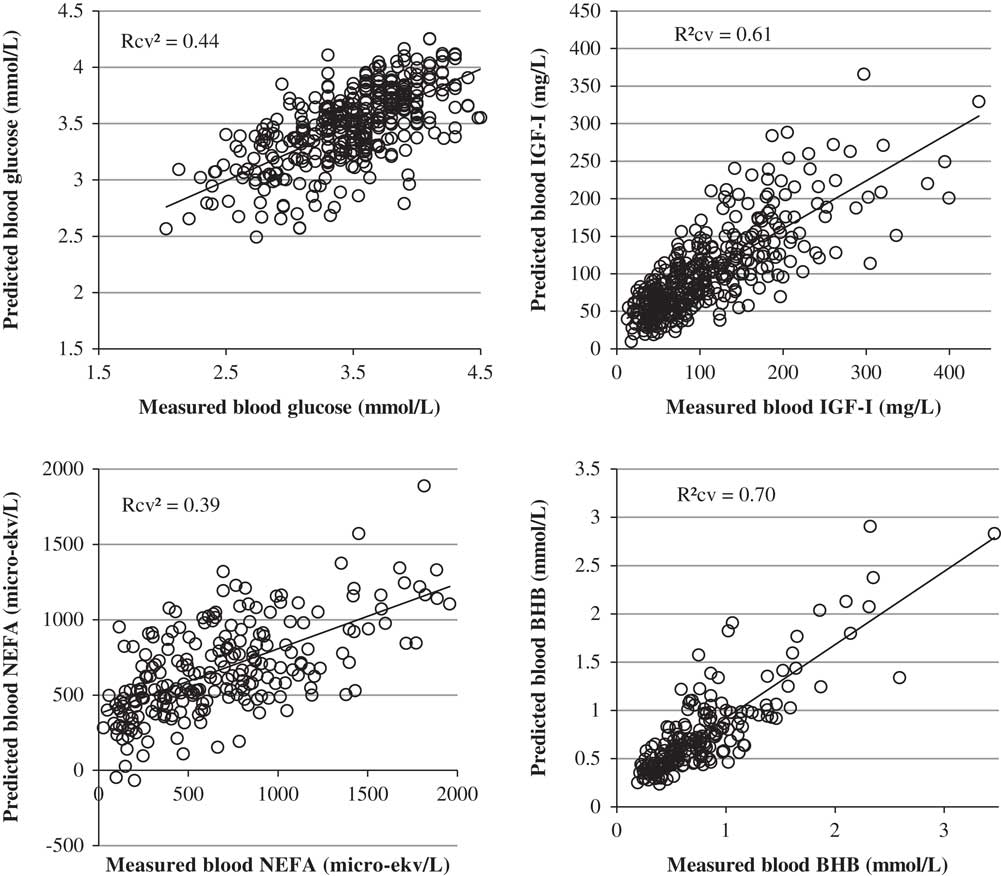
Statistical performances of the best milk FT-MIR models are described in Table 3. Models predicting glucose and NEFA show relatively low performances, with R 2cv of 0.44 and 0.39 and RMSEcv of 0.36 mmol/l and 344.2 µekv/l, respectively. These RMSEcv, being the averaged errors of prediction, represent accuracies of the models. When expressed as a percentage of the mean they show relative accuracies of 10% and 51% for glucose and NEFA, respectively. Hence, for an equivalent R 2cv, these two models are extremely different in terms of accuracy. In contrast to the NEFA model, the glucose model is fairly precise and the relatively poor R 2cv is probably impacted by a low variability regarding the reference values (Davies and Fearn, Reference Davies and Fearn2006). Additional relevant data covering complementary variability could potentially improve the performances of the model. The poor accuracy of the NEFA model is surprising as there are identified links between NEB and milk composition, through the C18:1cis-9 fatty acid particularly (Bastin et al., Reference Bastin, Gengler and Soyeurt2011). Hypothesis explaining this could be a physiological or time-dependent discrepancy between the milk composition and the NEFA level in blood or the low number of samples as well as an insufficient precision of the reference method.
Statistical performances of the quantitative models predicting blood components from mid-IR milk spectra of dairy cows

n=number of samples used; LV=number of latent variables in the model; RMSE=root mean square error of calibration; R 2=coefficient of determination of calibration; RMSEcv=root mean square error of cross-validation; R 2cv=coefficient of determination of cross-validation; RPDcv=ratio SD of calibration/RMSEcv; MIR=mid-IR spectra of milk; MY=daily milk yield; PAR=parity of the cow; NEFA=non-esterified fatty acids; BHB=β-hydroxybutyrate.
The models predicting IGF-I and BHB show more interesting statistical performances, with respective R 2cv of 0.61 and 0.70 and RMSEcv of 44.4 mg/l and 0.27 mmol/l. These RMSEcv, when expressed as percentage of the means, expressed relative accuracies of 42% and 35%, respectively. These models are consequently not appropriate to provide accurate quantitative values, but the high R 2cv indicate that they globally fit well with the reference values along the distribution, meaning that they could potentially be used to distinguish low and high values. Figure 1 shows the relation between the reference values and the values predicted by FT-MIR models. From these graphs, we observe that both IGF-I and BHB models are more precise in the range of the low values than in the range of high values. The imprecision in the range of high values, which is probably due to the over representation of the low contents in data sets distribution, can be circumvented by classifying the predictions using a threshold. When using the classical threshold of 1.2 mmol/l with the BHB model, 96% of the low values are predicted low by the model and 63% of the high values are predicted high, leading in a global accuracy of 91%. This lends weight to the use of these models for discriminating low and high IGF-I and BHB contents.
Plot of blood (a) glucose, (b) IGF-I, (c) NEFA and (d) β-hydroxybutyrate (BHB) values predicted from mid-infrared spectra of cow milk, in cross-validation, against measured values. NEFA=non-esterified fatty acids; BHB=β-hydroxybutyrate.

Previous studies already focused on the prediction of blood BHB using the milk FT-MIR spectra. Broutin (Reference Broutin2015) obtained a R 2 of calibration of 0.54 and a standard error of calibration of 0.39 mmol/l. He concludes that this accuracy is sufficient for the potential and systematic routine detection of ketosis during milk testing. In another study, Belay et al. (Reference Belay, Dagnachew, Kowalski and Ådnøy2017) obtained an R 2cv of 0.38 and an R 2 of validation of 0.43. They conclude the model may allow rough screening to distinguish cows with high or low blood BHB content. The higher accuracy of the model obtained in the current study could be attributed to the merging of datasets from six farms, providing more variability regarding BHB values and spectral data. This was possible due to the step of spectral standardization.
Regarding that the prediction of blood components from the milk composition is inevitably indirect, meaning that the blood composition does not affect the interaction between milk and light, the results obtained in this study can be considered satisfactory. The performances of the developed models, especially for IGF-I and BHB, could allow the screening of individual milk samples for high or low values. Given that the data set being relatively small, with samples coming from only six farms, it could be possible to improve the results and the robustness by adding additional variability both in terms of reference values and in spectral variability.
Clusters discrimination
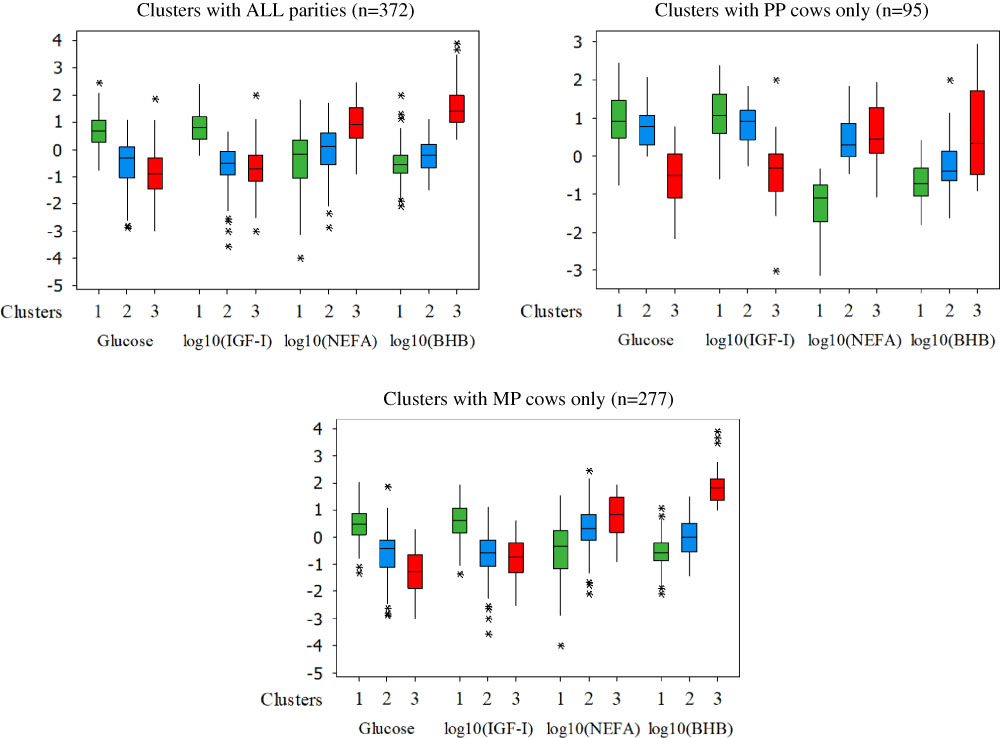
Figure 2 reports, respectively, the distribution of blood metabolites and hormones following the clusters developed with the three data sets: ALL cows, PP only and MP only. The obtained clusters were physiologically consistent. For the three data sets, cluster 1 is characterized by high glucose and IGF-I and low NEFA and BHB contents in comparison with the other groups. This cluster is therefore clearly grouping the cows with ‘healthy’ metabolic status. In the same way, for the three data sets, the cluster 3 is characterized by low glucose and IGF-I and high NEFA and BHB blood contents. Those characteristics reflect reduced energy circulating in the blood, altered liver metabolism, mobilization of body reserves and production of ketone bodies. This cluster is grouping the cows with ‘imbalanced’ metabolic status. The cluster 2 is grouping cows with intermediate or ‘moderately impacted’ metabolic status, having altered circulating energy reserves and liver metabolism, mobilizing fat reserves but not showing production of ketone bodies as in the cluster 3. The clustering from the entire reference data set resulted in 45% of cows with healthy metabolic status, 39% with moderately impacted metabolic status and 16% of cows with imbalanced metabolic status. This classification is, respectively, 36%, 45% and 19% when clustering the primiparous cows and 41%, 47% and 12% when clustering the multiparous cows only.
(Colour online) Distribution of the blood components regarding the metabolic status clusters created with all parities (ALL), primiparous only (PP) and multiparous only (MP). Cluster 1 (green), cluster 2 (blue) and cluster 3 (red) are grouping cows with healthy, moderately impacted and imbalanced metabolic status cows, respectively. NEFA=non-esterified fatty acids; BHB=β-hydroxybutyrate; *, **, ***=number of outliers not included in the quartiles representation.

Partial least squares discriminant analysis models were developed to discriminate the metabolic status of cows within the three data sets, with FT-MIR spectra of milk as predictor only, or with addition of MY and parity. Table 4 shows the confusion matrix from the discrimination of the three metabolic groups within the data set containing ALL cows, in the cross-validation step, and using FT-MIR spectra of milk, milk yield and parity as predictors. Sensitivity and specificity are, respectively, around 77% and 88% for both cows with healthy and imbalanced metabolic status, which are the extreme clusters. Classification of cows with moderately impacted metabolic status is less performant, with sensitivity of 68% and specificity of 84%. This seems logical as the impact of this intermediate status is less likely to be ‘marked’ into the milk composition than the extreme status. The global accuracy, meaning the percentage of correct classification, is 74%. The misclassification between concomitant groups, for example, between healthy and moderately impacted status or between moderately impacted and imbalanced status, represents 22% of the data and only 4% of cows are extremely misclassified, for example, between healthy and imbalanced.
Confusion matrix from the discrimination of the three metabolic status clusters developed with dataset containing all cows, in the cross-validation step, and using mid-IR spectra of milk, milk yield and parity as predictors

From a management point of view, an interesting metabolic status to discriminate is the imbalanced one as it directly increases risks of metabolic or reproductive disorders. Table 5 shows the cross-validation results of the PLS-DA model discriminating the imbalanced cows from the healthy and the intermediate cows, based on the clusters developed with ALL data set and using FT-MIR spectra of milk, milk yield and parity as predictors. Imbalanced cows are discriminated with a sensitivity of 76% and a specificity of 89%, leading to a global accuracy of 87%.
Confusion matrix from the discrimination of the cows with imbalanced status, from clusters developed with all parities, in the cross-validation step, and using mid-infrared spectra, milk yield and parity as predictors

Table 6 summarizes the global accuracies of the PLS-DA models discriminating the three clusters or the imbalanced cows only, for the three data sets (ALL, PP and MP), and using only the milk FT-MIR spectra as predictor, or in combination with milk yield and parity data. In all cases, the addition of milk yield and parity information improved, even slightly, the performances of the models, which implies these factors may influence the metabolic status of cows. The discrimination of the three clusters by PLS-DA models allows to fairly classify the three groups, with a global accuracy up to 74% obtained when using the clustering with ALL cows. When trying to discriminate the cows with imbalanced status from the cows with healthy or moderately impacted status, the models succeed to distinguish this group with good accuracies. The percentage of correct classification reaches 87%, 92% and 88%, respectively, with ALL, PP and MP cows when milk yield is added as predictor. Model accuracy is consequently better when developing specific models only for the PP or for the MP cows instead of using ALL cows. The impact of NEB on blood levels of IGF-I, NEFA and BHB is known to be different in the weeks after calving between PP and MP cows (Wathes et al., Reference Wathes, Fenwick, Cheng, Bourne, Llewellyn, Morris, Kenny, Murphy and Fitzpatrick2007). It is consequently logical to obtain a better discrimination when developing specific models for primiparous or multiparous cows, and removing by this way the natural differences between PP and MP. However, this can affect the robustness of the models by reducing the data size and consequently the intrinsic variability of each data sets.
Summary of the global accuracies of cows clusters discrimination in cross-validation step

LV=number of latent variables in the model; ALL=models developed with all cows; PP only=models developed with primiparous cows only; MP only=models developed with multiparous cows only; MIR=mid-IR spectra of milk; MY=daily milk yield; PAR=parity of the cow
It is therefore possible to use clustering methods to group blood data into a global metabolic status information making physiologically sense and to discriminate these statuses by combining FT-MIR analysis of milk and multivariate discriminant models. The level of good classification obtained by these models could allow to routinely fairly classify cows with healthy, moderately impacted or imbalanced metabolic status, and to discriminate cows with imbalanced status with a good accuracy.
Perspectives and limitations
The results of this study show that FT-MIR spectra of milk has potential to predict blood glucose, IGF-I and NEFA, and confirms its ability to predict blood BHB with reasonable accuracy. Although the quantitative models developed were not able to provide precise quantitative values, they can discriminate between high and low values. The results also demonstrate that these blood-related variables can be merged into a global metabolic status information, which can be predicted through the FT-MIR spectra of milk. The discriminant models developed in this research allow the classification of cows with healthy, moderately impacted or imbalanced metabolic status with reasonable accuracy, and to discriminate cows with imbalanced status with a good accuracy.
The performances were satisfactory, thereby allowing the use of these variables as novel biomarkers potentially useful at large scale for management and breeding of dairy cows. Indeed such indicators can be used to facilitate decision making on farm as soon as management strategies and solutions are highlighted to reduce economic losses (Ettema et al., Reference Ettema and Østergaard2006). Genomic studies need large scale and easily accessible phenotypes. The FT-MIR instruments dedicated to milk are present in many countries so the developed models can be used to generate these phenotypes currently not available at large scale. The individual blood component models are not highly accurate but Gengler et al. (Reference Gengler2017) demonstrate that even low accuracy milk MIR based biomarkers can become useful in the context of animal breeding.
The models have been developed with relatively small data sets, especially for blood NEFA and BHB for which the distributions have been edited. Moreover, even though the data were derived from different countries and from cows offered different diets, they represent only six farms, all with Holstein cows, and only during the period from calving to DIM 50. As the models do not contain a lot of variability regarding breeds, diets and geographical origin they are not expected to be really robust, meaning that the results could be biased when applying the models with others breeds or diets than those present in the study. For the same reasons the current models should preferably be applied within the period from calving to DIM 50, which is nonetheless the period of interest regarding metabolic status. Consequently, in order to apply the models in routine at a larger scale, they should be improved with data derived from other regions or containing different specificities. The data set was also too small to perform an external validation, which is the gold standard to evaluate robustness and performances of models. Test of model through cross-validation is known to slightly overfit the results compared with real external validation. An external validation step is planned in a later phase of the EU GplusE project and will allow the evaluation of the models with data coming from commercial farms. In this study, metabolites and hormones used for clustering were selected based on literature and further work is needed to determine the relationship between clusters and energy balance as well as productive and reproductive performances of dairy cows. In the current work, the blood variables and clusters were associated with the closest spectra in time, with a limit of 2 days. However, these parameters are susceptible to vary from day to day but also during the day, which makes the time association between spectra and variables sub-optimal due to a lack of data. Further work would be necessary to optimize the time association between blood composition and milk spectra. A complementary study from the same project (De Koster et al., Reference de Roos, van den Bijgaart, Hørlyk and de Jongsubmitted) created a random sampler to select one sample per animal from 1 to 50 DIM. This allows to constitute the calibration data set by simulating an official milk recording, associating the status of cows to a FT-MIR spectra sampled at random stages in lactation on a given day.
The models were developed with FT-MIR spectra collected on instruments participating to a global standardization process. This harmonization of spectrometer spectral responses within a network allows the transfer of FT-MIR models, even with limited robustness, on all the standardized instruments (Grelet et al., Reference Grelet, Fernandez Pierna, Dardenne, Soyeurt, Vanlierde, Colinet, Bastin, Gengler, Baeten and Dehareng2017). Consequently, it will be possible to apply these models on all the standardized instruments of the milk recording organizations being partners of the project in order to provide information on metabolic status at large scale.
Acknowledgements
The authors gratefully thank Francois Rouelle, Maxence Didelez, Claire Darimont, Petimat Kitaeva and Olivier Genard for their precious work on sampling or chemical analysis. This project has received funding from the European Union’s Seventh Framework Programme for research, technological development and demonstration under grant agreement no. 613689. The views expressed in this publication are the sole responsibility of the authors and do not necessarily reflect the views of the European Commission.
Declaration of interest
There is no direct financial interest of the authors and affiliations in the subject matter discussed in the manuscript.
Ethics statement
The experiments were carried out in accordance with the EU Directive 2010/63/EU for animal experiments.
Software and data repository resources
None of the data were deposited in an official repository.