INTRODUCTION
Approximately one-third of the earth's surface area is characterized by hyper-arid, arid and semi-arid climates, according to estimates from the bioclimatic aridity zoning of world dry-lands (Le Houérou Reference Le Houérou1996). In these regions, water for cattle is derived mainly from boreholes, dugouts, ponds or wells and generally has high salt content, which is a factor that may have a negative impact on animal performance and health (Weeth & Hunter Reference Weeth and Hunter1971; Beke & Hironaka Reference Beke and Hironaka1991). It has been reported that water from deep wells may exhibit a high salt concentration when it originates from marine shale, while dugouts and ponds are recharged mostly from surface water runoff or groundwater that contain variable amounts of dissolved substances (Willms et al. Reference Willms, Kenzie, McAllister, Colwell, Veira, Wilmshurst, Entz and Olson2002). Furthermore, Herczeg et al. (Reference Herczeg, Simpson and Mazor1993) speculated that this type of water arises from inputs of dissolved salts (i.e. sodium (Na), magnesium (Mg), calcium (Ca), sulphate (SO4), chloride (Cl–), potassium (K) and bicarbonate (HCO3–)) from the ocean through atmospheric transport and evaporation of surface water.
Currently, utilization of saline water for livestock has raised much interest, mainly due to the limited availability of water globally, as well as environmental concerns related to pollution of water resources. Substantial benefits could be realized should a greater proportion of natural groundwater and surface water be available for addressing farm demands, since climate models project that in some regions, such as the Mediterranean Basin, western United States, southern Africa and north-eastern Brazil, precipitation will continue to decrease and impact natural water supplies negatively (Bates et al. Reference Bates, Kundzewicz, Wu and Palutikof2008).
Generally, water samples that contain concentrations higher than 1000 mg/l total dissolved salts (TDS) are considered as saline, whereas those with TDS content >7000 mg TDS/l should be avoided. However, water with a concentration <3000 mg TDS/l may be classified as satisfactory drinking water for livestock (NRC 2001). Efforts to evaluate high-saline water ingestion on the basis of its effects on animal performance have been scarce and results have often been inconsistent. Feed intake and performance were either decreased (Weeth et al. Reference Weeth, Haverland and Cassard1960; Jaster et al. Reference Jaster, Schuh and Wegner1978; Solomon et al. Reference Solomon, Miron, Ben-Ghedalia and Zomberg1995) or unaffected (Bahman et al. Reference Bahman, Rooke and Topps1993; Sanchez et al. Reference Sanchez, McGuire and Beede1994; Phillips et al. Reference Phillips, Mohamed and Chiy2015) as drinking water containing high concentrations of dissolved salts was offered to livestock.
Therefore, the current study was undertaken to determine how increasing concentrations of TDS (in mg/l) in drinking water influence performance (dry matter intake (DMI), average daily gain (ADG) and feed:gain), diet digestibility, microbial protein synthesis, nitrogen (N) and water balance in heifers.
MATERIALS AND METHODS
General information
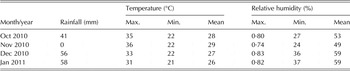
The current experiment ran from October 2010 to January 2011 at the Semi-arid Experimental Station of the Brazilian Agricultural Research Corporation (EMBRAPA) in the municipality of Petrolina, Pernambuco State, Brazil (09°09′S, 40°22′W, 365 m a.s.l.). The climate is typically semi-arid with an annual rainfall of 570 mm and average maximum and minimum temperatures of 33 and 20 °C, respectively. Low relative humidity and precipitation and high temperatures characterized the experimental period (Table 1).
Meteorological data during the experimental period

Source: Agro meteorological station in the Experimental Area of Bebedouro, Embrapa Semiarid – Petrolina – Pernambuco State, Brazil.
Dietary treatments
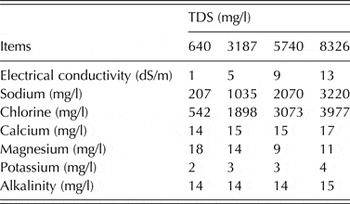
Clean water was pumped from EMBRAPA's supply system and stored in the 500-litre storage tanks, which were then isolated with a lid to minimize light and evaporation and to moderate water temperatures. Using this water, treatments were formulated every 2 days by adding sodium chloride (NaCl) until reaching saline concentrations of 640, 3187, 5740 and 8326 mg TDS/l (Table 2), determined and monitored continuously by a portable conductivity meter (Handheld metre 315i model, Weilheim, Oberbayern, Germany). Treatments were then homogenized manually and transferred from the 500-litre tanks to 15-kg water pails, and replenished and metred three times a day (at 08·00, 12·00 and 15·30 h) in order to determine daily drinking water consumption. The saline water concentrations of the current study were selected according to the results of NRC (2001) that reported negative effects of salty water on DMI. Sodium chloride was added to drinking water to increase the TDS concentrations because this element is found in abundance in groundwater and wells of the Brazilian semi-arid region, where the current study was completed (de Lima et al. Reference de Lima, do Nascimento, Guilera, Brandão, Lopes Neto and Feitosa2008).
Electrical conductivity, chemical composition and alkalinity of saline drinking water containing increasing concentrations of total dissolved salts (TDS)

Drinking water intake (in l/day) was measured individually and calculated as saline water offered ad libitum (l/day) to the animals – (saline water orts (l/day) + evaporation (l/day)). Daily water loss by evaporation (in l/day) was measured, since saline water was exposed to evaporation in areas adjoining the metabolism pens, such that the initial measure of saline water contained in pails was subtracted from its final measure after a 24-h period.
Total water intake (in l/day) was also measured individually and calculated as drinking water intake (l/day) + water ingested through the feeds (l/day) per individual animal. About 100 g each of food given and refusals were taken daily from each heifer and oven dried at 65 °C for 72 h to determine water consumption through the feeds.
Retained water (in l/day) was calculated as (total water intake (l/day)) – (water excreted through the faeces (l/day) and urine (l/day)).
Weekly, water samples (250 ml) were collected from each treatment by dipping a sterile bottle into the storage tanks and pails at a depth and place where cattle would normally drink. Then, samples were immediately cooled and delivered to the EMBRAPA Laboratory to measure electrical conductivity, temperature and pH, and to determine the concentrations of HCO3–, Cl–, Ca, Mg, K and Na as described by EMBRAPA (1997) (Table 2).
Digestion and performance studies
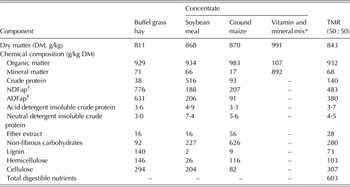
All the Red Sindhi heifers were cared for in accordance with guidelines of the National Council for the Control of Animal Experimentation (CONCEA 2008), such that the animals were housed, haltered and tethered with enough space for lying, standing, drinking and eating. Twenty-four Red Sindhi heifers (initial body weight (BW) of 200 ± 5 kg) were used to assess the impact of increasing concentrations of TDS (six heifers per treatment) in drinking water on intake, total apparent digestibility, performance, microbial protein synthesis, water and N balance over a 71-day period, where balance describes a calculated total body balance of water and N (‘in’ and ‘out’ flux). Heifers were blocked by weight, assigned randomly to one of the four treatments groups (640, 3187, 5740 and 8326 mg TDS/l) and housed in individual pens (2·0 × 2·60 m). The first 15 days were used to adapt heifers to the diets and pens that were bedded with straw in an open-sided building. Heifers were provided with a total mixed ration (TMR) ad libitum, consisting of (as fed) Buffel (Cenchrus ciliaris) grass hay and concentrate (soy meal, ground maize grain and a supplement containing vitamins and minerals) in a ratio of 50 : 50 (Table 3) and they had free access to water (saline water treatments in pails as described previously) at all times. Rations were prepared twice daily at 07·30 and 16·30 h in a manner that assured 0·10 orts at the morning feeding, with feeds and orts being weighed daily and used to calculate average daily intake as described by da Silva & Leão (Reference da Silva and Leão1979). Apparent digestibility was assessed from day 43 when collections of faeces, orts, feeds and urine were conducted over a 5-day period, during which sub-samples (0·10 of total daily samples) were composited for each animal. To determine total tract digestibility, 500 mg of LIPE™ was infused orally into each animal from day 42 to 47, with apparent digestibility being calculated as concentrations of fed LIPE™ divided by concentrations of excreted LIPE™ using the ratio technique. Faecal samples (c. 100 g fresh weight) were extracted daily from the rectum at 08·00 and 15·30 h to determine total tract digestibility from individual animals using LIPE™ (enriched and purified isolated lignin of Eucalyptus grandis) as an external marker, as outlined by Saliba et al. (Reference Saliba, Rodriguez and Pilo-Veloso2006). An additional faecal sample (c. 100 g fresh weight) was collected from each animal prior to feeding the marker to correct calculations for initial LIPE™ excretion. These faecal samples were composited by animal, dried at 55 °C for 48 h in a forced air oven, ground through a 1-mm screen and sent to the Animal Nutrition Laboratory (Federal University of Minas Gerais, Belo Horizonte, Brazil) to determine LIPE™ concentrations (Saliba et al. Reference Saliba, Rodriguez and Pilo-Veloso2006).
Chemical composition of ingredients and diet

TMR, total mixed ration.
* Contained 190 g/kg calcium, 60 g/kg phosphorus, 30 g/kg magnesium, 35 g/kg potassium, 70 g/kg sodium, 50 g/kg chlorine, 0·02 mg/kg sulphur, 15 mg cobalt/kg, 700 mg copper/kg, 40 mg iodine/kg, 700 mg iron/kg, 1600 mg manganese/kg, 1000 mg selenium/kg, 2500 mg zinc/kg, 200000 international unit (IU) vitamin A/kg, 50000 IU vitamin D/kg and 1500 IU vitamin E/kg.
† NDFap: neutral detergent fibre corrected for residual ash and protein.
‡ ADFap: acid detergent fibre corrected for residual ash and protein.
Spot urine samples (0·20 of total daily output) were also collected over the 5-day collection period from each heifer before morning and afternoon feeding by stimulating urination through vulva massage. The 24-h urinary volume and the purine derivatives (PD) obtained from the spot sampling were estimated from creatinine concentration excreted in urine (Ørskov & MacLeod Reference Ørskov and Macleod1982), because total urine collection was not carried out (Chen et al. Reference Chen, Mejia, Kyle and Ørskov1995; Valadares et al. Reference Valadares, Broderick, Valadares Filho and Clayton1999; Barbosa et al. Reference Barbosa, Valadares, Valadares Filho, Veras, Leao, Detmann, Paulino, Marcondes and Souza2006). Afterwards, urine samples were cooled on ice, transported to the Animal Nutrition Laboratory of EMBRAPA (Petrolina, PE, Brazil) and acidified with 500 ml of 1 M H2SO4 to achieve urine pH<3. Aliquots (50 ml) from daily urine samples were composited for each heifer and diluted 1 : 5 with distilled water for analysis of total N and uric acid. Additional sub-samples (25 ml) were also diluted 1 : 50 with distilled water for allantoin analysis. All urine samples were stored at −40 °C for later determinations of PD.
Excretion of microbial PD (MPD) in the urine was estimated using the equation of Verbic et al. (Reference Verbic, Chen, MacLeod and Ørskov1990):
 $$\displaystyle{{{\rm MPD} = [{\rm PD} - (0 {\cdot} 385 \times {\rm BW}0 {\cdot} 75)]} \over {0 {\cdot} 85}}$$
where PD (mmol/d) is excretion of the purine derivatives, allantoin and uric acid; BW (kg) is body weight; 0·85 is the recovery of MPD; and 0·385 (mmol/d) is the contribution of endogenous PD. Microbial protein synthesis in the rumen (MPSR, g N/d) was calculated according to Chen et al. (Reference Chen, Chen, Franklin, Orskov and Shand1992):
 $$\displaystyle{{{\rm MPSR} = ({\rm MPD} \times 70)} \over {(0 {\cdot} 83 \times 0 {\cdot} 116 \times 1000)}}$$
where 70 is the N content of purines, in mg/mmol; 0·83 is the digestibility of microbial purines; and 0·116 is the ratio of purine N to total N in rumen bacteria.
Microbial crude protein (CP) (g/day) was calculated as MPSR × 6·25.
Whole-body N balance (g/day) was calculated as N intake (g/day) – (N excreted in faeces (g/day) + N excreted in urine (g/day)).
The ADG and feed conversion were measured from day 16 onwards. Heifers were weighed every 28 days and the ADG was calculated over a 56-day period by dividing BW gain (initial full BW − final full BW) by 56. Conversion efficiency was calculated as the ratio between DMI and ADG (kg DMI/kg BW gain).
Chemical analysis
All feeds used, including TMR, orts and faeces composites were dried at 65 °C for 72 h and ground to pass through a 1-mm screening using a Wiley Mill (Tecnal Ltd., São Paulo, São Paulo, Brazil). Ground samples were analysed for dry matter (DM) (method Instituto Nacional de Ciência e Tecnologia – Ciência Animal (INCT-CA): G-003/1), organic matter (method INCT-CA: G-003/1), ash (method INCT-CA: M-001/1), NDICP (neutral detergent insoluble CP) (method INCT-CA: N-004/1) and ADICP (acid detergent insoluble CP) (method INCT-CA: N-005/1) as described by Detmann et al. (Reference Detmann, Souza, Valadares Filho, Queiroz, Berchielli, Saliba, Cabral, Pina, Ladeira and Azevedo2012). A Leco combustion N analyser (FP-428N Determinator, Leco Corporation, St Joseph, MI, USA) was used to measure N content. Crude protein was calculated as N × 6·25. Neutral detergent fibre (NDF) was determined as described by Van Soest et al. (Reference Van Soest, Robertson and Lewis1991) using heat stable α-amylase and sodium sulphite (ash free). The content of acid detergent fibre (ADF), acid detergent lignin (ADL) and residual ash were determined using the sequential method of Van Soest et al. (Reference Van Soest, Robertson and Lewis1991). An Ankom Fibre Analyser (Ankom Technology Corporation, Macedon, NY, USA) was used to extract and filter NDF and ADF. The concentration of hemicellulose was calculated as NDF minus ADF, cellulose content as ADF minus ADL, and lignin concentration as ADL minus residual ash. The ether extract (EE) content was determined as described by AOAC (1995) (method 920·39) using an Ankom Fat Extractor (Ankom Technology Corporation, Macedon, NY, USA). Total (TC) and non-fibrous (NFC) carbohydrates were calculated as described by Sniffen et al. (Reference Sniffen, O'Connor, Van Soest, Fox and Russell1992):
 $$\eqalign{{\rm T}{\rm C}_{{\rm g/kg DM}} & = {\rm} 100- ({\rm CP} + {\rm EE} + {\rm ash}) \,\, {\rm and}\,\, {\rm NFC}_{{\rm g/kg DM}} \cr & = 100- ({\rm CP} + {\rm EE} + {\rm ash} + {\rm NDF})}$$
The concentrations of total digestible nutrients (TDN) were calculated according to Weiss & Wyatt (Reference Weiss and Wyatt2000) as:
 $$\eqalign{{\rm TD}{\rm N}_{{\rm g/kg DM}} & = {\rm digestible}\,\, {\rm CP} + (2 {\cdot} 25 \times {\rm digestible}\,\, {\rm EE}) \cr & \quad + {\rm digestible}\,\, {\rm NDF} + {\rm digestible}\,\, {\rm NFC}}$$
Urine samples were analysed for total N by the macro-Kjeldahl procedure, uric acid (Human, Itabira, MG, Brazil), creatinine (Human, Itabira, MG, Brazil) and allantoin according to the method described by Chen & Gomes (Reference Chen and Gomes1992).
Statistical methods
Data were analysed as a completely randomized design using the GLM procedure of SAS Version 9.1 statistical program (SAS 2002), with both treatments and heifers being considered as fixed effects. The model used was:
 $${\rm Yij} = \mu + {\rm Ti} + {\rm Eij}$$
where Yij is the observation, μ the overall mean, Ti the treatment and Eij the residual error. When significant, concentrations of TDS means were compared using Fisher's protected LSD (i.e. the DIFF option of the LSMEANS statement). Polynomial contrasts were used to determine linear and quadratic effects of TDS inclusion rate. Significance was declared at P < 0·05, and trends were discussed at P < 0·10.
RESULTS
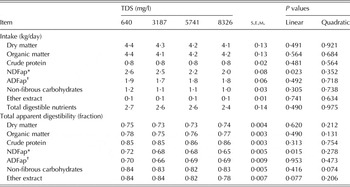
DMI, ADG, feed:gain, and intake and digestibility were mainly unaffected by the inclusion rate of TDS, with heifers remaining healthy throughout the experimental period and consuming DM within the limits recommended by the NRC (2001) (Tables 4 and 5). However, intake and digestibility of NDF declined linearly (P < 0·05) as TDS inclusion rate increased. Indeed, the magnitude of the decrease in NDF intake and digestibility among the heifers that drank 640 mg TDS/l and 8326 mg TDS/l was around 30 and 10%, respectively (Table 4).
Effect of increasing concentrations of saline water on dry matter intake and total apparent digestibility of dietary components in heifers fed Buffel (Cenchrus ciliaris) grass hay and concentrate

TDS, total dissolved salts.
* NDFap: neutral detergent fibre corrected for residual ash and protein.
† ADFap: acid detergent fibre corrected for residual ash and protein. s.e.m., standard error of mean; P, probability (if treatments differ at P < 0·05). Trends were discussed at P < 0·10. d.f. = 23.
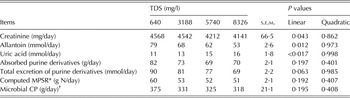
Effect of increasing concentrations of saline water on excretions of creatinine, allantoin, uric acid, microbial protein synthesis, microbial efficiency, total and absorbed purine derivatives from urine of heifers

TDS, total dissolved salts; MPSR, microbial protein synthesis in the rumen; CP, crude protein.
* Microbial protein synthesis in the rumen (see Material and Methods).
† Microbial CP (g/day) = MPSR × 6·25. s.e.m., standard error of mean; P, probability (if treatments differ at P < 0·05). Trends were discussed at P < 0·10. d.f. = 23.
Computed MPSR and absorbed PD excretions were not affected by the treatments; however, excretion of total PD tended (P < 0·10) to decrease linearly, with allantoin excretion decreasing in a linear manner (P < 0·05) in response to the increasing concentrations of saline water. On the other hand, the inclusion of TDS increased (P < 0·05) the excretion of uric acid in a linear fashion (Table 5).
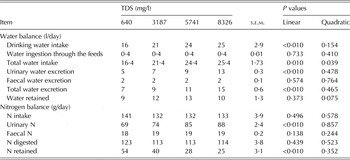
Increasing the inclusion rate of TDS resulted in a linear increase (P < 0·05) in drinking water intake and total (food plus drinking) water intake. A trend (P < 0·10) towards a quadratic response for retained water was also noted as TDS increased (Table 6).
Effect of increasing concentrations of saline water on water and nitrogen (N) balance in heifers fed Buffel (Cenchrus ciliaris) grass hay and concentrate

TDS, total dissolved salts; s.e.m., standard error of mean; P, probability (if treatments differ at P < 0·05). Trends were discussed at P < 0·10. d.f. = 23.
Total water excretion, with urine being the major route of water excretion, increased linearly (P < 0·05) in response to TDS inclusion (Table 6). Yet excretion of creatinine decreased (P < 0·05) in a linear fashion as TDS in drinking water increased (Table 5).
Apparent N retention declined linearly (P < 0·05) in response to the inclusion amount of TDS. However, a linear increase (P < 0·05) in excretion of urinary N was detected as concentrations of saline water increased (Table 6).
DISCUSSION
Lack of effect of increasing concentrations of TDS in drinking water containing high concentration of NaCl and low content of Ca, sulphur (S) and Mg as used in the current work on DMI, performance and digestibility was unexpected, as it has been reported that brackish water containing up to 3493 mg TDS/l and a high proportion of SO4 in its mineral composition generally reduced feed intake and resulted in weight loss in cattle (Weeth & Hunter Reference Weeth and Hunter1971). However, previous studies have reported no or only slight reductions in DMI and performance of dairy cattle that ingested salty water. Bahman et al. (Reference Bahman, Rooke and Topps1993), who offered brackish water from wells containing 3574 mg TDS/l and high concentrations of S, Cl, Na and Ca as a source of drinking water for Friesian-Holstein cows reared in the hot arid conditions of Kuwait, did not find a reduction in DMI, live weight or milk yield. Likewise, an Israeli study carried out in the Arava Desert demonstrated that Holstein cows consuming either desalinated water or saline water (4000 mg TDS/l with high concentration of Na, Ca, Mg, Cl and S) from wells had similar DMI, though water consumption and milk production were slightly higher as desalinated water was supplied (Solomon et al. Reference Solomon, Miron, Ben-Ghedalia and Zomberg1995).
There may be several explanations for the absence of any effect of increasing TDS concentrations as high as 8326 mg/l on DMI, digestibility and performance of Red Sindhi heifers drinking salty water. First, artificial salty water was used that contained high concentrations of NaCl and low content of Ca, S and Mg, properties that characterize a type of saline water that apparently does not reduce animal performance (Sanchez et al. Reference Sanchez, McGuire and Beede1994). Second, animals used in the current study were probably adapted to high-saline water consumption. Third, the trial had few animals to evaluate the effect of increasing concentrations of TDS in drinking water on DMI. In fact, Masters et al. (Reference Masters, Benes and Norman2007) observed that Bos indicus originating from arid environments would be more adapted to long-term administration of high-saline water intake than other livestock breeds.
The decrease in intake and digestibility of NDF as TDS was included in saline water was probably caused by the increase in intake of drinking water and total water. Higher water ingestion may have caused a physical distension of the reticulo-rumen and decreased the rates of fibre removal from these compartments, thereby affecting intake and digestibility of NDF (Mertens Reference Mertens1987; Dado & Allen Reference Dado and Allen1995; Allen Reference Allen2000). Indeed, Kume et al. (Reference Kume, Nonaka, Oshita and Kozakai2010) reported that dietary intake of NDF decreased as the ingestion of drinking water increased in dairy cows housed in a controlled climatic chamber set at 20 °C and 60% relative humidity, and fed roughage (alfalfa or orchard grass silage) and concentrate as a TMR in a ratio of 60 : 40.
Total water excretion, with urine being the major route of water excretion, responded positively to the TDS inclusion amount, probably as a reflection of the increased water intake (Dahlborn et al. Reference Dahlborn, Akerlind and Gustafson1998; NRC 2001). However, excretions of creatinine, a urine volume marker that is excreted at a constant rate in the urine of adult animals (Moorby et al. Reference Moorby, Dewhurst, Evans and Danelón2006), decreased linearly as TDS in water increased. These results agree with those found by Chizzotti et al. (Reference Chizzotti, Valadares Filho, Diniz Valadares, Martins Chizzotti and Tedeschi2008), who reported a linear decrease in creatinine excretion in heifers relative to lactating cows and bulls, supporting the hypothesis that variation in weight and body protein mass turnover can lower daily excretions of creatinine in growing animals (Lofgreen & Garrett Reference Lofgreen and Garrett1954).
Lack of a negative response to rumen microbial protein synthesis as concentrations of TDS increased may suggest that the high TDS inclusion rate in drinking water as used in the current study did not have a direct toxic effect on rumen microbes, although allantoin excretion decreased in a linear fashion in response to the increasing concentrations of saline water due to a trend towards decreased excretion of total PD (Moorby et al. Reference Moorby, Dewhurst, Evans and Danelón2006). This is consistent with the results found by Valtorta et al. (Reference Valtorta, Gallardo, Sbodio, Revelli, Arakaki, Leva, Gaggiotti and Tercero2008), who reported no reduction in ruminal population of amylolytic and cellulolytic bacteria and protozoa when lactating cows were fed saline water that had NaCl as the predominant salt and TDS concentrations ranging from 1000 to 10 000 mg/l during an experimental period of 3 months. However, Thomson et al. (Reference Thomson, Beever, Latham, Sharpe and Terry1978) and Hungate (Reference Hungate1966) reported changes in species of ruminal bacteria and a reduction in size and number of protozoa as animals were fed a high salt diet (0·06 and 0·11) compared with those fed a low-salt diet (0·0 incorporated). If such changes in microbial populations occurred in the current study, they had no detectable effect on rumen microbial protein synthesis, which suggests that the ruminal microflora tolerated or was unaffected by short-term increases in salinity and osmotic pressure (Carter & Grovum Reference Carter and Grovum1990).
Apparent N retention decreased linearly in response to the inclusion amount of TDS, thereby increasing the excretion of urinary N. Past studies have revealed that the excretion of urinary N is directly correlated to urine output (Paquay et al. Reference Paquay, De Baere and Lousse1970; Murphy Reference Murphy1992), although dietary Na and N are factors that can affect both urinary N excretion and urine output positively in cattle (Kume et al. Reference Kume, Nonaka, Oshita, Kozakai and Hirooka2008). Thus, it seems likely that the intake of increasing concentrations of Na+ from saline water in the current study has contributed to lowering plasma antidiuretic hormone concentration and, consequently, increasing glomerular filtration rate, which in turn, decreased the renal reabsorption of water and urea while increasing urine volume and excretion of urinary N to the environment (Maltz & Silanikove Reference Maltz and Silanikove1996; Bannink et al. Reference Bannink, Valk and Van Vuuren1999; Spek et al. Reference Spek, Bannink, Gort, Hendriks and Dijkstra2012).
Increased excretion of urinary N to the environment is of particular concern and poses a considerable challenge for farmers who use saline water with similar characteristics to those of the current study, since urea from urine, which results from a reaction catalysed by the bacterial urease, can be rapidly hydrolyzed to ammonia (NH3). Once released, NH3 is easily lost to the atmosphere and can cause ammonium nitrate formation and air pollution (Hristov et al. Reference Hristov, Hanigan, Cole, Todd, McAllister, Ndegwa and Rotz2011). Thus, producers need to take appropriate steps to develop nutrient management programmes that improve N use and retention by animals and plants.
In conclusion, saline water that has up to 8326 mg TDS/l and possesses high concentrations of NaCl and low content of Ca, S and Mg can be used as a source of drinking water for growing animals on a short-term basis without affecting performance, intake and digestibility. However, increasing the inclusion rate of TDS resulted in a linear decrease in intake and digestibility of NDF. Similarly, increasing concentrations of saline water led to a higher drinking water intake and total (food plus drinking) water excretion, with urine being the major route of water excretion. Despite lower allantoin excretion, microbial N production and absorbed PD excretions were not influenced by the treatments. Finally, increasing concentrations of TDS caused increased urinary N excretion, an issue that farmers will have to consider when developing nutrient management plans. Further characterization of the long-term effects of drinking water containing high concentrations of TDS (with NaCl being the predominant salt) on performance and rumen microbial population could provide additional information for identification of TDS levels that are harmless to ruminants.
This study was funded by Brazilian Development Bank (BNDES), National Counsel of Technological and Scientific Development (CNPq) and Brazilian Agricultural Research Corporation (Embrapa).