I. INTRODUCTION
The α–β phase transition between the low-temperature and high-temperature (HT) cristobalite form of SiO2 and of its isoelectronic analogue AlPO4 as well as the nature of the crystallographic disorder of the β-cristobalite form of SiO2 and AlPO4 have been the subject of intensive research during the past four decades (Wright and Leadbetter, Reference Wright and Leadbetter1975; Yuan and Huang, Reference Yuan and Huang2012). Not before 1989, it became possible to stabilize the β-cristobalite form of SiO2 (high cristobalite) at room temperature in laboratory and engineering ceramic industries by applying solid solution-forming techniques (Perrotta et al., Reference Perrotta, Grubbs, Martin, Dando, McKinstry and Huang1989). However, for the β-cristobalite form of AlPO4, nothing similar had been known for further 20 years. The first mentioning of a so far unknown form of “crystallographically disordered aluminium phosphate” dates back to 2011 (Petzet et al., Reference Petzet, Peplinski, Bodkhe and Cornell2011, Reference Petzet, Peplinski and Cornel2012). Soon afterward, it was discovered that nanocrystalline and stacking-disordered β-cristobalite AlPO4 can be stabilized down to room temperature and is the major component of the fly ash of a large incineration facility operated by the waste water treatment authorities of Frankfurt/M., Germany (Peplinski et al., Reference Peplinski, Adam, Adamczyk, Müller, Michaelis, Krahl and Emmerling2014, Reference Peplinski, Adam, Adamczyk, Müller, Michaelis, Krahl and Emmerling2015). Previous comprehensive investigations of this fly ash failed to interpret its complex X-ray powder diffraction (XRD) pattern – presumably mainly because of the lack of an experimental digital pattern of the title compound in the Powder Diffraction Database. The present paper aims at bridging this gap.
II. EXPERIMENTAL METHODS
A. Synthesis of the title compound
This paper reports on four series of synthesis products obtained from single batches of the following two starting substances: an undoped non-stoichiometric aluminium phosphate precipitate and calcium nitrate tetra urea (Ca-NTU). Using these two starting materials and different mixing ratios, the following four types of blends were generated: “blend Z” means no Ca-NTU added to the aluminium phosphate component; “blend Q” means the aluminium phosphate component was doped with an amount of Ca-NTU that corresponds to w Ca/w AlPO4 = 0.0041; “blend H” means w Ca/w AlPO4 = 0.0082; and “blend M” means w Ca/w AlPO4 = 0.0165, i.e. (Z – zero, Q – quarter, H – half, M – maximum). Each blend was divided into a number of sub-samples and each sub-sample was calcined at a certain temperature. The resulting synthesis product is named by a capital letter, followed by a hyphen and a number, e.g. H-876. This capital letter indicates whether the sub-sample had been taken from a Z-, Q-, H-, or M-type of blend, while the number indicates the temperature in °C at which the given sub-sample was calcined. All synthesis products originating from the same type of blend form a series of synthesis products that is named by the same capital letter as the blends. The present paper focuses mainly on synthesis products from the H-series.
A detailed and unabridged description of the synthesis procedure is given in the supplemental material (see online Section S1).
B. Reference sample (RS)
The availability of a fine-grained and well-crystallized α-cristobalite AlPO4 powder with negligible stacking-fault density is advantageous for some of the analytical techniques (e.g. DTA, 31P-NMR spectroscopy, XRD) applied for the physical characterization of synthesis products of the title compound. Such RS was produced by calcinating a commercial aluminium phosphate at 1300 °C for 24 h in a muffle furnace.
C. X-ray powder diffraction
1. Equipment and data collection strategy
XRD measurements were performed at room temperature with a Bruker-AXS D5000 diffractometer in Bragg–Brentano geometry using copper K α 1,2 radiation, an 1.0 mm aperture, a 0.1 mm receiving slit, and a sample spinner (0 or 15 rpm). A corundum plate (NIST SRM 1976, instrument response standard for XRD) was used to check and monitor the performance of the instrument. The sealed X-ray tube was operated at 30 kV and 40 mA. A Si(Li) solid-state detector was used for most of the measurements. However, the data presented in Figures 1–3 were collected with a curved graphite secondary monochromator. A low-background specimen holder with a cavity (Ø 20 mm × 0.5 mm) was used for all XRD analyses of the starting substances, the semi-finish products, for their definition see supplemental material, online Section S1, the synthesis products including the title compound, the external intensity standard, i.e. the RS, and the blend used for the determination of the corundum reference intensity ratio (RIR I/I c) (for the latter see Section II.C.3).
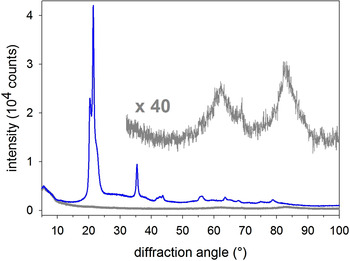
(Colour online) Observed XRD pattern of the title compound (synthesis product H-876) prior to applying any corrections (blue curve); the dark grey curve near the bottom line is the observed scattering curve of the empty zero-background sample holder, note that both curves coincide in the 5°–10° range; the upper dark grey curve visualizes the high-angle section of the latter after multiplying the intensity by a factor of forty.

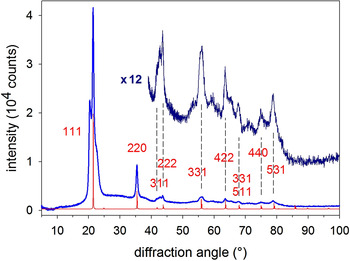
(Colour online) Observed XRD pattern of the title compound (synthesis product H-876) after subtracting the scattering curve of the empty zero-background sample holder (see Figure 1). The dark blue curve above visualizes the high-angle section after multiplying its intensity by a factor of 12. Miller indices (in red) refer to the simulated diffraction pattern of well-crystallized β-cristobalite AlPO4 (red curve) using the structure data by Wright and Leadbetter (Reference Wright and Leadbetter1975).

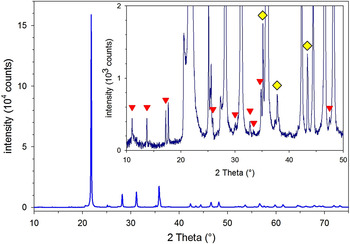
(Colour online) A large section and an enlarged section of the observed diffraction pattern of synthesis product H-1292 after subtracting the scattering curve of the empty zero-background sample holder (see Figure 1). The main component is α-cristobalite AlPO4; red triangles and yellow diamonds point at non-overlapped diffraction lines characteristic for Ca9Al(PO4)7 and α-Al2O3 (corundum), respectively. Note that the two Y-axes differ by one order of magnitude.

The XRD analysis of all synthesis products started with collecting diffraction data from 10° to 60° in steps of 0.02° for at least 40 s per step. These measurements were accompanied by measurements of an external intensity standard, for which a specimen of the α-cristobalite AlPO4 RS was used. In many cases, the data accumulation time for a given specimen was increased by repeating the measurement of the complete 2θ range several times and – after checking the individual diffraction curves for consistency – adding them up.
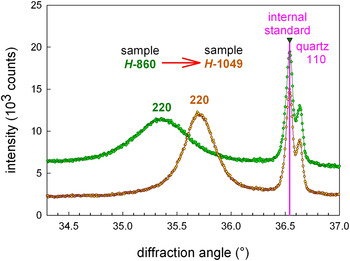
For many synthesis products, this routine XRD analysis was followed by additional measurements using more sophisticated data collection strategies. For the precise determination of the position of reflections and their profile parameters (see Figures 4–6), a fine-grained quartz powder was used as an internal standard substance and the step width was reduced to 0.006°.
(Colour online) Section of the diffraction patterns of the synthesis products H-860 (green curve) and H-1049 (brown curve) collected after blending with an internal standard substance (quartz) for precise determination of the angular position of the 220 reflection of cristobalite AlPO4.

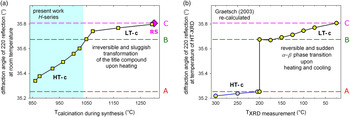
(Colour online) (a) Precise positions of the 220 reflection of the cristobalite AlPO4 component determined for 10 synthesis products of the H-series (yellow squares) and the reference sample (RS)(pink diamond) at room temperature in the present work; the blue-shaded area at the left marks those samples that show no α–β transition in DTA measurements (see online Tables SI and SII). (b) Precise positions of the 220 reflection re-calculated by the authors from lattice parameters of undoped and well-crystallized cristobalite AlPO4 determined by temperature-resolved XRD [see (Graetsch, Reference Graetsch2003)]. The dashed horizontal lines marked by A and B highlight the 2θ 220 values at both ends of the reversible α–β phase transition in undoped and well-crystallized cristobalite AlPO4, while the dashed line marked C highlights the 2θ 220 value of the α-cristobalite form of AlPO4 at room temperature; “LT-c” stands for “low-temperature form of cristobalite AlPO4”, i.e. α-cristobalite AlPO4, “HT-c” stands for “high-temperature form of cristobalite AlPO4”, i.e. β-cristobalite AlPO4.

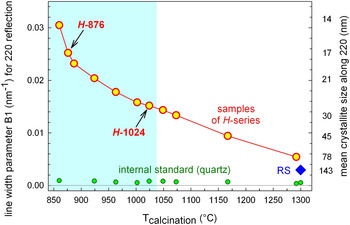
(Colour online) Two parameters describing the microstructure of the cristobalite AlPO4 crystals in the synthesis products of the H-series (red circles) and the reference sample (RS) (blue diamond) obtained from the profiles of the 220 reflection in the observed XRD patterns. Y-axis at the left: the Lorentzian line width parameter B1 considering contributions from the microstructure of the sample, exclusively. Y-axis at the right: mean crystallite size along the 220 direction obtained from the B1 parameter. Green circles near the bottom line visualize the B1 values of the 110 reflection of the internal standard in the spiked samples. The blue-shaded area at the left marks those synthesis products of the H-series that show no α–β transition in DTA measurements.

For the high-quality diffraction data of synthesis product H-876 visualized in Figures 1 and 2, the 2θ range was extended at both ends, using a low-angle limit of 5° and a high-angle limit of 100°. To compensate for the intensity loss associated with the use of a curved graphite secondary monochromator, the number of repeating runs for collecting the diffraction data from a single specimen was increased to 10, resulting in a total measuring time of 400 s per data point. The step width used in this case was 0.02° in the 5°–50.7° range, and 0.06° in the 49°–100° range. Thus, the neighbouring 2θ ranges overlap considerably. For synthesis product H-1292, diffraction data were collected in the same manner for the range of 10°–82° (data partially shown in Figure 3).
2. Data evaluation
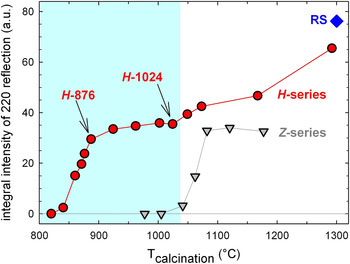
For the analysis of the diffraction patterns, the DiffracPLUS software package (Bruker-AXS GmbH, 2007) as well as the Inorganic Crystal Structure Database (ICSD) issued in 2016 by Fachinformationszentrum (FIZ) and National Institute of Standards (NIST) (FIZ and NIST, 2016) and the Powder Diffraction File (PDF) (ICDD, 2015) were used. The position and profile parameters shown in Figures 4, 5(a), and 6 and online Table SII were determined by profile fitting using the program BGMN (Bergmann et al., Reference Bergmann, Friedel and Kleeberg1998), which makes use of the fundamental parameters approach (Querner et al., Reference Querner, Bergmann and Blau1991; Cheary and Coelho, Reference Cheary and Coelho1992). All values given for the precise position of the 220 reflection of cristobalite AlPO4 refer to the α 1 component of the CuKα 1,2 doublet. Wavelength data were taken from Wilson and Price (Reference Wilson and Price1999). The integral intensity values shown in Figure 7 were determined using the DiffracPLUS software package. These intensity data can be used straight forward to determine the onset temperature of the crystallization of the title compound reliably. However, their further interpretation needs additional considerations (see online Section S10 in the supplemental material).
(Colour online) Integral intensity of the 220 reflection of cristobalite AlPO4 in synthesis products of the H-series (red circles), the Z-series (grey triangles), and the reference sample (RS) (dark blue diamond). The light blue-shaded area at the left marks those synthesis products of the H-series that show no α–β transition in DTA measurements.

3. The corundum reference intensity ratio I/I c
For the determination of the RIR I/I c of the title compound, a 1:1 blend of synthesis product H-962 with a fine-grained corundum powder, NIST SRM 676 (alumina powder), was weighed in. Subsequently, the diffraction data of this 1:1 blend were collected (for the specimen size, see first paragraph of Section II.C.1). To extract the net peak heights from the observed pattern, the background beneath the two diffraction lines was approximated by linear functions. The nodes for the 111 reflection of the title compound were placed at 18.4° and 26.9°, while the nodes for the 104 reflection of corundum were at 33.2° and 40.6°.
As the 104 reflection of corundum is partially overlapping with the neighbouring 220 reflection of the title compound, an overlay with the intensity-scaled diffraction profile of the unblended synthesis product H-962 was used to quantify this contribution. It was found that just 3.9% of the height of the background-corrected 104 reflection of corundum is caused by the neighbouring AlPO4 line. Consequently, the final value of the net height of the 104 reflection of corundum was determined by multiplying the value of the underground-corrected peak height by 0.961.
D. Analytical techniques others than XRD
A description of the instrumentation and procedures applied by all other analytical techniques in the present investigation can be found in the supplemental material (see online Sections S2–S8).
III. RESULTS AND DISCUSSION
A. High-quality XRD pattern of the title compound
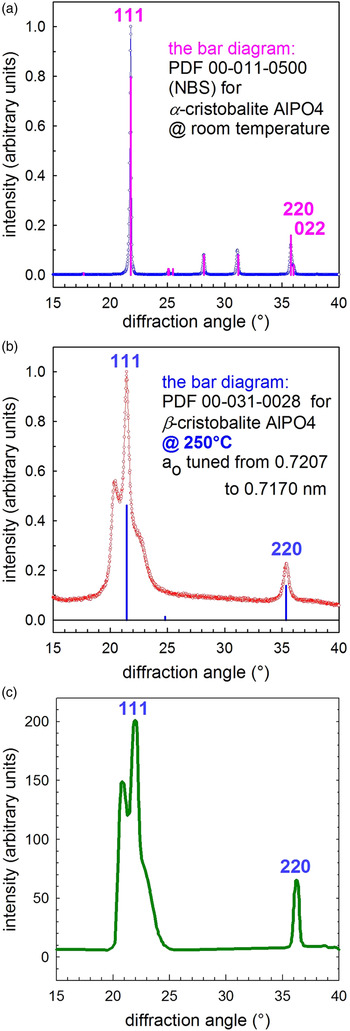
Figures 8(a)–8(c) compare the identical 2θ ranges of three diffraction patterns. Figures 8(a) and 8(b) show the observed diffraction patterns of the RS and of the synthesis product H-876, respectively. In addition, the bar diagrams of the database entries for α- and β-cristobalite AlPO4 are displayed in these two figures. Figure 8(c) shows a simulated powder diffraction pattern of nanocrystalline and heavily stacking-disordered β-cristobalite SiO2. This figure was redrawn by the present authors from data published by Guthrie et al. (Reference Guthrie, Bish and Reynolds1995). The comparison of these three patterns and two bar diagrams leads to the conclusion that the pattern of synthesis product H-876 [Figure 8(b)] is a pattern of the title compound. This interpretation is fully supported by the results of DTA and 31P-NMR analyses.
(Colour online) At room temperature observed diffraction patterns of (a) a well-crystallized α-cristobalite AlPO4 reference sample (RS) and (b) synthesis product H-876 (the title compound), and (c) the simulated powder diffraction pattern of β-cristobalite SiO2 nanocrystals nearly randomly interstratified with HT-tridymite SiO2 layers assuming nearly equal probabilities for the cubic and the hexagonal stacking sequences, redrawn by the present authors from data published by Guthrie et al. (Reference Guthrie, Bish and Reynolds1995), for comparison.

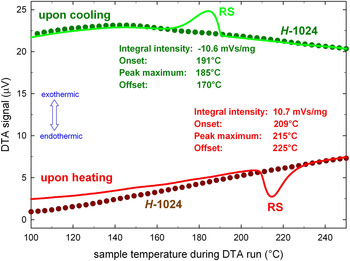
The DTA data presented in Figure 9 and online Table SI prove that the present investigation of the RS yielded clearly visible DTA signals, the position, the shape, and the intensity of which are fully in line with the expectations based on published data. Furthermore, they prove that the α–β phase transition of the cristobalite form is completely missing in all synthesis products of the H-series calcined at temperatures below or equal to 1024 °C. A comparison of DTA data with results of the structural characterization of the title compound is given in online Table SII.
(Colour online) Results of the thermoanalytical investigation of synthesis product H-1024 (dotted lines) and the reference sample (RS) (solid lines) upon heating and cooling.

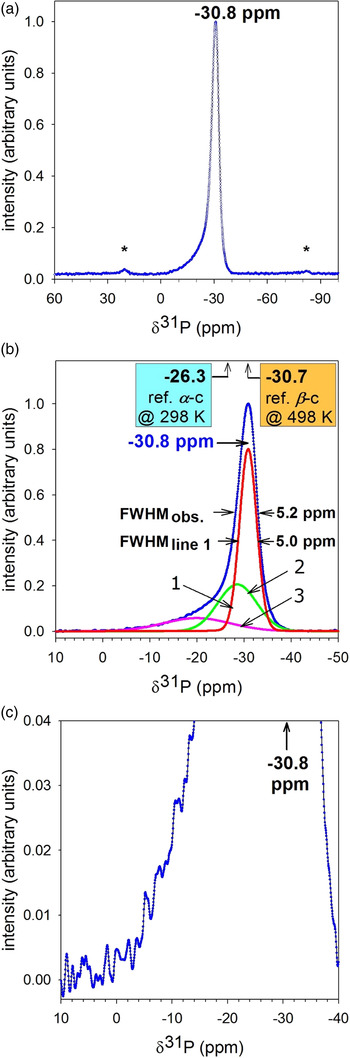
The NMR data of synthesis product H-876 is visualized in Figures 10(a)–10(c) and prove that the chemical shift of the crystalline AlPO4 component of synthesis product H-876 is −30.8 ppm, which is practically identical with the reference value for β-cristobalite AlPO4 of −30.7 ppm. The latter was determined upon heating well-crystallized and chemically pure α-cristobalite AlPO4 up to 498 K and collecting the spectrum of the reversibly formed β-form at this temperature by HT P-NMR spectroscopy (Phillips et al., Reference Phillips, Thompson, Xiao and Kirkpatrick1993). On the other hand, the value −30.8 ppm is quite different from the reference value of −26.3 determined by the same authors for the α-cristobalite form of the same cristobalite specimen at room temperature. A concise summary of results of the 31P-NMR analysis of the title compound is given in online Table SII.
(Colour online) 31P-NMR spectrum of synthesis product H-876 (the title compound), (a) overview, asterisks denote spinning side bands; (b) enlarged X-axis, curve fitting, full width at half maximum (FWHM); (c) enlarged X- and Y-axes; “ref. α-c” and “ref. β-c” stand for “reference value for the chemical shift of α-cristobalite AlPO4” and “reference value for the chemical shift of β-cristobalite AlPO4”, respectively; for the reference, see third paragraph of Section III.A and online Table SII in the supplemental material.

Figure 1 shows the as-measured high-quality diffraction pattern of the title compound (synthesis product H-876) together with the corresponding scattering curve of the empty zero-background sample holder. The latter contributes to the first mainly in the 5°–10° 2θ range and to a lesser extent in the 50°–90° 2θ range. Figure 2 visualizes the observed high-quality diffraction pattern of the title compound that results from the as-observed pattern of the synthesis product H-876 after subtracting the scattering curve of the empty sample holder. In addition, the simulated diffraction pattern of well-crystallized β-cristobalite AlPO4 is displayed. For this simulation, the structure data by Wright and Leadbetter (Reference Wright and Leadbetter1975) and the program PowderCell v. 2.4 by Kraus and Nolze (Reference Kraus and Nolze1996) were used.
The positions of the diffraction lines in the diffraction pattern of the title compound (synthesis product H-876) that was observed at room temperature and is displayed in Figures 1, 2, and 8(b) are best matched by the simulated pattern and by the bar diagram if a value of 0.7170 nm is used for the lattice parameter of the β-cristobalite AlPO4 phase. That means that the HT lattice parameter has to be slightly tuned with regard to the values published by the following three authors: 0.7195 nm as determined at 205 °C by Wright and Leadbetter (Reference Wright and Leadbetter1975); 0.720 07 nm as determined at 250 °C by Kosten and Arnold [see PDF 00-031-0028 Grant-in-Aid (ICDD, 2015)]; and finally 0.719 47 nm as determined at 200 °C by Graetsch (Reference Graetsch2003). This is not really astonishing, as it is well known that the temperature of the α–β phase transition (and therefore the smallest possible value of the lattice parameter of the β-cristobalite form, too) “is highly variable and shows considerable hysteresis upon cooling. Transition temperatures can range from 130 to 270 °C” (Spearing et al., Reference Spearing, Farnan and Stebbing1992).
B. Temperature of primary crystallization
Figure 7 displays the integrated intensities of the 220 reflection of the β-cristobalite form of AlPO4 for the synthesis products of the Z- and H-series. These data prove that the addition of 0.82 wt% Ca (H-series) lowers the temperature of primary crystallization from 1025 °C (Z-series) to 830 °C (H-series). The corresponding values for the addition of 0.41 wt% Ca (Q-series) and 1.65 wt% Ca (M-series) are 880 and 790 °C, respectively (data for the Q- and M-series not visualized). Thus, the temperature of primary crystallization of the pure non-stoichiometric aluminium phosphate monotonously decreases when the added amount of Ca-NTU is increased from 0 to 1.65 wt% Ca. It appears reasonable to associate this strong influence of the Ca content with the formation of highly reactive CaO species at the last step of the thermal decomposition of Ca-NTU. This is identical with the last step of the thermal decomposition of anhydrous calcium nitrate and was named “stage III” by Migdal-Mikuli et al. (Reference Migdal-Mikuli, Hetmanczyk and Hetmanczyk2007). It takes place between 775 and 871 K (502 and 598 °C) according to DTA-TG analysis by Migdal-Mikuli et al. (Reference Migdal-Mikuli, Hetmanczyk and Hetmanczyk2007) and by the present authors.
C. Gradual changes of structure caused by increasing calcination temperature
Although the title compound is long-term stable over a wide temperature range, it is not thermodynamically stable and the present investigation shows that the primary crystallization is immediately followed by the onset of two simultaneous processes: the crystal growth of the cristobalite AlPO4 component and a remarkably sluggish conversion of the title compound (see Figure 2) into the thermodynamically stable α-cristobalite form of AlPO4 plus two minor components (see Figure 3). These two processes were studied by X-ray and electron diffraction, DTA, and NMR. In the XRD patterns, the following systematic changes were observed: a gradual shifting of the position of the 220 reflection [see Figures 4 and 5(a)], a gradual reduction of the width of the 220 diffraction line (see Figures 4 and 6) and gradual changes of the profile of the 111 reflection (not shown).
The 2θ values of the 220 reflection gained from the synthesis products of the H-series are visualized in Figure 5(a) and listed in online Table SII. They bear an astonishing similarity to the 2θ 220 values determined by Graetsch (Reference Graetsch2003) and displayed in Figure 5(b). The latter were obtained from non-ambient X-ray diffraction data collected upon heating undoped and well-crystallized α-cristobalite AlPO4 from room temperature to elevated temperatures. Actually, Graetsch (Reference Graetsch2003) published refined lattice parameter data, not individual 2θ values. Thus, the 2θ 220 values displayed in Figure 5(b) were recalculated from his published lattice parameter data by the present authors to allow for a direct comparison with the data determined in the present investigation (see Section II.C.2).
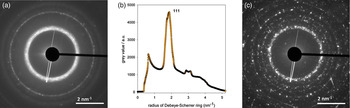
Figures 11(a)–11(c) show the electron diffraction patterns of the title compound (H-887) and of the synthesis product H-1167. The streaks in the diffraction pattern of H-1167 indicate the presence of crystallographic defects.
(Colour online) Electron diffraction patterns: (a) diffraction pattern of the title compound (H-887); (b) section of the one-dimensional (1D) representation of the 2D data in Figure 11(a), visualizing the intensity distribution around the 111 reflection of the title compound; (c) diffraction pattern of the synthesis product H-1167.

Results of DTA analyses are visualized in Figure 9 and summarized in online Table SI. In addition, a direct comparison between the results of DTA, XRD, and 31P-NMR analyses of eight synthesis products from the H-series and the RS with published reference values is presented in online Table SII.
The raising of the calcinations temperature from 876 to 1292 °C leads in the 31P-NMR spectra of samples from the H-series to a change of the position of the main signal from −30.8 ppm, i.e. from a position that is characteristic for the β-cristobalite form of AlPO4 (see Figure 10) to −26.9 ppm, i.e. to a position that is characteristic for α-cristobalite AlPO4 according to temperature-resolved NMR data by Phillips et al. (Reference Phillips, Thompson, Xiao and Kirkpatrick1993) (see Figure 12). However, this change in position is not just a shifting of a given line profile as it involves a clearly visible splitting into two individual lines, A and B, that is accompanied by a massive redistribution of intensity from line B to line A followed by a further shifting of line A (see online Figure S1 and Table SII). It appears reasonable to associate these findings with the model of a temperature-controlled equilibrium between α- and β-ring conformations developed for the mechanism of the α–β phase transition in cristobalite SiO2 by Yuan and Huang (Reference Yuan and Huang2012) [see their Figure 5(a)].
(Colour online) 31P-NMR spectrum of synthesis product H-1292, (a) overview, asterisks denote spinning side bands; (b) enlarged X-axis, FWHM; (c) enlarged X- and Y-axes; for “ref. α-c” and “ref. β-c”, see caption of Figure 10; “ref. Ca9 M 3+(PO4)7” stands for “reference values for the multi-line band of Ca9 M 3+(PO4)7” (for this reference, see online supplemental material, Section S11).

In addition to the so far described processes, calcination at elevated temperatures leads to a loss of homogeneity by segregation of minor components in the synthesis products. This particular aspect is described in the supplemental material (see online Section S11).
D. The corundum reference intensity ratio I/I c
For the corundum reference intensity ratio I/I c of the title compound (synthesis product H-962), a value of 0.63 was determined. This was done as described in Section II.C.3.
E. Further results of the physical characterization
The physical characterization of the synthesis products was completed by three-element analytical methods, a very comprehensive investigation using various electron microscopic techniques and by gas-sorption analyses. These results are described and discussed in the supplemental material (see online Sections S1, S9, and S11).
IV. CONCLUSION
-
• The chemically stabilized nanocrystalline β-cristobalite form of AlPO4 can be synthesized without crystalline impurities. The synthesis procedure of this new compound has been optimized, is reproducible, and well documented.
-
• The title compound shows no reversible α–β phase transition in DTA investigations.
-
• The title compound is not a thermodynamically stable phase, but a transitional or Ostwald phase. However, it is long-term stable at ambient and at temperatures up to several hundred °C.
-
• At elevated temperatures, the title compound converts into the conventional cristobalite AlPO4 form, which shows a sudden and reversible α–β phase transition between two modifications each of which is thermodynamically stable within its own well-defined temperature (and pressure) range. This conversion proceeds very sluggishly, even at temperatures up to 1200 °C.
-
• This conversion is irreversible and accompanied by a segregation of the overstochiometric aluminium oxide and the calcium component (dopant). It finally leads to a mixture of three thermodynamically stable crystalline phases: α-cristobalite AlPO4, α-Al2O3 (corundum) and Ca9Al(PO4)7.
-
• In the just crystallized title compound, the stacking fault density of the crystals is close to its theoretical maximum value. That means that β-cristobalite AlPO4 nanocrystals are nearly randomly interstratified with high-tridymite AlPO4 layers and the cubic and hexagonal stacking sequences are nearly equally probable.
-
• The morphology of the just crystallized title compound shows mesopores and looks sponge-like. It resembles the morphology of a semi-finished product (aluminium phosphate heated at 380 °C for 2 h). Densification proceeds only slowly and needs prolonged heating at elevated temperatures.
-
• The title compound is prone to amorphization by the electron beam used in electron microscopy and related analytical techniques.
SUPPLEMENTARY MATERIAL
The supplementary material for this article can be found at https://doi.org/10.1017/S0885715617000537.
ACKNOWLEDGEMENTS
The authors are grateful to A. Zimathies for supporting this work by performing the gas-adsorption analyses. One of the authors (B.P.) thanks Dr. R. Matschat, Dr. H.-E. Maneck, and Dr. G. Kley, all formerly with BAM, Berlin, and before that with the Academy of Sciences, Berlin-Adlershof for many inspiring discussions in the course of a long-lasting scientific collaboration, that paved the way for the presented findings.