Introduction
Metal matrix composites (MMCs) exhibit excellent material properties such as higher specific strength, operating temperature, and wear resistance than monolithic metals. These properties make MMCs attractive for many structural applications. To facilitate successful application of MMCs, an in-depth understanding of the microstructure–property relationship is required. It has been reported that microstructure and constituent properties combine to determine the overall fracture toughness of MMCs through the activation of different fracture mechanisms [Reference Romanova, Balokhonov and Schmauder1, Reference Chawla2, Reference Llorca, Needleman and Suresh3]. Specifically, interface debonding and particle cracking are two competing fracture mechanisms during the crack–reinforcement interactions [Reference Babout, Brechet, Maire and Fougères4]. Qian et al. [Reference Qian, Kobayashi, Toda, Goda and Wang5] experimentally evaluated the fracture toughness of 6061 Al MMCs and concluded that MMCs with large reinforcement particles exhibit lower initiation fracture toughness, crack propagation energy, and total absorbed energy. Jarzabek et al. [Reference Jarzabek, Chmielewski, Dulnik and Strojny-Nedza6] further observed that large particles correspond to higher interface strength which discourages interface debonding and negatively influence the fracture toughness of MMCs. Alaneme and Aluko [Reference Alaneme and Aluko7] reported that interface debonding is a beneficial failure mechanism which can lead to improved fracture toughness of MMCs. This is because the propagation of interface microcracks to the ductile matrix causes more pronounced plastic deformation which largely contributes to the toughening of composite materials. In addition to the experimental studies, a number of numerical investigations have been performed, largely with the intent of predicting the fracture behavior of MMCs given the mechanical properties of the matrix and reinforcement phases. Ayyar and Chawla [Reference Ayyar and Chawla8] conducted a series of 2D microscale simulations of MMCs by considering the effect of particle orientation, shape, and size on crack growth. They found that a homogenous particle distribution with minimum particle clustering would be preferential for enhancing the crack growth resistance. Sozhamannan et al. [Reference Sozhamannan, Prabu and Paskaramoorthy9] studied the fracture behavior of MMCs based on a 2D elastic–plastic finite element model. Their simulation results confirm that large particles are more prone to fracture due to the large stress concentration and high strain hardening rate around the particles and increased area of contact. It is worth noting that fracture is inherently a 3D problem. 2D models, which assume plane strain conditions, cannot capture the 3D morphology of microstructural details or realistically track the crack–material interactions due to nonplanar crack extension. Romanova et al. [Reference Romanova, Balokhonov and Schmauder1] studied the influence of reinforcing particle shape and interface strength on the fracture behavior of a MMC through 3D calculations. This work only focused on idealized microstructure configurations and fracture patterns. Li et al. [Reference Li, Ghosh, Richmond, Weiland and Rouns10] developed a 3D model which allows representation and characterization of realistic 3D microstructures of particle reinforced MMCs. However, this model does not explicitly account for microstructural level crack propagation.
In this paper, a 3D multiscale modeling technique is introduced to resolve different failure mechanisms in MMCs. This approach includes 3D microstructure generation, meshing, and cohesive finite element method based micromechanical simulations. The 3D model developed here allows representation of both realistic and idealized microstructure configurations. It also allows explicit tracking of crack propagation in the microstructure. For good delineation of microstructural features and realistic prediction of crack trajectories, unstructured tetrahedral meshes are generated using the open source code iso2mesh [Reference Fang and Boas11]. Cohesive elements with bilinear traction-separation laws are embedded in the microstructure region so as to resolve different failure mechanisms and microcrack patterns. This 3D multiscale framework allows quantification of energy dissipations through explicit simulation of fracture process in the microstructure region. The modeling approach developed here provides new insights into the physical aspects of competition between different failure mechanisms and their correlations with plastic deformation and microstructural properties.
Cohesive finite element based 3D multiscale modeling
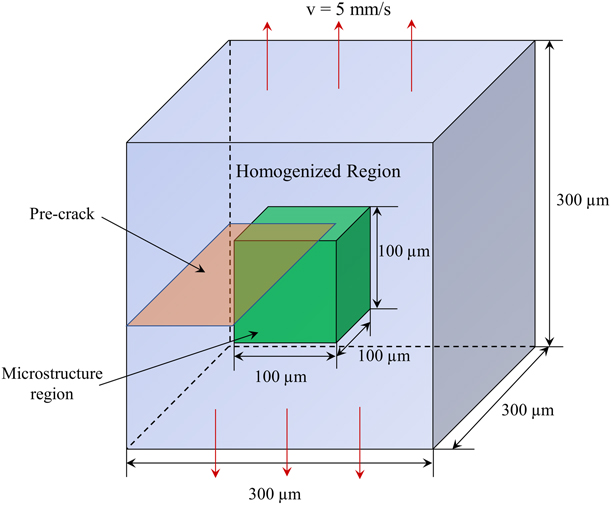
An edge-cracked specimen under Mode I static tensile loading is illustrated in Fig. 1. This model includes both the microstructure region and the homogenized region. The microstructure region is a cube with dimension of 100 µm. It is embedded in the homogenized region, which is also a cube with a dimension of 300 µm. The precrack plane has a length of 125 µm and a width of 300 µm. A boundary velocity of v = 5 mm/s is imposed at the top and bottom surfaces of the specimen to effect symmetric Mode I tensile loading. The remaining surfaces of the specimen are traction-free. Conditions of plane strain are assumed to prevail. The configuration illustrated in Fig. 1 allows explicit representation of microstructures and account for microstructural level of deformation, damage, and failure mechanisms, while allowing macroscopic conditions such as controlled loading and structural response to be considered at the same time.
Scheme of specimen configuration in the analysis.

Constitutive modeling of bulk matrix
Johnson–Cook model is employed to describe the constitutive behavior of bulk aluminum matrix. This model considers the separated effects of strain hardening and thermal softening as
 $$\bar{\sigma } = \left[ {A + B{{\left( {{{\bar{\varepsilon }}^{{\rm{pl}}}}} \right)}^n}} \right]\left( {1 - {{\hat{T}}^m}} \right)\quad ,$$
where  $\bar{\sigma }$ and
 ${\bar{\varepsilon }^{{\rm{pl}}}}$ are the static yield stress and equivalent plastic strain, respectively. A, B, m, and n are the material parameters, which are determined based on the flow stress data obtained from mechanical tests.
 $\hat{T}$ is the nondimensional temperature defined as
 $$\hat{T} = \left\{ {\matrix{ 0 \hfill & {{\rm{for}}} \hfill & {T \lt {T_{{\rm{tran}}}}} \hfill \cr {{{\left( {T - {T_{{\rm{tran}}}}} \right)} / {\left( {{T_{{\rm{melt}}}} - {T_{{\rm{tran}}}}} \right)}}} \hfill & {{\rm{for}}} \hfill & {{T_{{\rm{tran}}}} \le T \le {T_{{\rm{melt}}}}} \hfill \cr 1 \hfill & {{\rm{for}}} \hfill & {T > {T_{{\rm{melt}}}}} \hfill \cr} } \right.\quad ,$$
Here, T is the current temperature, T melt is the melting temperature, and T tran is the transition temperature defined as the one at or below which there is no temperature dependence of the yield stress [12]. It should be noted that A, B, m, and n are measured at or below the transition temperature T tran. The material parameters are summarized in Table I [Reference Ghandehariun13]. The Young’s modulus E m and Poisson’s ratio νm of Al matrix are chosen as 73 GPa and 0.33, respectively.
Johnson–Cook material parameters for Al matrix.

Constitutive modeling of bulk reinforcements
Bulk SiC reinforcements follow isotropic linear elastic constitutive relations as
 $${\bf{\boldsigma }} = {{{E_{\rm{p}}}} \over {1 + {\nu _{\rm{p}}}}}{\bf{\boldvarepsilon }} + {{{\nu _{\rm{p}}}{E_{\rm{p}}}} \over {\left( {1 + {\nu _{\rm{p}}}} \right)\left( {1 - 2{\nu _{\rm{p}}}} \right)}}{\rm{tr}}\left( \varepsilon \right){\bf{I}}\quad ,$$
where σ and ε are the stress and strain tensors, respectively. tr(ε) is the trace of ε and I is the second order identity tensor. The Young’s modulus E p and Poisson’s ratio νp of SiC reinforcement are chosen as 410 GPa and 0.14, respectively.
Constitutive modeling of cohesive elements
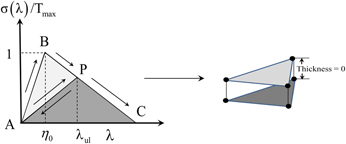
Cohesive finite element method has been extensively used to model crack propagation in different types of materials [Reference Li and Zhou14, Reference Guo, Chang, Chen and Zhou15, Reference Needleman, Nutt, Suresh, Tvergaard, Suresh, Mortensen and Needleman16, Reference Li and Zhou17]. Generally speaking, there are two approaches exist for embedding cohesive elements in the bulk elements when the crack paths are unknown a priori. One method is to insert cohesive elements in front of the crack tip as the crack develops [Reference Shor and Vaziri18, Reference Pandolfi19]. This method can avoid cohesive surface-induced stiffness reduction of the overall model. However, it is computationally expensive and requires specific fracture initiation criteria that are extrinsic to the overall finite element model. Another method is to embed cohesive elements in any surface which is shared by two bulk elements [Reference Zhai, Tomar and Zhou20, Reference Li, McDowell and Zhou21]. Cohesive elements become part of the physical model as fracture emerges as a natural outcome of the deformation process without the use of any failure criterion. In this paper, we employ the second method by permeating cohesive elements in the microstructure region. The cohesive constitutive law takes the form of a bilinear relation between traction and separation, as illustrated in Fig. 2. This is an idealization that can be modified to accommodate more detailed and quantitative information regarding, for example, interfacial property by adjusting the cohesive strength or separation energy. The cohesive law is derived from a potential, Φ, which is a function of the separation vector Δ through a state variable defined as  $\lambda = \sqrt {{{\left( {{{{\Delta _{\rm{n}}}} / {{\Delta _{{\rm{nc}}}}}}} \right)}^2} + {{\left( {{{{\Delta _{\rm{t}}}} / {{\Delta _{{\rm{tc}}}}}}} \right)}^2}}$. This variable describes the effective instantaneous state of mixed-mode separations. Here, Δn = n·Δ and
 ${\Delta _{\rm{t}}} = {\rm{\ }}\sqrt {{{\left( {{\Delta _{\rm{p}}}} \right)}^2} + {{\left( {{\Delta _{\rm{q}}}} \right)}^2}} = \sqrt {{{\left[ {\left( {{\bf{\boldDelta }} - \left( {{\bf{\boldDelta }} \cdot {\bf{n}}} \right){\bf{n}}} \right) \cdot {\bf{p}}} \right]}^2} + {{\left[ {\left( {{\bf{\Delta }} - \left( {{\bf{\Delta }} \cdot {\bf{n}}} \right){\bf{n}}} \right) \cdot {\bf{q}}} \right]}^2}} = \left| {{\bf{\Delta }} - \left( {{\bf{\Delta }} \cdot {\bf{n}}} \right){\bf{n}}} \right|$, respectively, denote the normal and tangential components of Δ, with n being the unit normal, and p and q being the two unit tangential vectors. Note that n, p, and q are mutually orthogonal to each other and form a right-handed triad. Δnc is the critical normal separation at which the cohesive strength of an interface vanishes under conditions of pure normal deformation (Δt = 0). Similarly, Δtc is the critical tangential separation at which the cohesive strength of an interface vanishes under conditions of pure shear deformation (Δn = 0). T max represents the maximum traction that the cohesive element can sustain at the onset of irreversible separation.
Bilinear traction-separation law for cohesive elements.
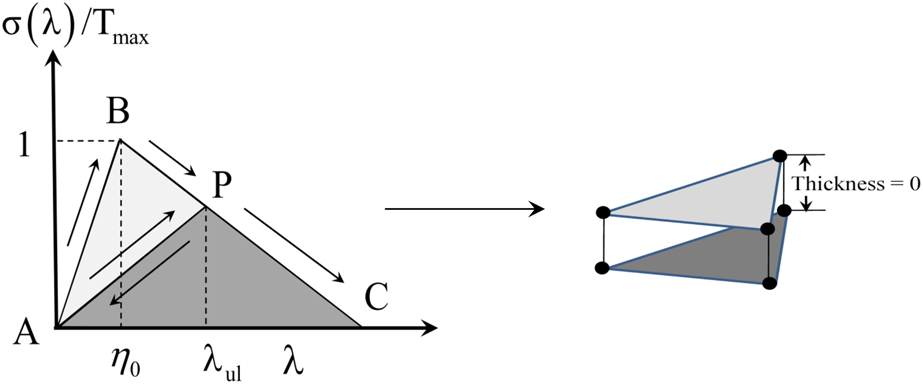
In order to account for the irreversibility of separations, a parameter η = max{η0, λul} is defined. As illustrated in Fig. 2, η0 is the initial value of η which defines the stiffness of the original undamaged cohesive surface, while λul is the hitherto maximum value of λ at which an unloading process was initiated. It should be noted that λul is associated with the onset of an unloading event and is not necessarily the hitherto maximum value of λ. λul represents the current (reduced) stiffness of the cohesive surfaces after damage and unloading have occurred. Furthermore, η0 represents the characteristic value of effective separation λ at which the effective traction σ for a cohesive surface pair reaches the strength reaches the strength T max of the undamaged surface. λul stands for the critical level of λ at which σ reaches the reduced strength T max(1 − η)/(1 − η0) of the hitherto damaged cohesive surface pair. The specific expression for potential Φ is of the form
 $$\Phi = \Phi \left( {\lambda ,\eta } \right) = \left\{ {\matrix{ {{\Phi _0}\left( {{{1 - \eta } \over {1 - {\eta _0}}}} \right)\left( {{{{\lambda ^2}} \over \eta }} \right)} \hfill & {{\rm{if}}} \hfill & {0 \le \lambda \le \eta } \hfill \cr {{\Phi _0}\left( {{{1 - \eta } \over {1 - {\eta _0}}}} \right)\left( {1 - {{{{\left( {1 - \lambda } \right)}^2}} \over {1 - \eta }}} \right)} \hfill & {{\rm{if}}} \hfill & {\eta \le \lambda \le 1} \hfill \cr 0 \hfill & {{\rm{if}}} \hfill & {\lambda > 1} \hfill \cr} } \right.\quad .$$
As indicated in Fig. 2, separation occurs elastically and the cohesive energy stored (work done in causing separation) is fully recoverable between A and B (0 ≤ λ ≤ η0), and damage in the form of microcracks and other small-scale defects does not occur. Between B and C (η0 ≤ λ ≤ 1), material degradation causes progressive reduction in the strength of the cohesive surfaces. This represents a phenomenological account of the effects of microcracks and other defects not explicitly modeled in the cohesive finite element model. Unloading from any point P follows path PA and subsequent reloading follows AP and then PC. Part of the work expended on causing the separation in this regime is irreversible, as indicated by the hysteresis loop ABP which implies dissipation during the softening process. Correspondingly, there is a decrease in the maximum tensile strength of the cohesive surface. This is reflected in the elastic reloading of the interface along AP and further softening along path PC.
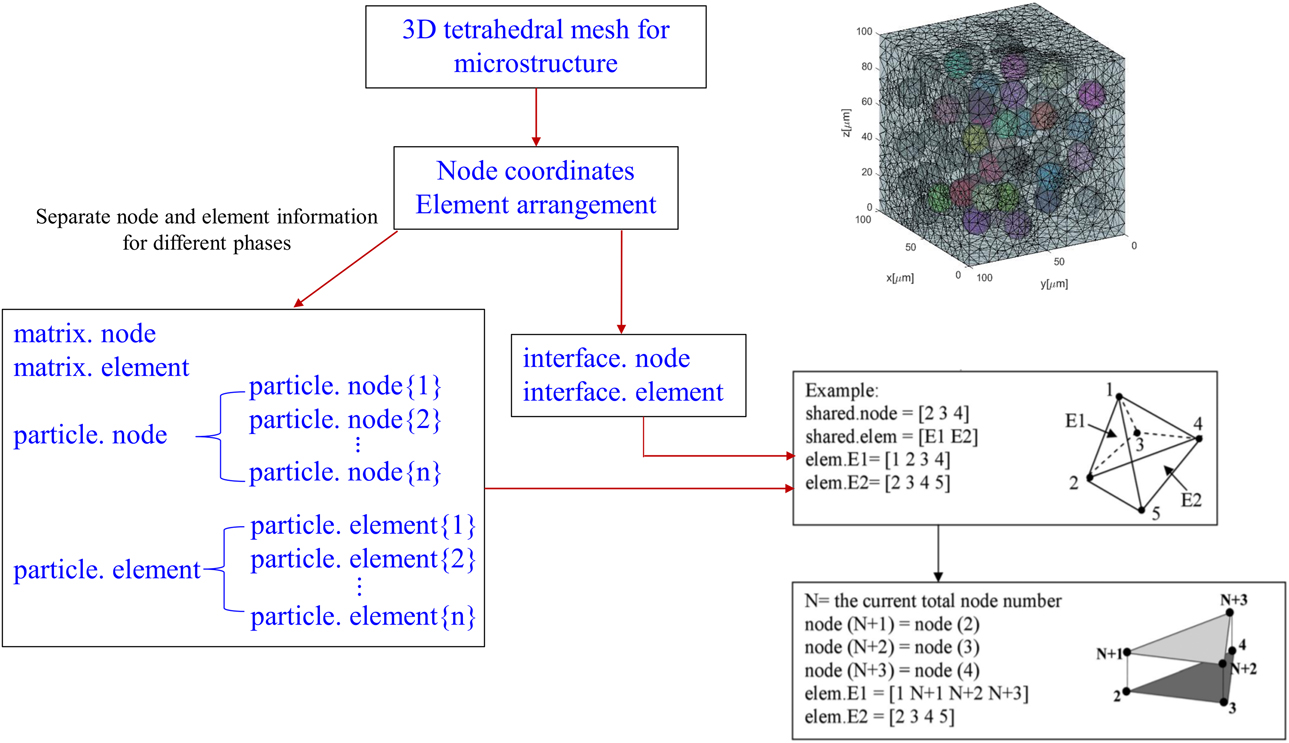
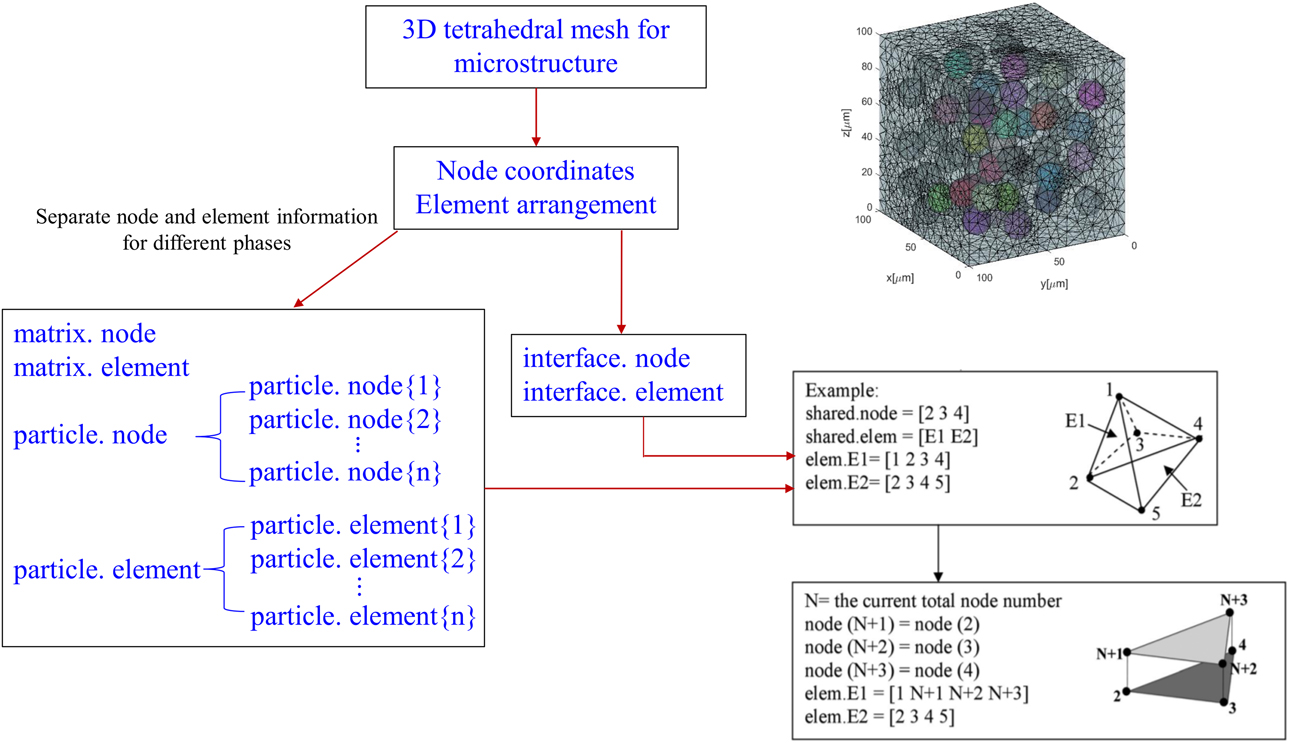
Introducing cohesive surfaces to the complex 3D microstructure meshes requires extensive node relabeling and changes in elemental connectivity. An algorithm is developed to automatically insert 3D cohesive element in the microstructure region and assign corresponding cohesive law based on the material phase property. In a two-phase MMC microstructure, there are three cohesive laws exist: cohesive laws in the matrix, in the reinforcement, and along the interface. This process includes the following steps: (i) extract the existing nodal coordinates and element arrangement of the microstructure; (ii) separate all nodes and elements in three sets: matrix, reinforcement, and interface. Further separate the reinforcement set for each particle; (iii) define the location where cohesive elements are inserted and sorted out all the shared faces and related element indices; (iv) duplicate the nodes in the shared faces and redistribute the node label to the elements that share the face. Update the ABAQUS inp file by adding the new node information to the *Node section and updating the node connectivity in the *Element section. As illustrated in Fig. 3, element 1 and element 2 share the same face with node 2, 3, and 4. Assume N is the current total node number. Node N + 1, N + 2, and N + 3 are cloned from node 2, 3, and 4, respectively. When distributing the duplicated nodes to elements (element 1 and element 2 in this case), the node labels in each element are only allowed to update once. For example, node 2 can be the member of another shared face in addition to face (2 3 4). Once node 2 in element 1 is replaced with node N + 1, it is no longer allowed to be replaced by another duplicated node afterward. This duplicated node can only be redistributed to the other element which shared the face. The cohesive element is generated by connecting the six nodes in a counterclockwise direction. As illustrated in Fig. 3, each cohesive element follows the numbering pattern as [2 3 4 N + 1 N + 2 N + 3]. It is assumed that all the 6-node cohesive elements (COH3D6) have zero thickness.
Algorithm for insertion of cohesive elements in the microstructure.
Constitutive modeling in the homogenized region
The homogenized region as shown in Fig. 1 does not include any cohesive element. The effective properties in this region are estimated by using the Mori–Tanaka method [Reference Qu and Cherkaoui22]. Specifically, the effective bulk and shear moduli are
 $$\left\{ {\matrix{ {\bar{K} = {K_0} + {{f\left( {{K_1} - {K_0}} \right)\left( {3{K_0} + {\mu _0}} \right)} \over {3{K_0} + 4{\mu _0} + 3\left( {1 - f} \right)\left( {{K_1} - {K_0}} \right)}}} \hfill \cr {\bar{\mu } = {\mu _0} + {{5f{\mu _0}\left( {{\mu _1} - {\mu _0}} \right)\left( {3{K_0} + 4{\mu _0}} \right)} \over {5{\mu _0}\left( {3{K_0} + 4{\mu _0}} \right) + 6\left( {1 - f} \right)\left( {{\mu _1} - {\mu _0}} \right)\left( {{K_0} + 2{\mu _0}} \right)}}} \hfill \cr} } \right.\quad ,$$
Here, f is the volume fraction of reinforcement particles. K r and μr represent the bulk and shear moduli for matrix (r = 0) and reinforcements (r = 1), respectively.
The homogenized Young’s modulus  $\bar{E}$ and Poisson’s ratio
 $\bar{\nu }$ are calculated according to
 $$\left\{ {\matrix{ {\bar{E} = {{9\bar{K}\bar{\mu }} \over {3\bar{K} + \bar{\mu }}}} \hfill \cr {\bar{\nu } = {{3\bar{K} - 2\bar{\mu }} \over {6\bar{K} + 2\bar{\mu }}}} \hfill \cr} } \right.\quad .$$
It is assumed that the yield criteria in the homogenized region follow J2 plasticity without considering strain rate dependency or the influence of temperature [Reference Borja23]. The yield function f is formulated as
 $$f\left( {\bf{s}} \right) = \left\| {\bf{s}} \right\| - \sqrt {{2 \over 3}} {\sigma _{\rm{y}}}\quad ,$$
Here, s is the deviatoric stress tensor and  $\left\| {\bf{s}} \right\|$ denotes the norm of the stress deviator. σy is the initial yield stress of MMCs. According to Nardone and Prewo [Reference York Duran, Kuhn and Müller24], σy can be estimated by considering the microstructure effect as
 $${\sigma _{\rm{y}}} = \sigma _{\rm{y}}^{\rm{m}}\left[ {{{f\left( {S + 2} \right)} / {2 + \left( {1 - f} \right)}}} \right]\quad ,$$
where  $\sigma _{\rm{y}}^{\rm{m}}$ is the yield stress of matrix. In the following calculations,
 $\sigma _{\rm{y}}^{\rm{m}} = 177.5\;{\rm{MPa}}$ is employed. S is defined as the aspect ratio. For spherical SiC particles, S = 1 is considered. f represents the volume fraction of SiC particles. The homogenized region and microstructure region are connected using mesh tie constraint which requires no conformity of node connections.
Although a simplified constitutive model is employed, this framework allows the microstructure effect on the overall response of MMCs to be quantified. A more advanced homogenization method, though more realistic and considers more factors, would also complicate an initial study aimed at developing a 3D approach for relating microstructure to macroscopic fracture toughness because of its large number of parameters. But the capability of the current framework can be extended to address hardening and material rate dependency during the deformation and failure process.
Evaluation of fracture toughness from crack tip opening displacement
Crack tip opening displacement (CTOD) has been widely used to measure material fracture toughness. According to ASTM E1290-08e1 [25] and Panontin et al. [Reference Panontin, Makino and Williams26],
 $${\delta _{\rm{c}}} = {\delta _{{\rm{el}}}} + {\delta _{{\rm{pl}}}}\quad ,$$
Here, δc is the critical CTOD. δel and δpl represent the elastic and plastic parts of the CTOD, respectively.
The elastic part of CTOD δel can be computed by the following:
 $${\delta _{{\rm{el}}}} = {{K_{\rm{I}}^2\left( {1 - {{\bar{\nu }}^2}} \right)} / {2\bar{E}{\sigma _{\rm{y}}}}}\quad ,$$
where the effective Young’s modulus  $\bar{E}$ and effective Poisson’s ratio
 $\bar{\nu }$ of MMCs are calculated according to Eq. (6). The initial yield stress of MMCs σy is estimated based on Eq. (8). K I is the stress intensity factor and can be numerically calculated according to
 $${K_{\rm{I}}} = {\sigma _{ij}}\left[ {{{{{\left( {2\pi r} \right)}^{{1 / 2}}}} / {g_{ij}^{\rm{I}}\left( \theta \right)}}} \right]\quad ,$$
where  $g_{ij}^{\rm{I}}\left( \theta \right)$ is the function of θ and σij is the stress value of the node having maximum displacement at radius r and angle θ.
The plastic portion of CTOD δpl is determined by assuming that the uncracked ligament works like a plastic hinge with its center at a distance r plb from the crack tip. Specifically, δpl is calculated as
 $${\delta _{{\rm{pl}}}} = {{{r_{{\rm{pl}}}}b} / {\left( {{r_{{\rm{pl}}}}b + a} \right){V_{{\rm{pl}}}}}}\quad ,$$
Here, r pl, b, and a are defined as the plastic rotational factor, ligament length, and precrack length, respectively. In this paper, r pl = 0.5, b = 200 μm, and a = 125μm are considered. The crack mouth opening displacement V pl can be extracted from the load–displacement curve as discussed in detail in ASTM E1290-08e1 [25].
Results and discussions
In the following analysis, the fracture toughness K IC of Al matrix and SiC particles are selected as 25 MPa m1/2 and 4.6 MPa m1/2, respectively [Reference Bucci27, 28]. The fracture energy rate Φ of each phase is estimated according to
 $$\Phi = J = {{\left( {1 - {\nu ^2}} \right)K_{{\rm{IC}}}^2} / E}\quad .$$
Based on the material properties provided in sections “Constitutive modeling of bulk matrix” and “Constitutive modeling of bulk reinforcements”, the fracture energy rates in Al matrix and SiC particles are calculated as 7.63 × 10³ N/m and 50.6 N/m, respectively. The maximum traction T max is obtained from 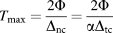 ${T_{\max }} = {{2\Phi } \over {{\Delta _{{\rm{nc}}}}}} = {{2\Phi } \over {\alpha {\Delta _{{\rm{tc}}}}}}$, where α is defined as Δnc/Δtc and is assumed to be 1. It should be noted that both the normal and shear separations should not exceed the element size in the microstructure region so that cohesive surfaces can achieve complete debonding during the fracture process. In our model, Δnc = Δtc ∈ (1, 5) μm is a reasonable separation range.
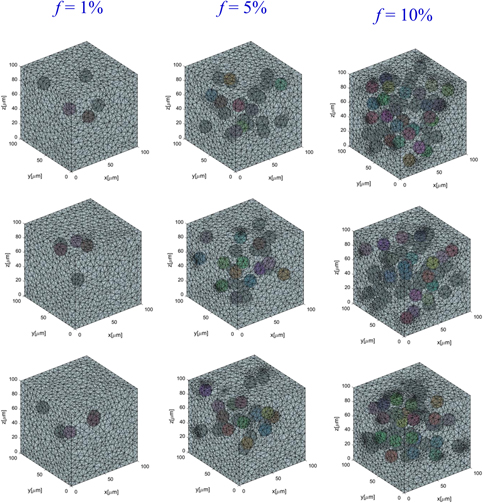
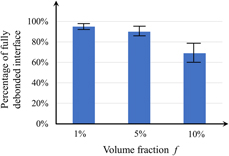
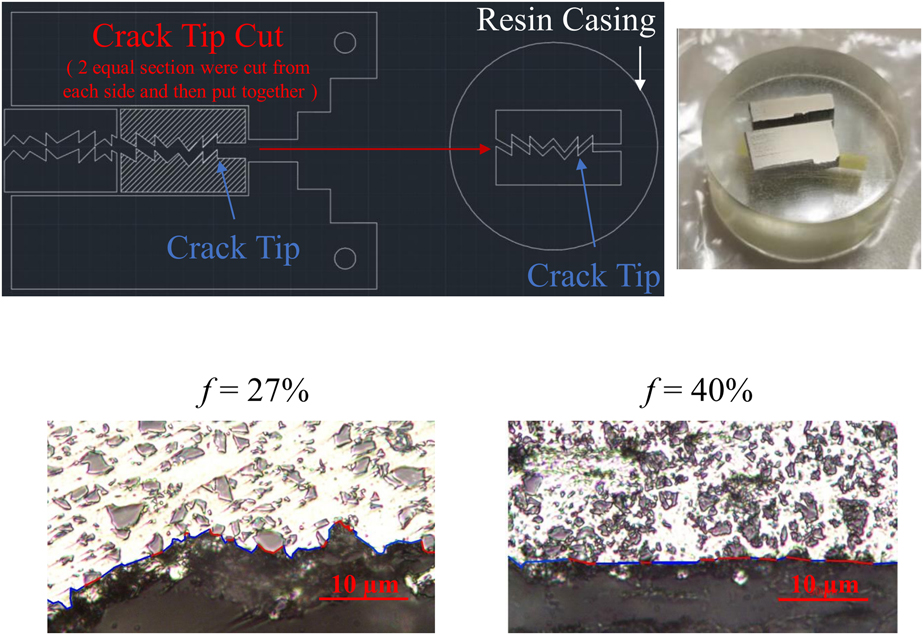
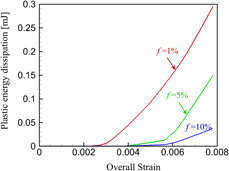
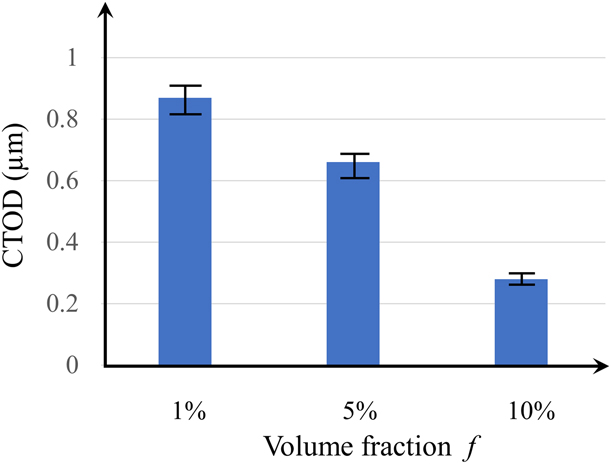
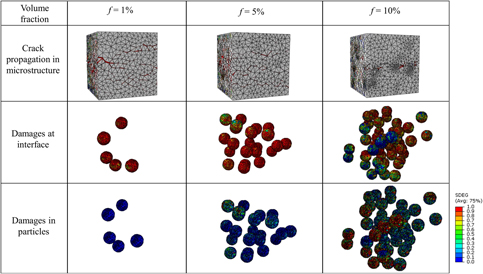
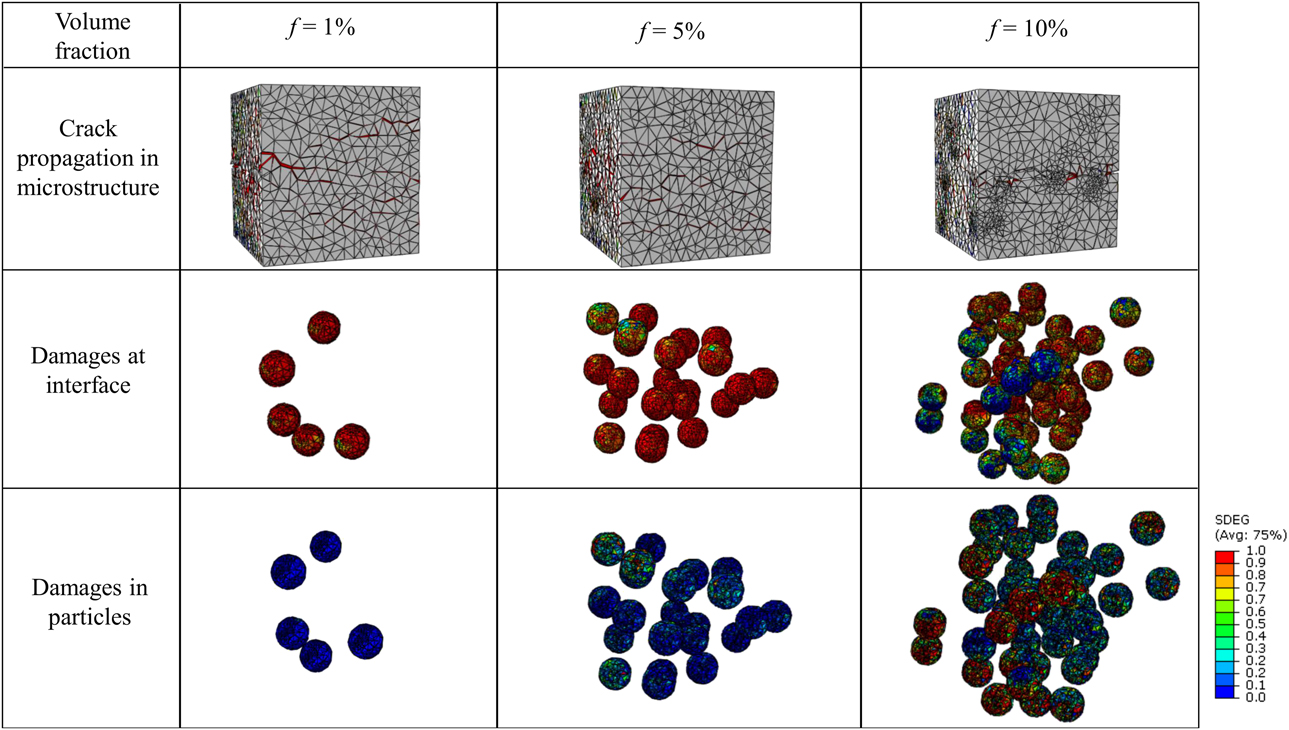
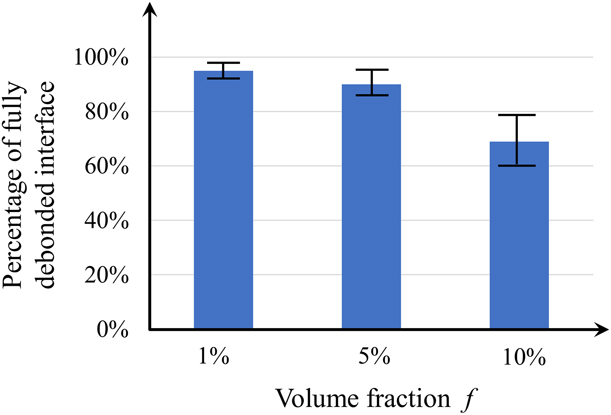
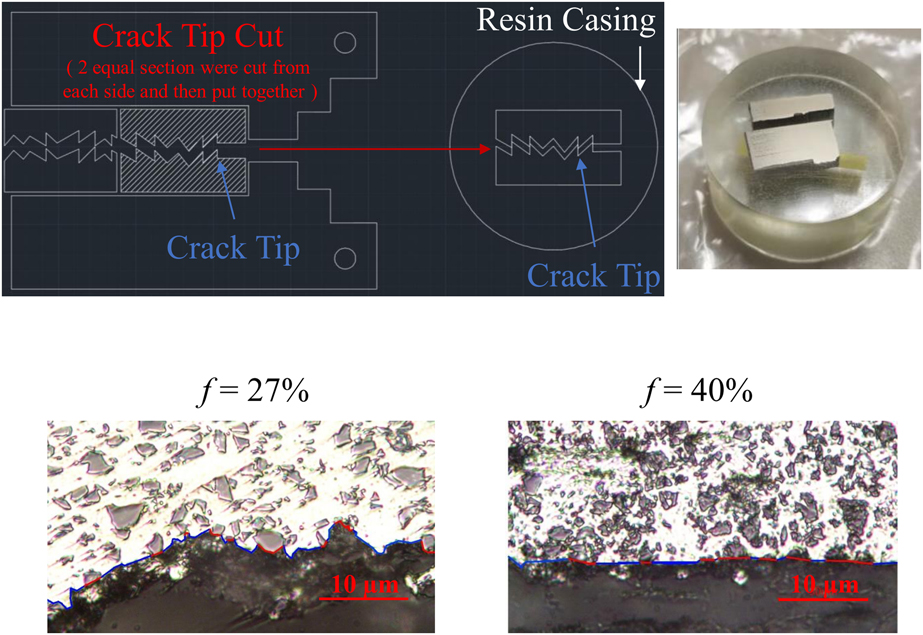
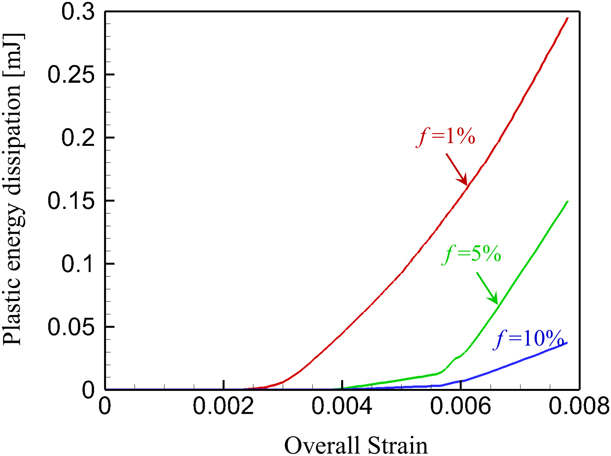
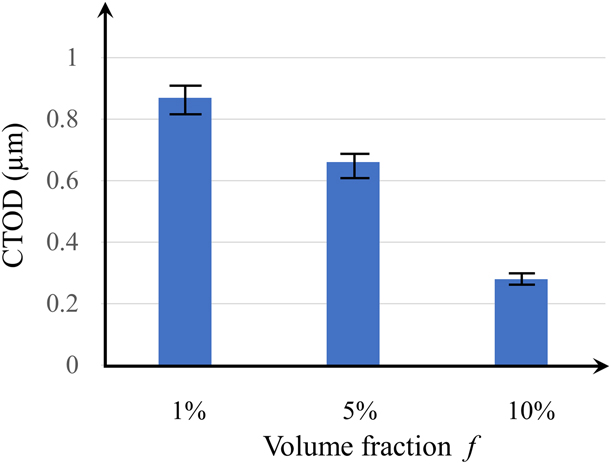
In the following calculations, interfacial fracture energy rate Φ = 10.12 N/m is considered. 3D microstructures with spherical particles are systematically generated by choosing a particle radius of 8 µm and a volume fraction f of 1%, 5%, and 10%, respectively. In order to account for stochastic variation of fracture behavior at the microstructural level, 20 random microstructure instantiations (samples) under each volume fraction are generated and implemented in the multiscale model. Figure 4 shows a few microstructure instantiations which are selected from each volume fraction group. As indicated in Fig. 5, the crack tends to propagate along the precrack plane as the particle volume fraction increases. The crack trajectory is relatively localized when f = 10%. As the particle volume fraction decreases, the crack trajectory becomes more tortuous as microcracks start to initiate at places that are further away from the precrack plane. It is also noted from Fig. 5 that more intensive interface debonding is observed when the particle volume fraction is low. Here, SDEG (a computational variable in the ABAQUS software) is a parameter, which quantifies the degree of damages in cohesive elements. Specifically, SDEG = 1 represents fully debonded cohesive surfaces when the traction stress drops to 0 (point C in Fig. 2). It signifies complete failure of the cohesive element and formation of a crack. Regions with SDEG < 1 do not represent actual crack formation but can be considered as potential sites for microcracks. According to Fig. 6, the average percentage of fully debonded interface is 95.3% when the corresponding particle volume fraction f = 1%. This percentage decreases to 68.7% when f increases to 10%. It is also worth noting that interface debonding and particle cracking are two competing failure mechanisms. As shown in Fig. 5, when f = 1%, no particle cracking is observed when nearly complete interface debonding is activated. As f increases, particle cracking starts to emerge and gradually interface debonding takes place. The simulation results indicate that particles with complete interface debonding can effectively survive fracture. This trend is supported by a few experimental results of MMCs [Reference Wu, Ma, Wu, Fang, Luo, Chen, Shen, Zhang, Schoenung and Lavernia29, Reference Milan and Bowen30, Reference Hall, Jones and Sachdev31, Reference Li, Cao and Williams32]. As shown in Fig. 7, the surfaces near the precrack tip of two fractured compact tension (CT) MMC specimens are polished so that both the microstructure features and the crack trajectory are well observed from the microscope. It is noticed that the specimen with lower particle volume fraction exhibit more tortuous crack path and a higher percentage of interface debonding. In contrast, the increase of particle volume fraction leads to straighter crack trajectory and more intensified particle cracking. From the energy point of view, a crack can grow only when the energy available at the crack tip is sufficient to balance out the energy required for crack propagation. For brittle materials such as ceramic composites, the most effective way to improve fracture toughness is to create tortuous crack paths since, in the absence of plasticity, the total energy released is transformed into surface energy alone. For MMCs, the fracture resistance depends on the sum of energy spent on both surface generation and plastic deformation in the ductile matrix. As indicated in Fig. 8, higher volume fraction of the brittle SiC particles leads to lower plastic energy dissipation and therefore, lower fracture resistance of the entire materials. This result agrees well with a few experimental findings that particle cracking suppresses plastic deformation in the ductile matrix and negatively influences the material fracture toughness [Reference Jarzabek, Chmielewski, Dulnik and Strojny-Nedza6, Reference Sozhamannan, Prabu and Paskaramoorthy9, Reference Song and Huang33, Reference Babout, Ludwig, Maire and Buffière34]. According to section “Evaluation of fracture toughness from CTOD”, the CTOD values measured from each particle volume fraction group are summarized in Fig. 9. It is noted that CTOD decreases with particle volume fraction f. This indicates that the material response is more brittle with increasing f. The higher volume fraction of brittle phase leads to lower level plastic deformation in the matrix; therefore, it creates favorable condition for particle cracking which negatively influences the material fracture toughness. In addition, the CTOD values tend to be more scattered when f decreases. This is expected as the crack trajectory becomes more localized when particle cracking wins the competition during the crack–particle interactions.
Illustration of selective 3D microstructures with different particle volume fractions.

Crack propagation in microstructures and damages in particles and along the interface.
Effect of particle volume fraction on the percentage of fully debonded interface.
Experimentally observed crack trajectory of Al/SiC MMCs under different SiC volume fractions.
Plastic energy dissipation at various particle volume fractions.
Effect of particle volume fraction on CTOD.
It can be concluded that interface debonding is a beneficial mechanism for both strengthening and toughening of MMCs. Particle cracking adversely affects material strength since cracked particles lose the capability to carry load. Interface debonding, on the other hand, alleviates stress concentration in the particle phase and promotes microcrack initiation and propagation to the matrix phase, leading to more intensified plastic energy dissipation. In addition, the coalescence of microcracks can lead to higher surface energy dissipation as a result of tortuous crack paths. The above conclusions can be supported by our simulation results and other experimental observations [Reference Qian, Kobayashi, Toda, Goda and Wang5, Reference Jarzabek, Chmielewski, Dulnik and Strojny-Nedza6, Reference Alaneme and Aluko7].
Summary
A cohesive finite element based multiscale framework is developed to simulate crack propagation in Al/SiC MMCs. This framework allows explicit representation of microstructure and resolution of different failure mechanisms. Simulation results indicate that interface debonding can positively contribute to the toughening of MMCs. This failure mechanism not only creates tortuous crack paths via crack deflection and coalescence of microcracks with the precrack but also leads to more pronounced plastic deformation, which largely contributes to the toughening of composite materials. The methodology is potentially useful for development of high toughness MMCs through selection of materials and tailoring of microstructures.
Acknowledgment
This research is primarily supported by the Army Research Office through contract No. W911NF-16-1-0541. The financial and technical support from the Impact Physics Branch of the Army Research Lab at Aberdeen Proving Ground is highly appreciated. The funding support from HSI STEM Program and ORSP Summer Research Program at California State University, Long Beach is acknowledged as well.