Introduction
Kozłowskiite, ideally Ca4(Fe2+Sn3)(Si2O7)2(Si2O6OH)2 (Z = 2), is a new mineral isostructural with kristiansenite, Ca2ScSn(Si2O7)(Si2O6OH) and silesiaite, Ca2Fe3+Sn(Si2O7)(Si2O6OH) (Z = 4), found in pegmatites at Szklarska Poręba, Lower Silesia, Poland (IMA2021-081; Pieczka et al., Reference Pieczka, Zelek-Pogudz, Gołębiowska, Stadnicka and Evans2022). The mineral is named after Andrzej Kozłowski, an Emeritus Professor at the Faculty of Geology, Department of Geochemistry, Mineralogy and Petrology, University of Warsaw, Poland, born in 1946. He is an eminent Polish geologist specialising in geochemistry, mineralogy, petrology and mineral deposits, and one of the first Polish geologists to study pegmatites of the Karkonosze granite massif, including those exposed in the Szklarska Poręba Huta quarry, i.e. the type locality for silesiaite and kozłowskiite. Professor A. Kozłowski is also the main promoter of the Inter-Institute Analytical Complex for Minerals and Synthetic Substances of the University of Warsaw (2000), which made electron-probe microanalysis possible for many Polish researchers and yielded international scientific collaboration.
In the classification of Strunz and Nickel (Reference Strunz and Nickel2001), kozłowskiite classifies along with kristiansenite and silesiaite in class 09.BC: Sorosilicates with Si2O7 groups, without non-tetrahedral anions, cations in octahedral [6] and higher coordination. In the classification of Dana (Gaines et al., Reference Gaines, Skinner, Foord, Mason and Rosenzweig1997), it belongs to the class 56.02: Sorosilicate Si2O7 groups and O, OH, F and H2O with cations in [4] and/or >[4] coordination, group 04: Cuspidine–Wohlerite. The silesiaite + kozłowskiite holotype (specimen SP5) is deposited in the collection of the Mineralogical Museum of University of Wrocław, catalogue number MMUWr IV7929. The postal address of the museum is as follows: University of Wrocław, Faculty of Earth Science and Environmental Management, Institute of Geological Sciences, Mineralogical Museum, 50-205 Wrocław, Cybulskiego, Poland.
Occurrence
Kozłowskiite was collected around 2002 in a pegmatite of the Karkonosze granite in the Szklarska Poręba Huta quarry (50.82778°N, 15.48944°E) in Lower Silesia, SW Poland. The Karkonosze granite is the largest Variscan pluton in the Western Sudetes at the north-eastern margin of the Bohemian Massif. The pluton is considered as a syn-collisional to magmatic arc intrusion on the margin of a continental platform neighbouring oceanic crust, formed by relatively reduced, K-rich, calc-alkaline, highly evolved, mostly peraluminous I- to transitional I–S-type magmas (Mazur et al., Reference Mazur, Aleksandrowski, Turniak and Awdankiewicz2007; Mikulski, Reference Mikulski2007; Słaby and Martin, Reference Słaby and Martin2008) of ~320–315 Ma (Machowiak and Armstrong, Reference Machowiak and Armstrong2007; Kryza et al., Reference Kryza, Pin, Oberc-Dziedzic, Crowley and Larionov2014; Kusiak et al., Reference Kusiak, Williams, Dunkley, Konečný, Słaby and Martin2014). The main rocks of the massif are biotite-bearing, porphyritic to equigranular granite associated with a small volume of two-mica granite, subordinate granophyre granite, and numerous lamprophyre and aplite dykes (Berg, Reference Berg1923; Borkowska, Reference Borkowska1966). Pegmatites occur within various granite facies, although they are particularly abundant in the porphyritic type and also penetrate the metamorphic cover.
The Szklarska Poręba Huta quarry, located within the town Szklarska Poręba, is currently the only place in the Polish part of the massif where granite is exploited, mainly as dimension stone. Small bodies of granitic NYF-type pegmatite in the form of lenses and nests up to several tens of centimetres across are relatively frequent within the coarsely-crystalline porphyritic to equigranular granite; smaller nests and mineralised quartz veinlets are frequent in finely crystalline aplogranite (Pieczka et al., Reference Pieczka, Szuszkiewicz, Szełęg, Janeczek and Nejbert2015). Here, the pegmatitic assemblage is commonly overprinted by W–Sn–Mo–Bi hydrothermal mineralisation (Karwowski et al., Reference Karwowski, Olszyński and Kozłowski1973; Kozłowski et al., Reference Kozłowski, Karwowski and Olszyński1975; Olszyński et al., Reference Olszyński, Kozłowski and Karwowski1976; Pieczka and Gołębiowska, Reference Pieczka and Gołębiowska2012). Kozłowskiite was found in an ore-mineralised pegmatite specimen related to aplogranite, in which kristiansenite and silesiaite had been recognised previously (Pieczka et al., Reference Pieczka, Ma, Rossman, Evans, Groat and Gołębiowska2017; Evans et al., Reference Evans, Gołębiowska, Groat and Pieczka2018). The mineral is accompanied by quartz, albite, andradite, allanite-(Ce), zircon, Sn-bearing titanite, malayaite, fergusonite-(Y), Sc-bearing columbite, clinochlore, bismuthinite, chalcopyrite and pyrite. Kozłowskiite is a hydrothermal mineral that preceded the crystallisation of the silesiaite–kristiansenite assemblage.
Appearance and physical properties
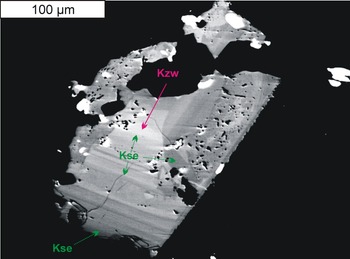
Kozłowskiite was recognised in a zoned silesiaite–kristiansenite crystal in a band at the core with sizes of 40 μm × 10 μm and atypical enrichment in Sn above 2.5 atoms per formula unit (apfu), calculated in relation to Z = 2 (Fig. 1). Kristiansenite crystals from Szklarska Poręba are usually highly inhomogeneous, composed of numerous thin alternating Sc-dominant (dark grey in back-scattered electron images, BSE) and Fe-dominant (light grey) bands. The observed oscillatory zoning seems to be a characteristic feature of kristiansenite-type minerals. It is also marked in the holotype kristiansenite from an amazonite pegmatite at Heftetjern, Tørdal, Telemark, Norway (Raade et al., Reference Raade, Ferraris, Gula, Ivaldi and Bernhard2002). However, zoning in the kristiansenite holotype is restricted to only the bands with more Sc- or those that are Fe3+-bearing, compositionally corresponding always to kristiansenite. In tiny pieces kozłowskiite is pale brownish; by analogy to kristiansenite it is likely to have a white streak and a Mohs hardness ≈ 6. No cleavage, parting, tenacity, or fracture was observed. Density and optical properties could not be measured due to the extremely small amount of the mineral. Density calculated on the basis of empirical formula and refined unit-cell volume is 3.775 g⋅cm–3. Kozłowskiite is biaxial, with a mean refractive index close to a value of 1.727 calculated from the Gladstone-Dale relation (Mandarino, Reference Mandarino1979, Reference Mandarino1981) using the empirical formula and calculated density. The value is comparable with the type kristiansenite mean refractive index of 1.74 (Raade et al., Reference Raade, Ferraris, Gula, Ivaldi and Bernhard2002).
Back-scattered electron image of type kozłowskiite (Kzw) (specimen number MMUWr IV7929). The Kzw band is overgrown by kristiansenite (Kse) and silesiaite (all other zones that are not labelled). White patches are inclusions of cassiterite and fersmite. Abbreviations of mineral names according to Warr (Reference Warr2021).

Composition of kozłowskiite
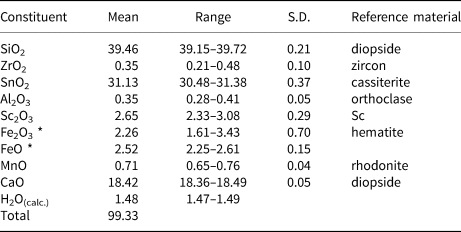
Quantitative chemical analyses of kozłowskiite were performed at the Inter-Institute Analytical Complex for Minerals and Synthetic Substances at the University of Warsaw, Poland, using a Cameca SX 100 electron microprobe (EMPA) operating in wavelength-dispersive X-ray spectrometry mode (WDS) with an accelerating voltage of 15 kV, a beam current of 20 nA, peak count-time of 20 s, background time of 10 s and a beam diameter of 2 μm (number of analyses N = 5). Reference materials, analytical lines, diffracting crystals and mean detection limits (element wt.%) were as follows: albite – Na (TAP, Kα, 0.02); diopside – Mg (TAP, Kα, 0.02), Si (TAP, Kα, 0.03) and Ca (PET, Kα, 0.04); orthoclase – Al (TAP, Kα, 0.03); rutile – Ti (PET, Kα, 0.09); rhodonite – Mn (LIF, Kα, 0.12); hematite – Fe (LIF, Kα, 0.12); LiNbO3 – Nb (PET, Lα, 0.10); LiTaO3 – Ta (TAP, Mα, 0.10); cassiterite – Sn (LPET, Lα, 0.07); zircon – Zr (LPET, Lα, 0.07); and pure Sc – Sc (LPET, Kα, 0.02). The contents of Na, Mg, Ti, Nb and Ta were below the detection limits. The raw data were reduced with the PAP routine of Pouchou and Pichoir (Reference Pouchou, Pichoir, Heinrich and Newbury DE1991). The presence of H2O was not analysed for due to the scarcity of the type material. The hydrogen atom positions were found from the Fourier-difference map during the X-ray structure analysis, and their parameters were refined using the riding model (Sheldrick, Reference Sheldrick2015b). The hydrogen atoms participate in the formation of hydrogen bonds, indicating the presence of 2 hydroxyls in the formula. Atomic contents in the empirical formula of kozłowskiite were normalised in relation to 26O + 2(OH) with a Fe3+/Fetotal ratio leading to 16 cations pfu. Compositional data on holotype material are given in Table 1.
Chemical data for kozłowskiite (in wt.%).

S.D. – standard deviation; * total Fe measured as Fe2O3 was equal to 5.06 wt.% (range: 4.51–5.93 wt.%; S.D.: 0.53 wt.%).
The empirical formula of kozłowskiite presented in the form of valence groups of octahedral cations is

The formula clearly indicates that a surplus of tetravalent octahedral cations above 2 apfu, which is typical for the kristiansenite structure, is connected with an equal amount of divalent cations, suggesting the substitution 2M3+ = M2+ + M4+ in accord with the valency-imposed double site-occupancy (Hatert and Burke, Reference Hatert and Burke2008). The simplified formula of kozłowskiite is Ca4[(Sc,Fe3+)2–2xFe2+xSn2+x)]Σ4(Si2O7)2(Si2O6OH)2; x > 0.5, and the ideal formula is Ca4(Fe2+Sn3)(Si2O7)2(Si2O6OH)2, which requires (in wt.%) CaO 17.99, FeO 5.76, SnO2 36.26, SiO2 38.55 and H2O 1.44, Total 100.
Raman spectroscopy
Raman spectra of kozłowskiite were collected in back-scattered geometry with a Horiba Labram HR spectrometer integrated with an Olympus BX 41 confocal microscope. The system was calibrated using the Rayleigh line. The spectra were recorded in the range of 50–4000 cm–1 using the 532 nm line of a solid-state Nd-YAG laser (10 mW), and 1800 grating on a randomly orientated section of the type crystal mounted in epoxy resin that was used previously for microprobe analysis and later partly extracted for X-ray diffraction structural studies. Prior to the Raman measurements, the carbon coating of the disc was removed. The Raman measurements were carried out by an accumulation of two scans, each with an acquisition time of 600 s at the microscope magnification ×100; the minimum lateral and depth resolution ≈1 μm, and an estimated analytical spot size of ~5 μm.
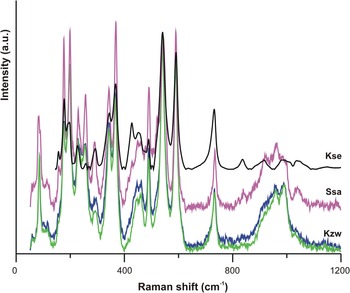
The spectrum of kozłowskiite (Fig. 2) is close to those of kristiansenite and silesiaite, which confirms that the three species (kristiansenite, silesiaite and kozłowskiite) share a common structure. No indication of OH groups was observed in the spectrum, which is similar to silesiaite and kristiansenite. The bands at Raman shifts of 1036, 989, 961 and 935 (broader) cm–1 correspond to asymmetric Si–O stretch, 838 and 733 (medium) cm–1 to symmetric Si–O stretch, 590 (strong), 542 (strong), 515, 491 (strong), 467 (broader), 445, 426, 367 (strong) and 344 (strong) to ν4 Si–O modes, and 291, 257 (medium), 242, 228 (medium), 215, 198 (strong), 177 (strong), 160, 117, 94 and 86 (medium) cm–1 to Si–O bending modes.
Raman spectra of kozłowskiite (Kzw; green and blue) compared to the spectrum of silesiaite (Ssa, magenta) and kristiansenite (Kse; black; RRUFF database R090022, https://rruff.info/). Kozłowskiite and silesiaite originate from the Szklarska Poręba Huta quarry, kristiansenite from the Heftetjern pegmatite, Tørdal, Telemark, Norway.

Powder X-ray diffraction data
Powder X-ray diffraction data could not be collected due to the scarcity of material. Therefore, they were only calculated from the refined single-crystal structure using the program Diamond Version 3.2k (Putz and Brandenburg, Reference Putz and Brandenburg2014) The seven strongest reflections are [d in Å (I) hkl]: 5.190 (73.2) 111, 1$\bar{1}$ 1; 4.569 (30.0) $\bar{2}$
 02; 3.153 (64.7) 004; 3.094 (28.1) $\bar{3}$
 11, $\bar{3}\bar{1}$
 1; 3.089 (100) $\bar{2}\bar{2}$
 2, $\bar{2}$
 22; 2.595 (27.2) 2$\bar{2}$
 2, 222; and 2.141 (30.6) $\bar{3}$
 31, $\bar{3}\bar{3}$
 1. Full calculated powder X-ray diffraction data has been deposited with the Principal Editors of Mineralogical Magazine and is available as Supplementary material (Table S1).
Single-crystal X-ray diffraction and structure determination
Sample preparation, data collection and refinement
The single crystal of kozłowskiite was cut using a Quanta 3D 200i (Thermo Fisher Scientific) scanning electron microscope equipped with a Ga+ ion gun, Pt precursor gas injection systems (GIS) and Omniprobe micromanipulator for in situ lift-out. An ion beam accelerating voltage of 30 kV and ion currents in the range of 60 nA to 1 nA were applied. The sample was then transferred via a micromanipulator to standard TEM copper half-ring grids. A FIB deposition process (from the Pt precursor) was used to attach the manipulator probe to the sample and the foil to the grid, and then the crystal was transferred to a suitable microloop and placed on the goniometer base.
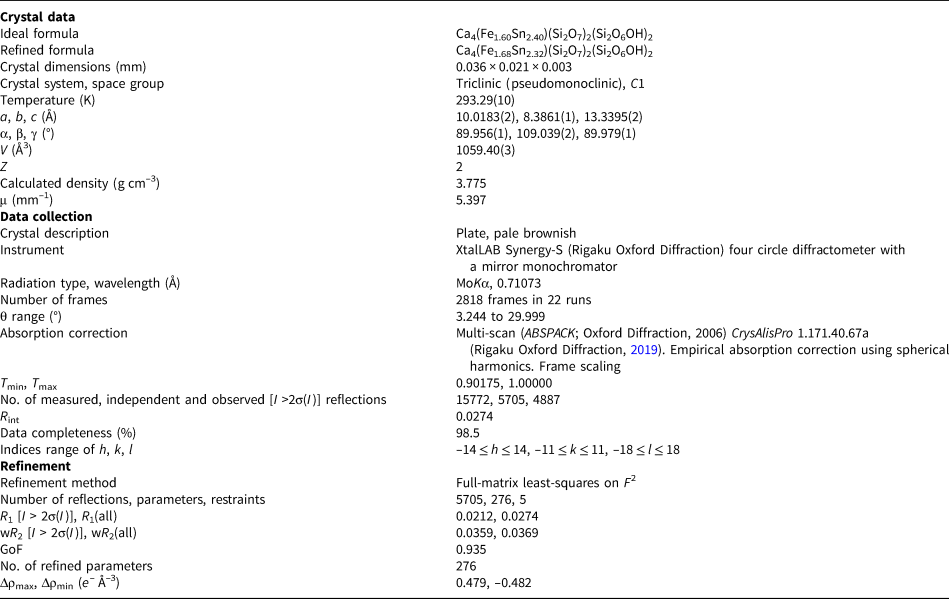
Single-crystal X-ray diffraction measurements were made at the Faculty of Chemistry, Jagiellonian University in Kraków on the kozłowskiite crystal of volume 0.036 mm × 0.021 mm × 0.003 mm. X-ray diffraction data for a single crystal were collected using XtalLAB Synergy-S (Rigaku Oxford Diffraction) four circle diffractometer with a mirror monochromator and a microfocus MoKα or CuKα radiation source. The data were collected at the controlled temperature of 293.3(1) K using MoKα radiation (λ = 0.71073 Å) to a maximum θ value of 33.515°. The obtained data sets were processed with CrysAlisPro 1.171.40.67a software (Rigaku Oxford Diffraction, 2019).
The phase problem was solved by direct methods with SHELXT-2014/5 (Sheldrick, Reference Sheldrick2015a). Parameters of the obtained model were refined using SHELXL-2018/3 (Sheldrick, Reference Sheldrick2015b). The figures presenting the kozłowskiite structure were prepared with ORTEP-3 for Windows version 2020.1 software (Farrugia, Reference Farrugia2012) and VESTA Version 3 Copyright 2006–2021 (Momma and Izumi, Reference Momma and Izumi2011). The programs were operated under the WinGX integrated system, version 2020.1 (Farrugia, Reference Farrugia2012).
Kozłowskiite, Ca4Fe2+Sn3(Si2O7)2(Si2O6OH)2 (Z = 2), is isostructural with kristiansenite, Ca2ScSn(Si2O7)(Si2O6OH) and silesiaite, Ca2Fe3+Sn(Si2O7)(Si2O6OH) (Z = 4). The space group symmetry was assigned as C1 [a = 10.0183(2), b = 8.3861(1), c = 13.3395(2) Å, α = 89.956(1), β = 109.039(2), γ = 89.979(1)° and V = 1059.40(3) Å3 from 11,299 reflections measured in the θ range 3.216–33.797° at 293.3(1) K using MoKα radiation], however, similarly to kristiansenite (Ferraris et al., Reference Ferraris, Gula, Ivaldi, Nespolo and Raade2001), the structure is metrically monoclinic (Laue group 2/m) with α and γ angles equal to 90° [a = 10.0170(3), b = 8.3860(2), c = 13.3421(4) Å, β = 109.050(3)° and V = 1059.40(5) Å3] from 11,137 reflections measured in the θ range 3.216–33.797°.
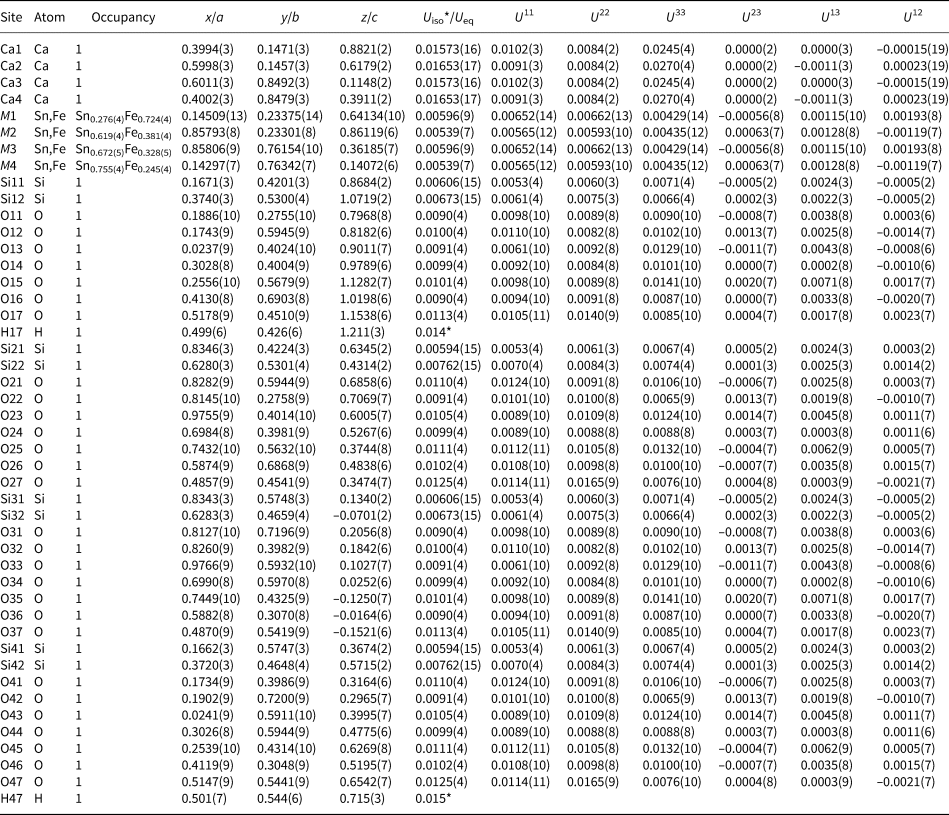
The preliminary crystal structure was solved in the monoclinic space group C2/c and then transformed to the unconventional space group C1 according to the structure of kristiansenite from Ferraris et al. (Reference Ferraris, Gula, Ivaldi, Nespolo and Raade2001). The refinement of 276 structural parameters in C1 (positional and anisotropic displacement parameters for non-hydrogen atoms and positional parameters of hydrogen atoms) gave an R 1 index of 2.12% (R 1[all] = 2.74%), wR 2[all] = 3.69%, and goodness of fit parameter S = 0.935. In general, the structure of kozłowskiite differs from kristiansenite (Ferraris et al., Reference Ferraris, Gula, Ivaldi, Nespolo and Raade2001) by the choice of unit cell origin and the qualitative and quantitative chemical composition, however, it is difficult to compare their asymmetric units as in the paper by Ferraris et al. (Reference Ferraris, Gula, Ivaldi, Nespolo and Raade2001) it has not been properly chosen (see Fig. S1 deposited with the Principal Editors of Mineralogical Magazine and available as Supplementary material).
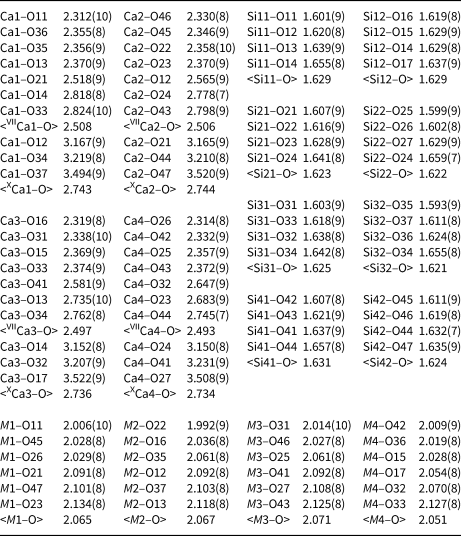
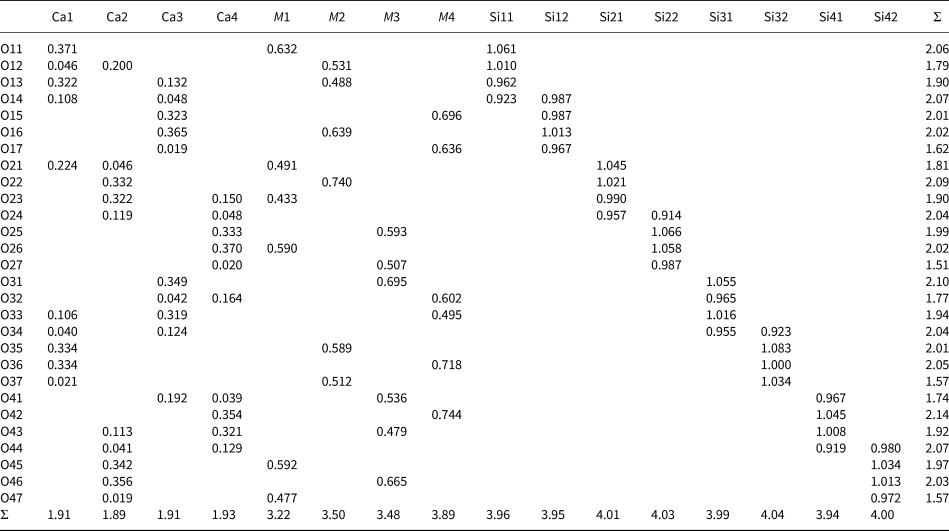
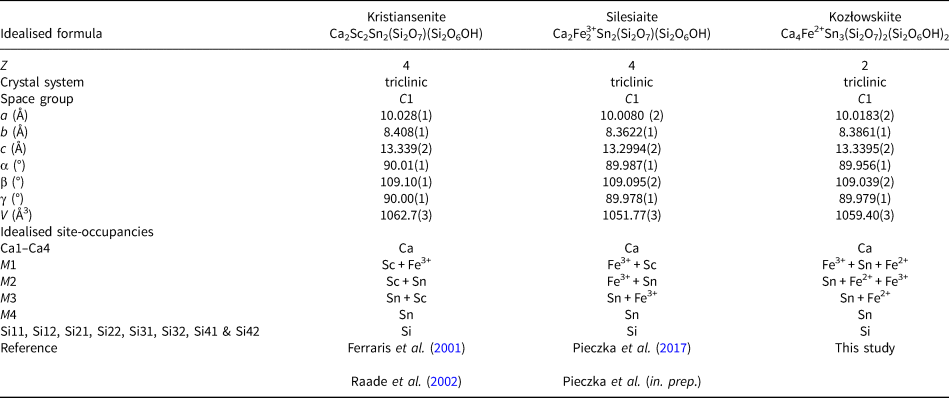
Full details of the diffraction data measurement and structure solution are listed in Table 2. Refined atomic coordinates, equivalent and anisotropic displacement parameters, and occupancy for structural sites are given in Table 3, selected bond lengths are collected in Table 4 and assigned M-site populations are shown in Table 5. Bond valences calculated on the basis of the parameters given by Gagné and Hawthorne (Reference Gagné and Hawthorne2015) are shown in Table 6. Table 7 presents the geometrical parameters of hydrogen bonds and Table 8 the brief comparison of kozłowskiite with kristiansenite and silesiaite. The crystallographic information file has been deposited with the Principal Editor of Mineralogical Magazine and is available as Supplementary material (see below).
Data and experimental details for the selected crystal.

R int = Σ|Fo2–Fo2(mean)|/Σ[Fo2]; GoF = S = {Σ[w(Fo2–Fc2)2]/(n–p+r)}½; R 1 = Σ||Fo|–|Fc||/Σ|Fo|; wR 2 = {Σ[w(Fo2–Fc2)2]/Σ[w(Fo2)2]}½; w = 1/[σ2(Fo2) + (aP)2 + bP], where a is 0.0015, b is 0.0000 and P is [2Fc2 + Fo2)]/3
Atomic coordinates, occupancy, equivalent and anisotropic displacement parameters (Å2) for non-hydrogen atoms for kozłowskiite.

Selected interatomic distances (Å) in kozłowskiite.

Refined M site-scattering values and assigned M-site populations for kozłowskiite.

Bond-valence analysis for kozłowskiite (vu)*.

* Bond valence sums were calculated using the equation S = exp[(R 0–R)/B], where R 0 and B are bond-valence parameters derived by Gagné and Hawthorne (Reference Gagné and Hawthorne2015), and R is the refined bond length.
Geometrical parameters of hydrogen bonds in kozłowskiite (Å, °).

Comparison of selected structural parameters in kristiansenite, silesiaite and kozłowskiite.

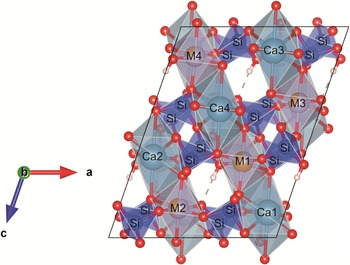
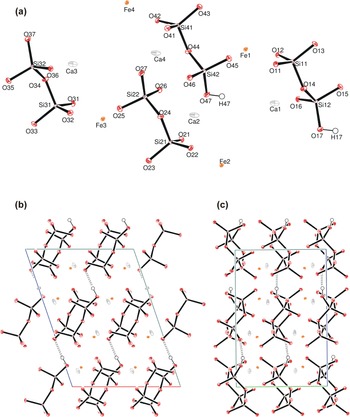
The kozłowskiite unit cell contains two formal units (Z = 2); each of them is composed of three types of cationic sites: 4 polyhedral Ca sites (Ca1 to Ca4), 4 octahedral M sites (M1 to M4), and 8 tetrahedral Si sites (Si11 to Si41 and Si12 to Si42) forming 4 disilicate groups (Si2O7) half of which is protonated (Si2O6OH). A projection of the kozłowskiite structure onto (010), with the disilicate groups and the other polyhedra of cations in different alternating (10$\bar{1}$ ) planes is shown in Fig. 3. The M positions are occupied partially by Sn and Fe atoms; the M octahedra are isolated from each other and aligned in [101] rows. The hydrogen bonds (marked by dashed lines) connect [101] rows of disilicate groups. The asymmetric unit contents of kozłowskiite with the atom numbering scheme, and packing of the ions in the kozłowskiite structure viewed along [010] and [100] is presented in Fig. 4.
Projection of the kozłowskiite structure onto (010) to be compared to figure 1 in Ferraris et al. (Reference Ferraris, Gula, Ivaldi, Nespolo and Raade2001). The M positions are occupied partially by Sn (violet tint) and Fe (gold tint) atoms.

(a) Asymmetric unit contents of kozłowskiite with the atom numbering scheme. Displacement ellipsoids are given at 50% probability level. (b) Packing of the ions in the structure of kozłowskiite viewed along [010] and (c) along [100]. Lattice directions a, b, and c are marked by red, green and blue lines, respectively.

Site assignment
The Ca1–Ca4 and Si11–Si24 sites are occupied solely by Ca and Si, respectively. The occupancy of Ca sites exclusively by Ca is corroborated by the refined <Ca–O> distances (Table 4) and calculated bond-valence sums (Table 6). The 7-fold-coordinated Ca polyhedra are highly distorted with Ca–O distances ranging from almost 2.312 Å up to 2.824 Å. The <VIICa1–O> to <VIICa4–O> averaged distances, 2.508, 2.506, 2.497 and 2.493 Å, are comparable with the appropriate distances in type kristiansenite (2.527, 2.513, 2.478 and 2.480 Å) (Ferraris et al., Reference Ferraris, Gula, Ivaldi, Nespolo and Raade2001) and kristiansenite from Szklarska Poręba (2.498, 2.487, 2.504 and 2.501 Å) (Evans et al., Reference Evans, Gołębiowska, Groat and Pieczka2018). They are distinctly longer than the sum of Ca2+ and O2– radii, 2.42–2.44 Å, evaluated using radii of seven-fold-coordinated Ca2+ and (3 or 4)-coordinated O2– by Shannon (Reference Shannon1976). The decreased values of BVS for VIICa1–O to VIICa4–O (1.79 to 1.82 valence units [vu], Table 6) suggest that several longer interactions should contribute to the bond-valence sums around the central Ca cations, according to the valence-sum rule. Ferraris et al. (Reference Ferraris, Gula, Ivaldi, Nespolo and Raade2001) indicated (7+2)-coordination as more appropriate for all Ca sites in the kristiansenite structure. We checked more distant oxygen atoms around the Ca1 to Ca4 sites and found for each of them a possible coordination of 7 + 2 + 1, i.e. with two additional oxygen atoms in the distance of ~3.2 Å and one in the distance of ~3.5 Å (Table 4). Although these additional Ca–O interactions could increase the BVS of Ca2+ up to 1.89–1.93 vu, they are still too small for a 2+ ion (Table 6). The <XCa1–O> to <XCa4–O> averaged distances of 2.734–2.744 Å are also much longer than ~2.59 Å, i.e. the length calculated for XCa–O. It seems that the main reason for the above incompatibility is the presence of significantly long Ca–O bonds to oxygen atoms interacting through hydrogen bonds (O17–H17⋅⋅⋅O27 and O47–H47⋅⋅⋅O37). In consequence, the contribution of these XCa–O bonds in the BVS around Ca2+ cations is almost negligible (bond valences of only 0.019–0.021 vu, Table 6), and small deficiencies in the calculated BVS appear.
The eight Si sites (site symmetry 1, C 1) are occupied entirely by Si in distorted tetrahedra of oxygen atoms. The <Si–O> mean bond lengths vary in a narrow range of 1.621–1.631 Å (Table 4), and they are comparable with the kristiansenite (1.619–1.636 Å) described by Ferraris et al. (Reference Ferraris, Gula, Ivaldi, Nespolo and Raade2001) and from Szklarska Poręba (1.615–1.643 Å; Evans et al., Reference Evans, Gołębiowska, Groat and Pieczka2018). Of course, the bonds formed by Si to bridging oxygen atoms O14, O24, O34 and O44 in Si2O7 and Si2O6OH anions have the largest lengths reaching 1.629–1.659 Å.
The four M sites have diverse site occupants. Although in these positions, tetravalent Sn and Zr are dominating, the trivalent Fe, Sc and Al as well as divalent Mn and Fe are also frequent. The occupancies of the sites were refined in the system Sn vs. Fe. The refined total M-site scattering, 159.73 e–, agrees well with 161.28 e– calculated from the EMPA formula for Z = 2. The structure refinement separates the electrons among the M1–M4 sites in the following way: 32.6(1); 40.9(1); 42.1(1); and 44.1(1) e – (Table 5), resulting from the refined Sn–Fe occupancies presented in Table 3. The real M-site fillings are more complex due to the diversified sets of cations at the M sites. To approximate these occupancies, we took into account the refined M1 to M4 site-scattering values and <(M1–M4)–O> distances. Occupancies of the M1 to M4 sites were estimated in the system of complex Sn+Zr – Fe3++Sc+Al – Fe2++Mn2+ cations. The tetravalent Sn+Zr complex cation features 49.863 electrons and calculated radius of 0.690 Å; the trivalent Fe3++Sc+Al cation has 22.175 electrons and radius of 0.687 Å, and the divalent Fe2++Mn2+ cation has 25.778 electrons and a radius of 0.791 Å [calculated radii of complex cations based on Shannon (Reference Shannon1976) data]. The refined M1–M4 site-scattering should satisfy the equations:

where M 1–4(Sn + Zr), M 1–4(Fe3+ + Sc+Al) and M 1–4(1–Sn–Zr–Fe3+–Sc–Al) are contributions of tetravalent, trivalent and divalent cations at the M1 to M4 sites, and M 1–4s.s. are the refined site-scattering at the sites. Because abundance, M 1–4(Fe3+ + Sc + Al), can be expressed as M 1–4n ⋅ 0.896, where n is a contribution (0 to 1 or 0 to 100%) of the complex trivalent cation in the occupancy of the selected M site, and 0.896 is the total abundance of trivalent cations at the M1–M4 sites, it is possible to match M 1n, M 2n, M 3n and M 4n to minimise differences between the refined and estimated <M1–O>, <M2–O>, <M3–O> and <M4–O> mean bond lengths. The results of such estimation presented in Table 5 indicate that at the average difference in the refined and EMPA-estimated values of M 1–4 s.s. at the level of –0.4 e– per site, the differences between the refined and estimated <(M1–M4)–O> distances are in the range of ±0.001 Å. The populations also indicate that three of four M sites: M2, M3 and M4, are formally dominated by tetravalent Sn+Zr (mainly Sn), and the relative content of M 4+ cations which may be related to the substitution M 4+ + M 2+ → 2 M 3+ increases from 0.03 at the M4 site through 0.29 and 0.25 at M3 and M2 sites, respectively, up to 0.43 at the M1 site. The calculated values of BVS for M1, M2, M3 and M4 cations (3.22, 3.50, 3.48 and 3.89 vu; Table 6) are close to averaged valences of complex M cations at the sites (3.21, 3.50, 3.50 and 3.78) and corroborate the estimated populations.
The kozłowskiite unit cell (Z = 2), similarly to kristiansenite and silesiaite, contains two hydrogen atoms shared among the O17–O27 and O47–O37 oxygen atoms. The geometric parameters of the hydrogen bonds are presented in Table 7.
Chemical formula
Difference-Fourier maps showed that H atoms are ordered at two sites (H17 and H47) and bonded to O17 and O47 oxygen atoms, respectively, therefore it can be expected that the maximum content of OH groups in minerals of the kristiansenite-type structure is 2 pfu for Z = 2. Each of the OH groups is bonded to the Si12 and Si42 atoms and by hydrogen bond acceptors O27 and O37 to the Si22 and Si32 atoms, respectively, forming two protonated disilicate anions (Si2O6OH)5–.
The kozłowskiite empirical formula calculated in relation to 26O + 2(OH) and 16 cations pfu, i.e. the same normalisation base as is suggested by the ideal compositions of kristiansenite and silesiaite, is:

In the formula, iron occurs in mixed-valence states indicating an oxidation ratio Fe3+/Fetotal = 0.45. However, because direct determinations of FeO and Fe2O3 (e.g. using Mössbauer spectroscopy) as well as H2O were not possible due to the scarcity of the mineral, and the relationship among the constituents Fe2+–Fe3+ and OH–O depends on the coupled substitution Fe2+ + OH– = Fe3+ + O2–, the question arises of whether a better solution with another Fe3+/Fetotal ratio exists, which could lead to another ideal formula of the species. To investigate this possibility, we checked the effects of (1) oxidation of M2+ and (2) reduction of M3+cations involved in the substitution.
Case (1) would be connected with partial deprotonation of OH groups participating in the hydrogen bonds due to the replacement of M 1,M4Fe3+ + O17,O47O → M 1,M4Fe2+ + O17,O47OH. As explained by Ferraris et al. (Reference Ferraris, Gula, Ivaldi, Nespolo and Raade2001), the deprotonation of those OH groups would lead to two short distances between the donor (D) and acceptor (A) oxygens, e.g. in kozłowskiite, the O47(D)–O37(A) and the O17(D)–O27(A) distances are only 2.687 Å and 2.707 Å. Moreover, the formula of the oxidised mineral must take into account the distribution of M-type cations among the M1–M4 sites (Table 5): Ca4.00[(Sn2.52Zr0.03)Σ2.55(Sc0.47Fe3+0.53Al0.08)Σ1.09(Fe2+0.24Mn2+0.12)Σ0.36]Σ4.00(Si2O7)2.19(Si2O6OH)1.81, which would lead to the unbalanced idealised formula Ca4(Sn3Fe3+)(Si2O7)2(Si2O6OH)2. These limitations definitely eliminate the possibility of the evolution of kozłowskiite towards solely Fe3+-bearing species with a lowered OH content below 2 apfu. In contrast, each substitution related to at least partial reduction of M3+-type cations would lead to an increase of OH content above the maximum amount of 2 OH groups pfu determined from difference-Fourier maps in structural studies.
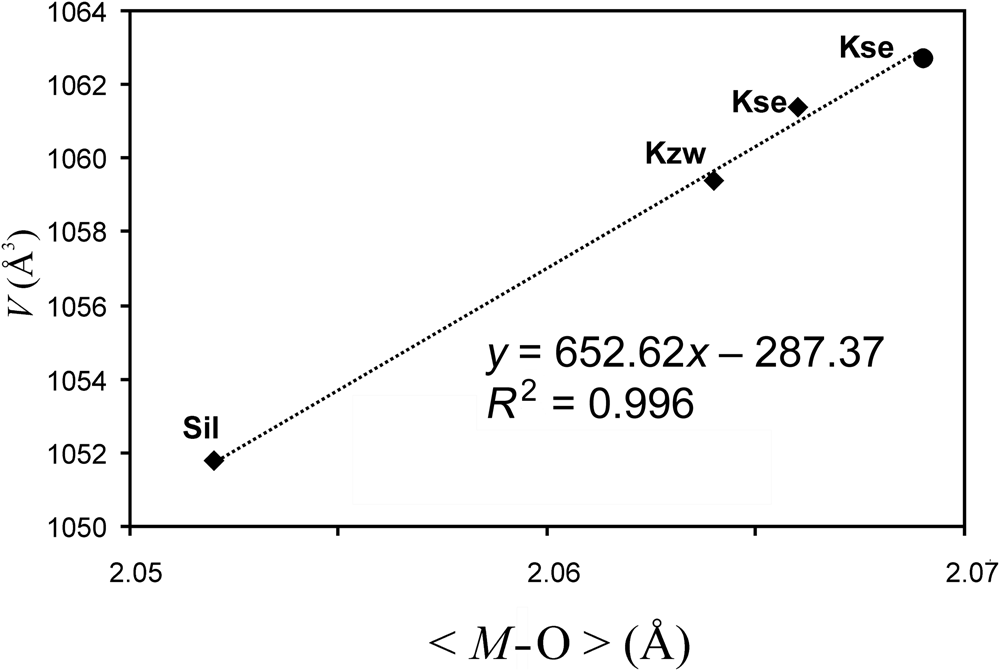
A comparison of some structural and compositional parameters of kristiansenite (Ferraris et al., Reference Ferraris, Gula, Ivaldi, Nespolo and Raade2001; Raade et al., Reference Raade, Ferraris, Gula, Ivaldi and Bernhard2002), kozłowskiite (this study), and silesiaite (preliminary data are not yet published) presented in Table 8 provides additional arguments for the significant presence of M2+-type cations (mainly Fe2+) in kozłowskiite. Among the parameters the unit-cell volume draws special attention because at the same occupancy of the Ca and Si sites in the three minerals it can be expected that the difference in the volume is a result of varying M-site populations. In the minerals, the sites are populated by cations with radii ranging from 0.535 Å (Al3+) up to 0.83 Å (Mn2+), with Sc3+ (0.745 Å), Sn4+ (0.69 Å), Fe3+ (0.645 Å) and Fe2+ (0.78 Å) as the main occupants (ionic radii according to Shannon, Reference Shannon1976). The plot of the refined unit-cell volume versus averaged mean distance <(M1–M4)–O> (Fig. 5) for the kristiansenite from the Heftetjern pegmatite, Tørdal, Norway (Ferraris et al., Reference Ferraris, Gula, Ivaldi, Nespolo and Raade2001), and kristiansenite, kozłowskiite and silesiaite from the Szklarska Poręba Huta pegmatite, Poland (Evans et al., Reference Evans, Gołębiowska, Groat and Pieczka2018; this study), i.e. for the four crystals representing the kristiansenite group of minerals, features a good linear relationship ascribed by the equation: V = 652.6 <(M1–M4)–O> – 287.4 with r 2 = 0.996. This indicates that unit-cell volume increases proportionally to an averaged <(M1–M4)–O> distance, with the highest value for the Heftetjern kristiansenite showing <(M1–M4)–O> = 2.069 Å. For the Szklarska Poręba Huta Fe3+-enriched kristiansenite (2.066 Å), kozłowskiite (2.064 Å) and finally silesiaite (2.052 Å) the volume is slightly lower. The kozłowskiite <(M1–M4)–O> distance is comparable with the analogous distances in kristiansenite species (with M sites populated mainly by Sn and the relatively large Sc3+ cation) which confirms that the M sites in kozłowskiite must be populated, besides Sn, by a large octahedral cation. It can be only Fe2+.
Relationship between the refined unit-cell volume and averaged <M–O> distance in kristiansenite-group minerals. Symbols: full circle – kristiansenite from the Heftetjern pegmatite (Ferraris et al., Reference Ferraris, Gula, Ivaldi, Nespolo and Raade2001); diamonds – kristiansenite, kozłowskiite and silesiaite from Szklarska Poręba (Evans et al., Reference Evans, Gołębiowska, Groat and Pieczka2018; this study). Abbreviations of the mineral names according to Warr, Reference Warr2021).

Acknowledgements
We are grateful to Oleg Siidra and two anonymous reviewers for their constructive comments on the manuscript. This study was supported by AGH University of Science and Technology grant 16.16.140.315.
Competing interests
The authors declare none.
Supplementary material
To view supplementary material for this article, please visit https://doi.org/10.1180/mgm.2022.50