INTRODUCTION
Protistan parasites of the genus Perkinsus infect marine molluscs throughout the world (Villalba et al. Reference Villalba, Reece, Ordas, Casas and Figueras2004). Perkinsus marinus, the most studied of the Perkinsus species, causes major mortalities of eastern oysters (Crassostrea virginica) along the Gulf of Mexico and Atlantic coasts of the United States (Burreson and Ragone Calvo, Reference Burreson and Ragone Calvo1996; Ford, Reference Ford1996; Soniat, Reference Soniat1996). A second Perkinsus species of interest, P. atlanticus (now referred to as P. olseni) is a parasite of the carpet-shell clam Tapes decussatus in Portugal and Spain (Azevedo, Reference Azevedo1989; Casas et al. Reference Casas, Villalba and Reece2002a; Murrell et al. Reference Murrell, Kleeman, Barker and Lester2002). This species, first described in the blacklip abalone, Haliotis ruber, by Lester and Davis (Reference Lester and Davis1981) in Australia has now been reported to infect molluscan species in coastal waters of Asian, Australasian, European and South American countries (Goggin and Lester, Reference Goggin and Lester1995; Leethochavalit et al. Reference Leethochavalit, Upatham, Choi, Sawangwong, Chalermwat and Kruatrachue2003; Cremonte et al. Reference Cremonte, Balseiro and Figueras2005; Park et al. Reference Park, Park, Lee and Choi2005; Abollo et al. Reference Abollo, Casas, Ceschia and Villalba2006; Dungan et al. Reference Dungan, Reece, Moss, Hamilton and Diggles2007). In contrast to P. marinus, knowledge on the effects of temperature on the epizootiology of perkinsosis in marine molluscs other than eastern oysters is limited (McLaughlin and Faisal, Reference McLaughlin and Faisal2000; Park and Choi, Reference Park and Choi2001; Leite et al. Reference Leite, Afonso and Cancela2004; Villalba et al. Reference Villalba, Casas, López and Carballal2005). Moreover, unlike P. marinus, little is known regarding the optimal conditions for proliferation of P. olseni histozoic stages (i.e. trophozoites and schizonts), making it difficult to predict conditions favourable for the parasite's spread, to identify appropriate conditions for its killing, or to identify instances of potential cross-infectivity among sympatric species. With the expansion of mariculture and the movement or desire to move bivalve molluscs around the world (Hine, Reference Hine and Rogers2001; Elston et al. Reference Elston, Dungan, Meyers and Reece2004) basic information is needed on how environmental factors such as temperature influence P. marinus and P. olseni viability and spread.
Both in vivo and in vitro studies on the tolerance of Perkinsus species, predominantly P. marinus, to different environmental conditions demonstrate that they can be highly resistant to a range of conditions (Ray, Reference Ray1954; Andrews, Reference Andrews1965; Chu and Greene, Reference Chu and Greene1989; Goggin et al. Reference Goggin, Sewell and Lester1990; O'Farrell et al. Reference O'Farrell, La Peyre, Paynter and Burreson2000; Ahn and Kim, Reference Ahn and Kim2001; Casas et al. Reference Casas, Villalba and Reece2002a; Ford and Chintala, Reference Ford and Chintala2006; La Peyre et al. Reference La Peyre, Casas and La Peyre2006). While optimal ranges are fairly well known and relatively narrow (i.e. P. marinus – Dungan and Hamilton, Reference Dungan and Hamilton1995; Gauthier and Vasta, Reference Gauthier and Vasta1995; La Peyre and Faisal, Reference La Peyre and Faisal1996), neither the extreme ranges in which Perkinsus species can survive and proliferate, nor the extent to which they survive (i.e. % viability) in extreme conditions are well defined. Few controlled laboratory studies have examined the effects of suboptimal environmental conditions on Perkinsus species viability, metabolic activity and proliferation (La Peyre et al. Reference La Peyre, Casas and La Peyre2006). For control and management of a disease, we are equally interested in the effects of extremes in environmental conditions which could ultimately be used to predict epizootics, or lack of, and for treatment and potential control of the parasites. Moreover, there is increasing interest in the influence of climate change on the spread of infectious diseases, including P. marinus, in marine environments (Powell et al. Reference Powell, Gauthier, Wilson, Nelson, Fay and Brooks1992; Harvell et al. Reference Harvell, Mitchell, Ward, Altizer, Dobson, Ostfeld and Samuel2002; Ford and Smolowitz, Reference Ford and Smolowitz2007).
While temperature, along with salinity, are considered the most important environmental factors affecting the interactions of P. marinus and P. olseni with their respective hosts (Burreson and Ragone Calvo, Reference Burreson and Ragone Calvo1996; Villalba et al. Reference Villalba, Casas, López and Carballal2005), the range of temperatures in which these parasites can survive or proliferate remains ill-defined, particularly in the lower temperatures. The in vitro culture of P. marinus (Gauthier and Vasta, Reference Gauthier and Vasta1993; La Peyre et al. Reference La Peyre, Faisal and Burreson1993) and P. olseni (Casas et al. Reference Casas, Villalba and Reece2002b) provides an opportunity to examine the effects of temperature on trophozoite survival and proliferation in the absence of any host influences. In order to better understand the effects of low temperature on P. marinus and P. olseni, we first compared in vitro the viability, metabolic activity and proliferation of 3 isolates each of P. marinus and P. olseni trophozoites at three temperatures 4, 15 and 28°C. The effects of exposure to 2, 4 and 6°C over several months and the influence of temperature acclimation on P. marinus viability at these low temperatures were then determined. This information is critical to understand seasonal changes in parasite numbers in the host, especially considering that warmer winter temperatures of 1–3°C during the 1980s and 1990s have been blamed for P. marinus epizootics in Chesapeake Bay and Delaware Bay as well as the extension of P. marinus range into the northeastern Atlantic coast region of the United States (Burreson and Ragone Calvo, Reference Burreson and Ragone Calvo1996; Ford, Reference Ford1996; Cook et al. Reference Cook, Folli, Klinck, Ford and Miller1998; Ford and Smolowitz, Reference Ford and Smolowitz2007).
MATERIALS AND METHODS
Study 1: Effects of temperature on two Perkinsus species viability, metabolic activity and proliferation
Cultures and experimental design
Three P. marinus isolates (GTLA-5, GTLA-33 and GTLA-34) and 3 P. olseni isolates (PaG-6f [ATCC #PRA-32], PaG-118f and PaG-126f) were examined for their response to 3 temperatures (4, 15 and 28°C). Perkinsus marinus cultures were established from the hearts of infected C. virginica collected in Lower Barataria Bay (Grande Terre), Louisiana (USA) following the method of La Peyre et al. (Reference La Peyre, Faisal and Burreson1993) and using the culture medium JL-ODRP-2A (775 mOsm/kg, pH 7·4, Casas et al. Reference Casas, Villalba and Reece2002b). Oysters off Grande Terre, Louisiana, are exposed to a wide range of water temperatures exceeding 30°C in summer months, and may reach values as low as 4°C a few days a year (USGS continuous data recorder, http://waterdata.usgs.gov/usa/nwis/uv/?site_no=291929089562600). Perkinsus olseni cultures were established from the gills of T. decussatus from Ria de Arousa (Galicia, NW Spain) (Casas et al. Reference Casas, Villalba and Reece2002b) where temperatures below 10°C and above 22°C are rare (Casas et al. Reference Casas, Villalba and Reece2002a; Villalba et al. Reference Villalba, Casas, López and Carballal2005). All cultures were maintained and subcultured every other month in the culture medium JL-ODRP-2A at 28°C until the start of the study. For clarity in reporting parasites' species responses, P. marinus isolates GTLA-5, GTLA-33 and GTLA-34 will be referred to as pm1, pm2 and pm3 respectively and P. olseni isolates PAG-6f, PaG-118f and PaG-126f will be referred to as po1, po2 and po3 respectively, throughout the text.
To prepare the JL-ODRP-2A medium, a balanced solution was made by dissolving (per litre) 1·18 g CaCl2·2H2O, 2·26 g MgSO4, 3·50 g MgCl2·6H2O, 1·03 g KCl, 20·05 g NaCl, 0·34 g NaHCO3 in tissue culture-grade water to a final volume of 944 ml. The balanced salt solution was filter sterilized (0·2 μm) and the following solutions were added under sterile conditions: 1 ml of a solution containing (per ml) 0·834 mg FeSO4·7H2O and 0·143 mg ZnSO4·7H2O, 1 ml of a solution containing 0·249 mg CuSO4·5H2O per ml, 5 ml of minimal essential medium (MEM) amino acids without glutamine, 5 ml of MEM non-essential amino acids, 5 ml of a solution containing (per ml) 10 mg alanine, 5 mg glycine, 5 mg serine, 15 mg taurine and 5 mg glutamine, 2 ml of a solution containing (per ml) 0·5 mg each of adenosine 5′-monophosphate, cytidine 5′-monophosphate, uridine 5′-triphosphate and 0·5 mg coenzyme A, 2 ml of MEM vitamin solution, 2 ml of yeastolate ultrafiltrate solution, 10 ml of a solution containing (per ml) 50 mg glucose, 10 mg trehalose and 10 mg galactose, 1 ml of Sigma's lipid mixture (1000×), 10 ml of a solution containing 0·5 mg chloramphenicol per ml and 10 ml of 1 m N-(2-hydroxyethyl) piperazine-N′-(2-ethanesulfonic acid) hemisodium salt (HEPES) solution. All chemicals used to prepare JL-ODRP-2A were purchased from Sigma-Aldrich Co. (St Louis, Missouri) except yeastolate which was purchased from Life Technologies Inc. (Rockville, Maryland).
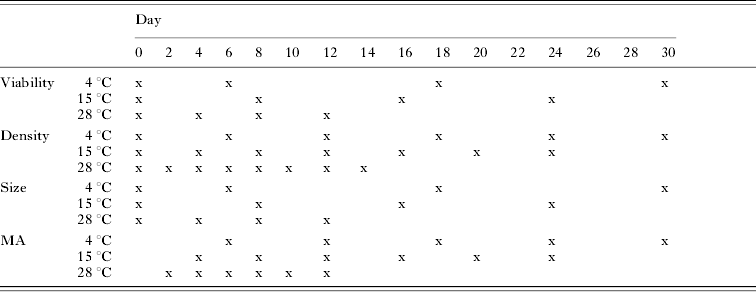
Three weeks prior to the experiment, each isolate (3 per species) was seeded in JL-ODRP-2A culture medium in two 75-cm2 flasks (Corning, Inc., Corning, New York) at a density of 2×10⁵ cells/ml. At the start of the experiment (Day 0), the parasites were harvested from 75-cm2 flasks, passed 5 times through a 25 G needle attached to a 10-ml syringe to remove clumps, rinsed with fresh medium (JL-ODRP-2A) 3 times and re-suspended at a density of 2×10⁵ cells/ml. Then 100 μl of each Perkinsus species isolate suspension were added to wells of 96-well tissue-culture plates (Costar, Inc., Corning, New York) and the plates were incubated in humidified chambers at 3 temperatures (4, 15, 28°C). From these tissue-culture plates, 4 parameters (Perkinsus viability, density, size, and metabolic activity) at each temperature were measured, as indicated in Table 1. The parameters were measured over 12 days at 28°C and 24 days at 15°C to encompass schizogony, and ended at 30 days at 4°C as little enlargement and no schizogony were observed.
Sampling schedule for the 4 parameters measured in this study (Perkinsus viability, density, size and metabolic activity (MA)) by day and temperature

Viability
The percentage of viable cells was recorded for each isolate at each temperature. We added 10 μl of neutral red (50 mg/l) to wells. All plates were incubated at 28°C for 2 h. Following incubation, the number of live (stained) cells and the number of dead (unstained) cells were counted (La Peyre and Chu, Reference La Peyre and Chu1994). At least 200 total cells per isolate were counted. Percentage viability was calculated by dividing the number of live cells by the total number of cells counted. We sampled 2 replicate wells for each isolate and temperature combination following the timetable for each experiment (Table 1).
Density
The total number of cells per ml was recorded for each isolate for each temperature on designated days (Table 1). Cells were passed 5 times through a 25 G needle attached to a 1-ml syringe to break-up clumps and ensure the culture was well mixed. Cell densities were determined using improved Neubauer Bright-LineR haemocytometers (Reichert, Buffalo, New York). Three replicate wells per isolate per temperature were sampled.
Size
Diameters (μm) of 50 trophozoites per well were measured with an ocular micrometer at 400× magnification, using an inverted microscope (Zeiss Axiovert 25, Carl Zeiss Inc., Thornwood, New York) following the timetable in Table 1. In addition, when division occurred, the diameters of 25 schizonts per well were measured. Two replicate wells for each isolate by temperature combination were sampled.
Metabolic activity
Metabolic activity was measured for each isolate at each temperature using the alamarBlue assay (Alamar Biosciences Inc., Sacramento, California). This assay allows continuous monitoring of cell metabolic activity over extended periods and is routinely used to assay cell growth and survival (Fields and Lancaster, Reference Fields and Lancaster1993; Le Pape et al. Reference Le Pape, Pagniez and Abdala2002; La Peyre et al. Reference La Peyre, Casas and La Peyre2006). The alamarBlue assay incorporates a non-toxic oxidation-reduction indicator that changes from an oxidized (non-fluorescent, blue) form to a reduced (fluorescent, red) form in response to chemical reduction of growth medium resulting from cell metabolic activity. Fluorescence was measured using a Cytofluor Multi-well Plate Reader (Series 4000, PerSeptive Biosystems, Inc., Framingham, Massachusetts) connected to a personal computer. An excitation wavelength of 530 nm (25 nm bandwidth filter) and an emission wavelength of 580 nm (50 nm bandwidth filter) were used. Measurements were expressed in fluorescence units (fu). Fluorescence measurements for each isolate were the result of subtracting the readings of wells with the isolate from the background readings of wells with media without cells.
For cumulative metabolic activity measurements, 10 μl of alamarBlue reagent were added on Day 1 to wells of 3 plates seeded with Perkinsus species (1 plate for each temperature 4, 15, 28°C) for each of the isolates. These plates were incubated in the dark at their respective temperatures and read at different times according to the established timetable (Table 1). Readings were ended at earlier times than established by the timetable when all the redox indicator was essentially reduced (i.e. >10 000 fu). Seven replicate wells per isolate per temperature were measured.
To better assess changes in metabolic activity at selected times during the full length of the study, an ‘instantaneous’ metabolic activity was also measured by adding 10 μl of alamarBlue reagent to wells of 3 plates (1 plate for each temperature 4, 15, 28°C) for each of the isolates at different times according to the established timetable (Table 1). These plates were incubated in the dark at 28°C and read 4 h later. Seven replicate wells per isolate per temperature were measured.
Finally, the ‘intrinsic’ metabolic activity of each cell population sampled was determined by dividing their instantaneous metabolic activities by their biovolumes and multiplying by 104. The biovolume of a cell population was calculated as follows:

where tr=trophozoites mean radius, sr=schizonts mean radius and number (i.e. in 100 μl)=cell density×0·1. Intrinsic metabolic activities could only be calculated for days 0, 6, 18 and 30 at 4°C, for days 0, 8, 16 and 24 at 15°C and for days 0, 4, 8 and 12 at 28°C as cell population viabilities were only measured on those days and at those temperatures.
Study 2: Effects of prolonged low temperature with and without acclimation on Perkinsus marinus viability
Perkinsus marinus isolate pm2 (GTLA-33) cultured in JL-ODRP-2A medium maintained at 28 and 18°C were prepared as described in study 1 and re-suspended at a final density of 2×10⁵ cells/ml. At the start of the experiment (Day 0), 100 μl of cell suspension from each temperature were added to wells of 96-well tissue-culture plates and the plates were transferred directly in humidified chambers at 6, 4 and 2°C. From these tissue-culture plates, parasite viability at each temperature was determined every 30 days over 120 days. All viability data were measured in triplicate wells using neutral red as described in study 1.
Another set of plates seeded with cells maintained at 18°C, were exposed gradually to decreasing temperature at a rate of 0·5°C per day until the final test temperatures of 6, 4 or 2°C were reached after 24, 28 and 32 days respectively. The viabilities of these ‘acclimated’ parasites at 6, 4 and 2°C were then evaluated monthly for 90 days. Viabilities of control pm2 cells maintained at 28 and 18°C for 4 months were also determined.
Statistical analysis
Statistical analysis was performed using SAS Version 8.0 software (SAS Institute, Inc., Cary, North Carolina). Data collected at each temperature were analysed with a two-factor analysis of variance (ANOVA, factors: day and isolate) in study one and with one-factor ANOVA (day) in study two. Least-square means with a Tukey adjustment was used following significant ANOVA results (P<0·05) to examine the differences among treatments. All data are reported as mean±s.d. Data were log transformed (metabolic activity) or arcsine transformed (viability) to achieve normality and homogeneity of variance.
RESULTS
Study 1: Effects of temperature on two Perkinsus species viabilility, metabolic activity and proliferation
Viability
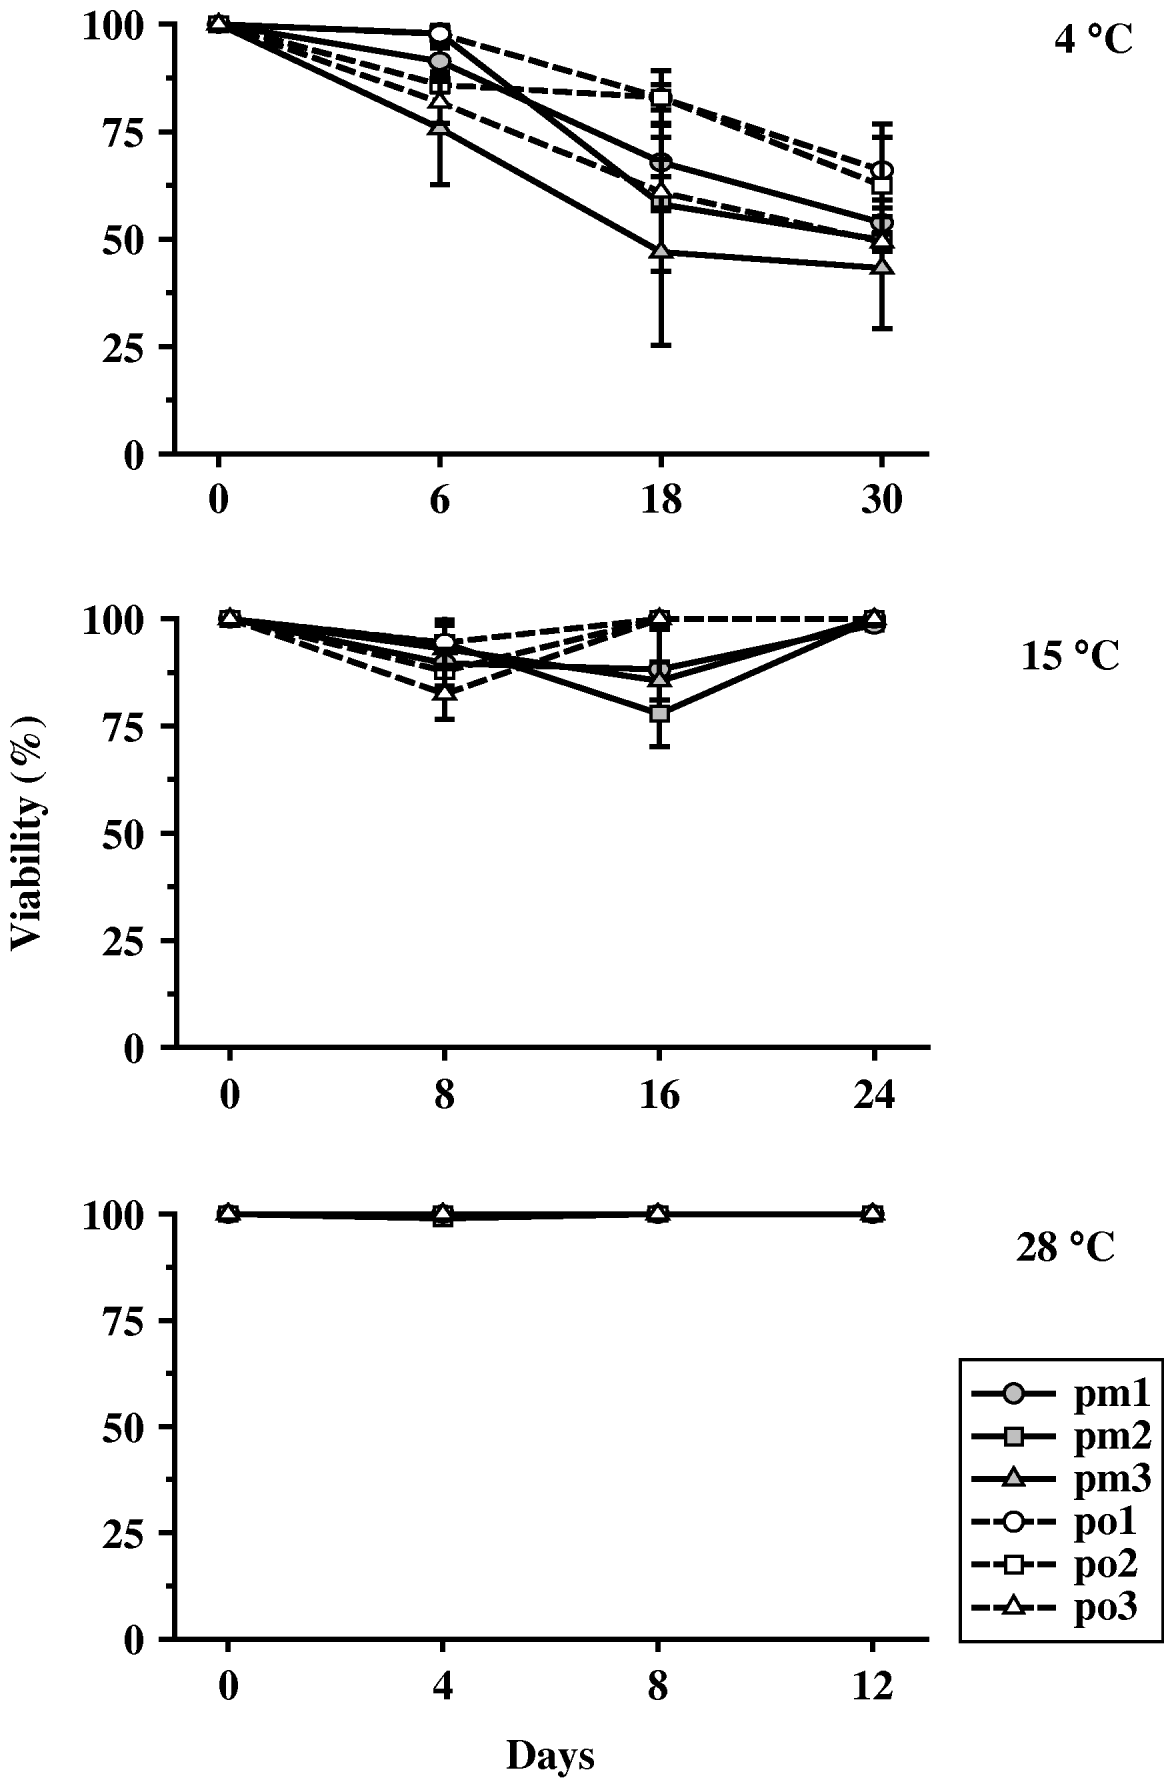
In general, all P. olseni and P. marinus isolates had high viability at 28 and 15°C throughout the incubation period. All isolates showed decreased viability at 4°C by the end of the incubation period of 30 days (Fig. 1).
Perkinsus spp. mean±s.d. percentage viability of 3 isolates each of P. marinus (pm1, pm2, pm3) and P. olseni (po1, po2, po3) exposed to 3 temperatures (4, 15, 28°C).

At 4°C, there was a significant day and isolate effect. Overall, P. marinus isolate viability decreased more quickly as compared to P. olseni. Pm3 had significantly lower viability from Day 0 by Day 6; at Day 18, all P. marinus isolates, along with po3 were significantly lower as compared to their respective Day 6 viabilities. While the viability of all 6 isolates continued to decrease from Day 18 to Day 30 the differences were not significant. For Day 0 and Day 6 there were no significant isolate differences. At Day 18, pm2 and pm3 had significantly lower viabilities than po1 and po2.
At 15°C, a significant day×isolate interaction was found. All P. marinus isolates had significantly lower viability than all 3 P. olseni isolates viability on Day 16. Viabilities of all P. marinus isolates increased from Day 16 to Day 24 as cells proliferated. Viabilities between Perkinsus species for all other days were not significantly different.
At 28°C, all Perkinsus isolates had about 100% viability throughout the 30-day incubation period.
Density
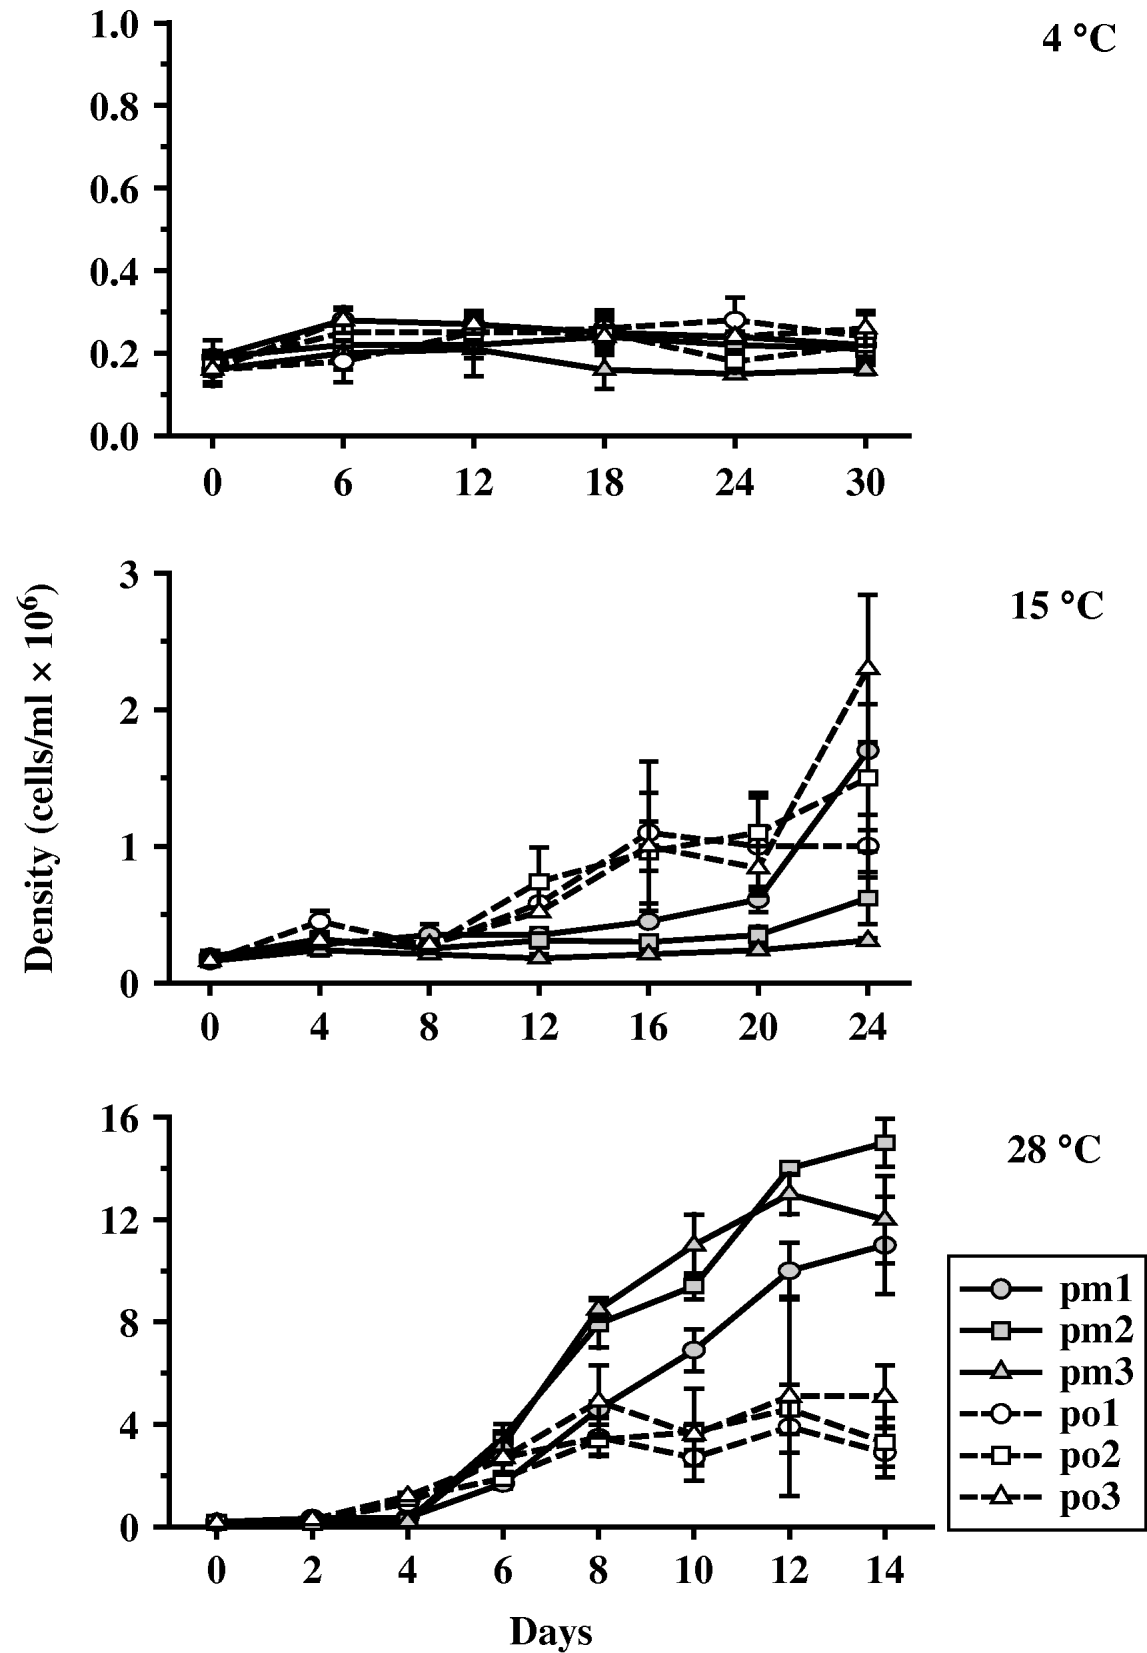
Significant differences were found for the day×isolate interaction for cell density at 15 and 28°C. In general, cell density was greatest at 28°C for all 6 isolates, with P. marinus isolates increasing significantly more than P. olseni isolates. At 15°C, P. olseni isolates on average, fared better than the P. marinus isolates. At 4°C, all 6 isolates had minimal changes in cell density throughout the incubation period (Fig. 2).
Perkinsus spp. mean±s.d. cell density (cells/ml) of 3 isolates each of P. marinus (pm1, pm2, pm3) and P. olseni (po1, po2, po3) exposed to 3 temperatures (4, 15, 28°C).

At 4°C, no isolate showed any significant change in density throughout the incubation period. By Day 30, all isolates had similar cell densities, with the exception of pm3 which had significantly lower cell density as compared to the 5 other isolates.
At 15°C, P. olseni began to divide sooner than P. marinus. Po1 had significantly higher density on Day 4 as compared to Day 0 while po2 and po3 had significantly higher density on Day 12 as compared to Day 0. In contrast, pm1 and pm2 did not have significantly higher densities until Day 20 and 24, respectively, as compared to Day 0 while pm3 did not increase in density throughout the entire incubation period. By Day 16, all P. marinus isolates had significantly lower densities as compared to all 3 P. olseni isolates (P. marinus <4·5×105 cells/ml; P. olseni >9·6×105 cells/ml). Due to a large increase in pm1 towards the end of the incubation period, by Day 24, pm1 had a density lower than po3, but significantly higher than po1.
At 28°C, all 6 isolates significantly increased initial cell densities by Day 6, as compared to Day 0. After Day 6, all 3 P. marinus isolates continued to increase significantly through Day 12. In contrast, po1 did not increase cell density significantly after Day 6, while po2 and po3 only increased significantly once during the remainder of the incubation period (between Day 6 and Day 8). By Day 10, differences were significant between species with all P. marinus isolates with significantly greater densities as compared to all P. olseni isolates (P. marinus isolates >6·9×106 cells/ml; P. olseni isolates <3·6×106 cells/ml); furthermore, pm2 and pm3 continued to have greater cell densities as compared to pm1 throughout the incubation period.
Size
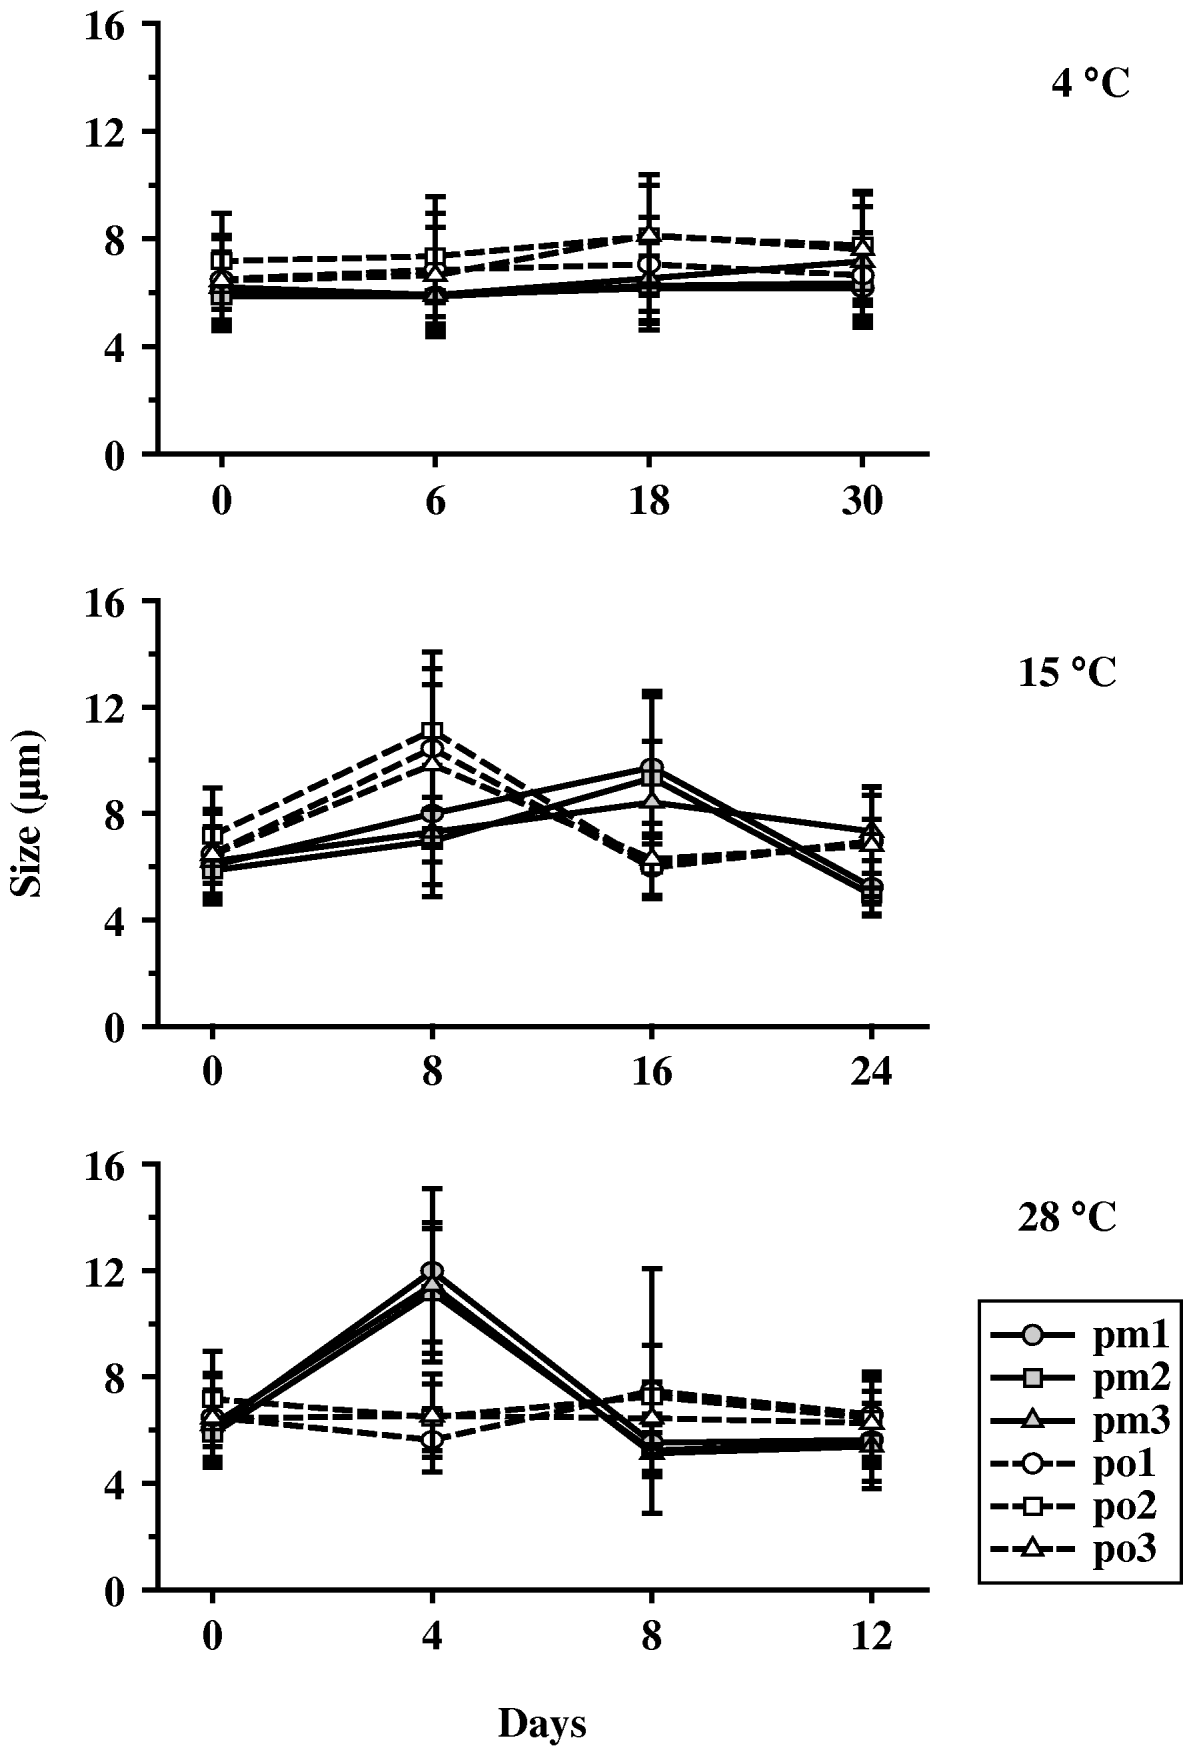
Significant day×isolate interactions were found at all temperatures. Cells incubated at 4°C showed an overall slight increase in size throughout the incubation period (Fig. 3). On Day 18, all 3 P. olseni isolates had significantly larger trophozoites as compared to their initial sizes. On Day 30, pm2 and pm3 had significantly larger trophozoites as compared to their initial sizes. Differences in trophozoite sizes by species occurred on Days 6 and 18 with all P. olseni isolates having larger trophozoite sizes as compared to all 3 P. marinus isolates. No schizogony was observed at 4°C.
Perkinsus spp. mean±s.d. trophozoite diameter (μm) of 3 isolates each of P. marinus (pm1, pm2, pm3) and P. olseni (po1, po2, po3) exposed to 3 temperatures (4, 15, 28°C).

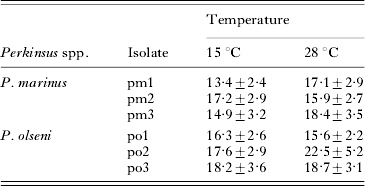
At 15°C, trophozoites of P. marinus isolates increased in diameter through Day 16, with schizonts recorded on Day 24 (Table 2). Perkinsus olseni isolate trophozoites increased in size through Day 8, with schizonts recorded on Day 16 (Table 2). Mean diameter of schizonts varied by isolates.
Mean±s.d. diameter (μm) of schizonts of Perkinsus marinus and Perkinsus olseni at 15 and 28°C
(No schizonts were observed at 4°C.)

At 28°C, trophozoites of all 3 P. marinus isolates increased in size from the time of initial seeding (mean 6·0±1·3 μm) to Day 4 (mean 11·5±2·7 μm) with schizogony recorded on Day 8 along with a significant decrease in trophozoite size (mean 5·2±0·9 μm). Schizogony was recorded by Day 4 for all P. olseni isolates but only po1 trophozoite diameter decreased significantly from Day 0 to Day 4 and increased significantly from Day 4 to Day 8. Perkinsus marinus trophozoites displayed a greater range of diameters as compared to P. olseni trophozoites, but on Day 12, P. marinus isolates (mean 5·5±1·4 μm) were all significantly smaller in diameter as compared to P. olseni isolates (mean 6·4±1·5 μm). While mean diameter of P. marinus isolates schizonts (17·1±3·2 μm) was smaller than P. olseni schizonts (18·9±4·1 μm) the difference was not significant (Table 2).
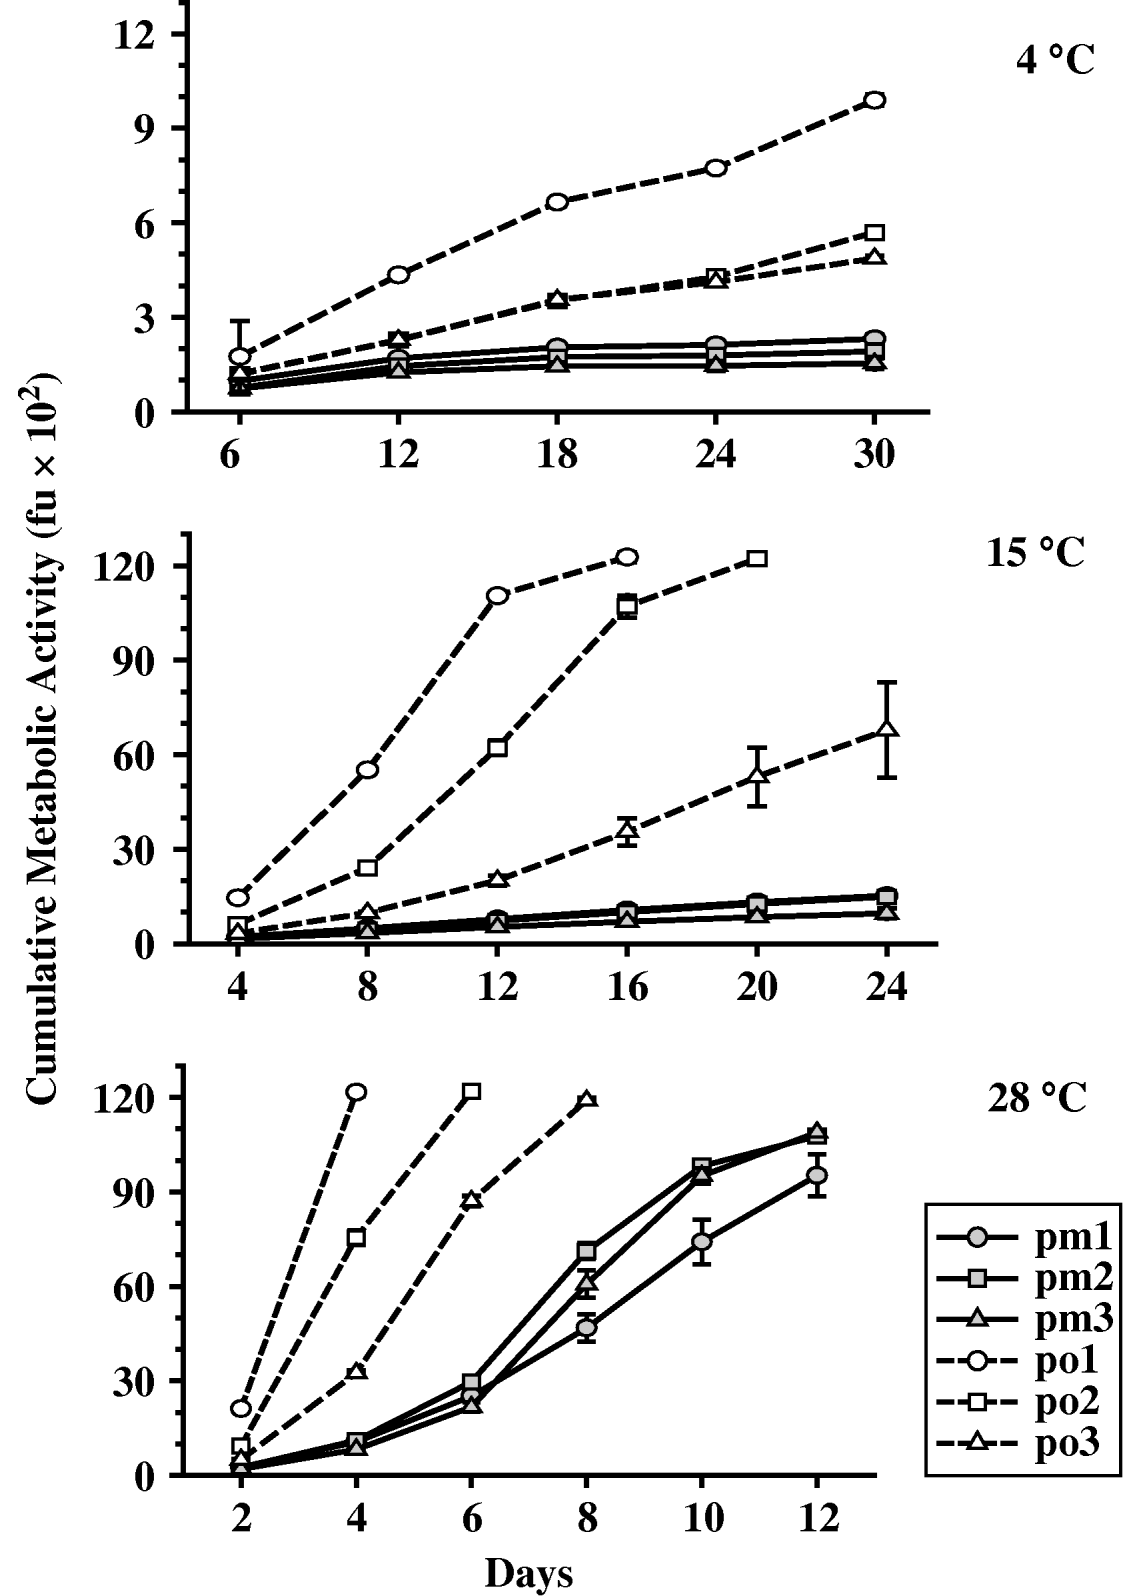
Cumulative metabolic activity
Significant day×isolate interactions were found at all temperatures (Fig. 4). Overall, the cumulative metabolic activity of all 3 P. olseni isolates was significantly greater than that of P. marinus. Perkinsus marinus was highly affected by the lower temperatures with significant reduction in activity evident at 15°C in addition to 4°C.
Perkinsus spp. mean±s.d. cumulative metabolic activity of 3 isolates each of P. marinus (pm1, pm2, pm3) and P. olseni (po1, po2, po3) exposed to 3 temperatures (4, 15, 28°C).

At 4°C, P. olseni isolates had significantly greater cumulative metabolic activity as compared to all 3 P. marinus isolates throughout the incubation period. Perkinsus olseni isolates all increased significantly throughout the incubation period, from Day 0 through Day 30, but remained low (<989 fu) as compared to cumulative metabolic activity at higher temperatures. Of the P. olseni isolates, po1 had significantly higher activity as compared to po2 and po3. Although P. marinus isolate metabolic activity increased from Day 0 through Day 30, the cumulative metabolic activity remained very low for all 3 isolates (<232 fu).
At 15°C, all P. olseni isolates had a significant increase in cumulative metabolic activity by Day 8. Po1 had reduced all redox-indicator molecules during the study period by Day 16, while po2 had done so by Day 20. Po3 cumulative metabolic activity was still increasing at the end of the incubation period at Day 24. In contrast, P. marinus isolate cumulative activity remained at low levels during the incubation period (Day 24 average of all 3 isolates was 1324±134 fu). By Day 8, pm1 (487±9 fu) and pm2 (431±21 fu) cumulative metabolic activity were significantly different, but otherwise, there were no differences by day between any of the 3 P. marinus isolates during the incubation period.
At 28°C, all Perkinsus isolates had a significant increase in metabolic activity by Day 4. Po1 had reduced all redox-indicator molecules by Day 4, while po2 and po3 had done so by Days 6 and 8 respectively. Significant differences in metabolic activity between isolates of P. olseni were found at all days. Perkinsus marinus isolates had significantly lower metabolic activity as compared to all P. olseni isolates, but increased their metabolic activity through the incubation period.
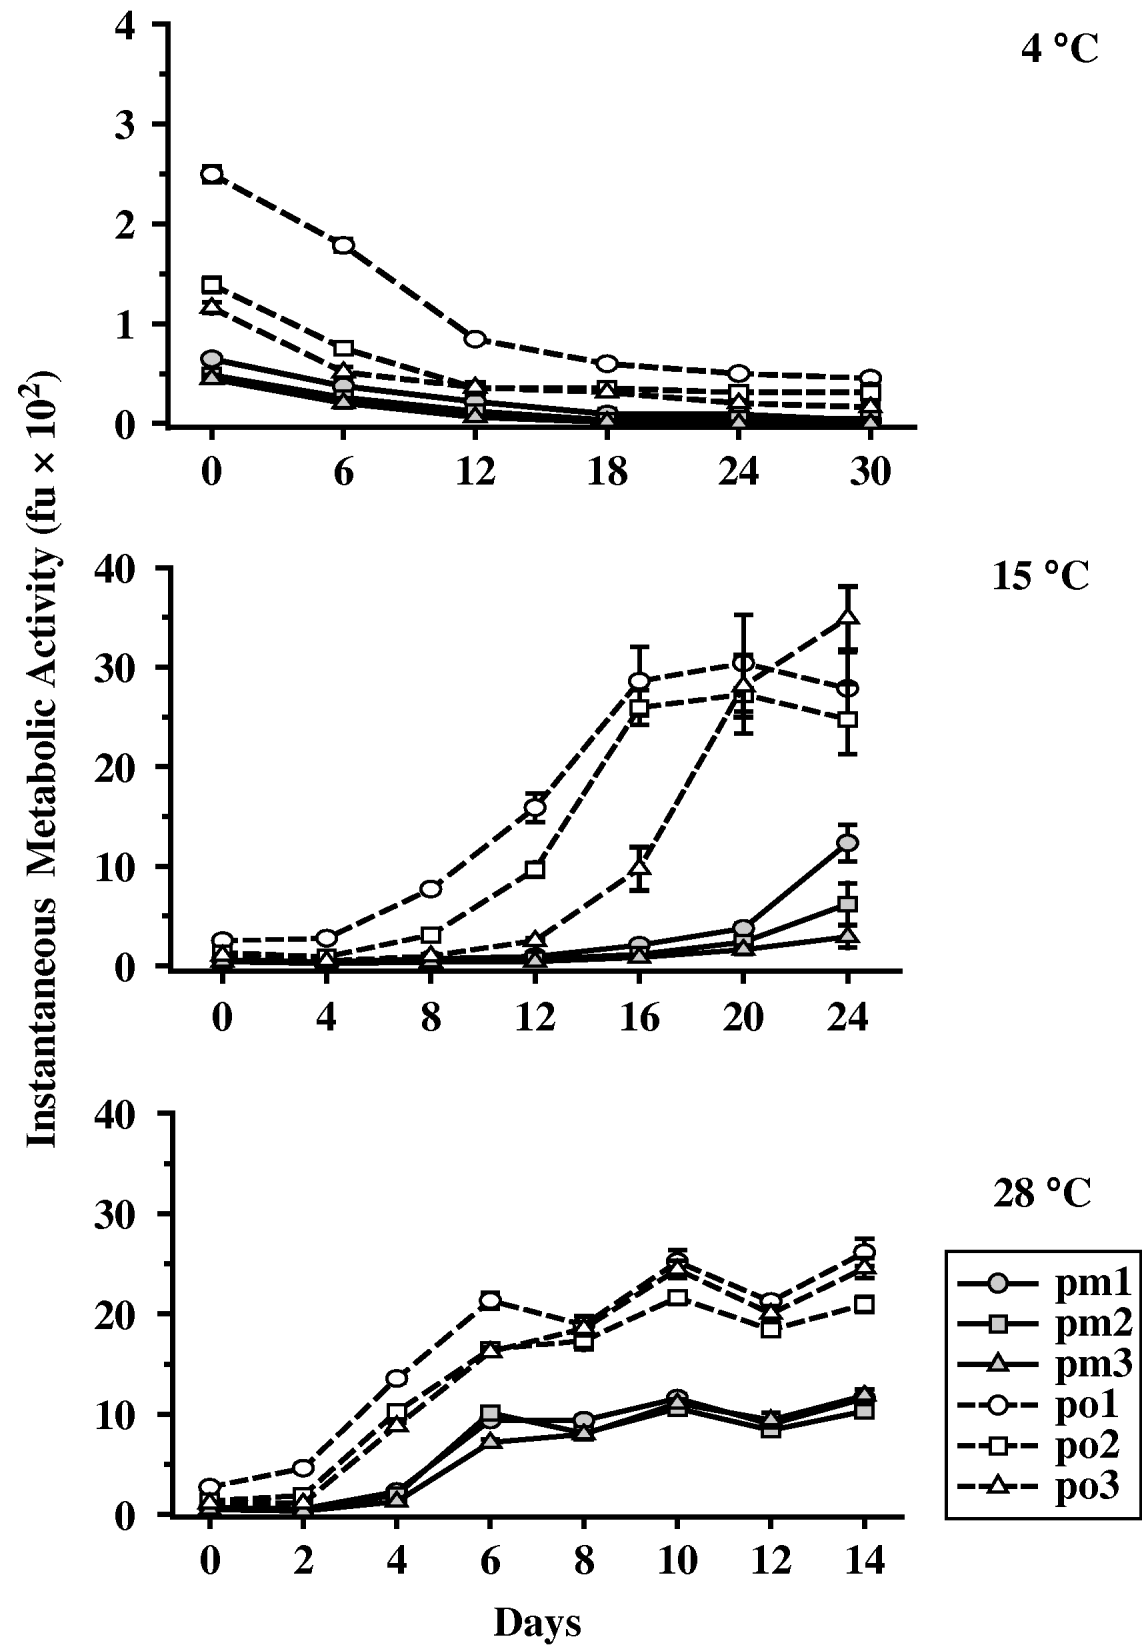
Instantaneous metabolic activity
At 15 and 28°C, similar to findings in cumulative metabolic activity, P. olseni isolates had higher instantaneous metabolic activity than P. marinus throughout the incubation period (Fig. 5). Furthermore, P. marinus showed a significant increase in instantaneous metabolic activity later than P. olseni. At 4°C, all Perkinsus isolates had a significant decrease in instantaneous metabolic activity on Day 6 from their initial values, with activities decreasing throughout the incubation period. At 15°C, P. marinus showed a significant increase in instantaneous metabolic activity later in the incubation period than did P. olseni. At 15°C, pm1 and pm2 had a significant increase in instantaneous metabolic activity at Day 20, while pm3 had a significant increase in instantaneous metabolic activity at Day 24. In contrast, po1, po2 and po3 had significant increases in instantaneous metabolic activity at Day 8, 12 and 16, respectively. At 28°C, both species instantaneous metabolic activity increased at each incubation period with significantly higher values for P. olseni.
Perkinsus spp. mean±s.d. instantaneous metabolic activity of 3 isolates each of P. marinus (pm1, pm2, pm3) and P. olseni (po1, po2, po3) exposed to 3 temperatures (4, 15, 28°C).

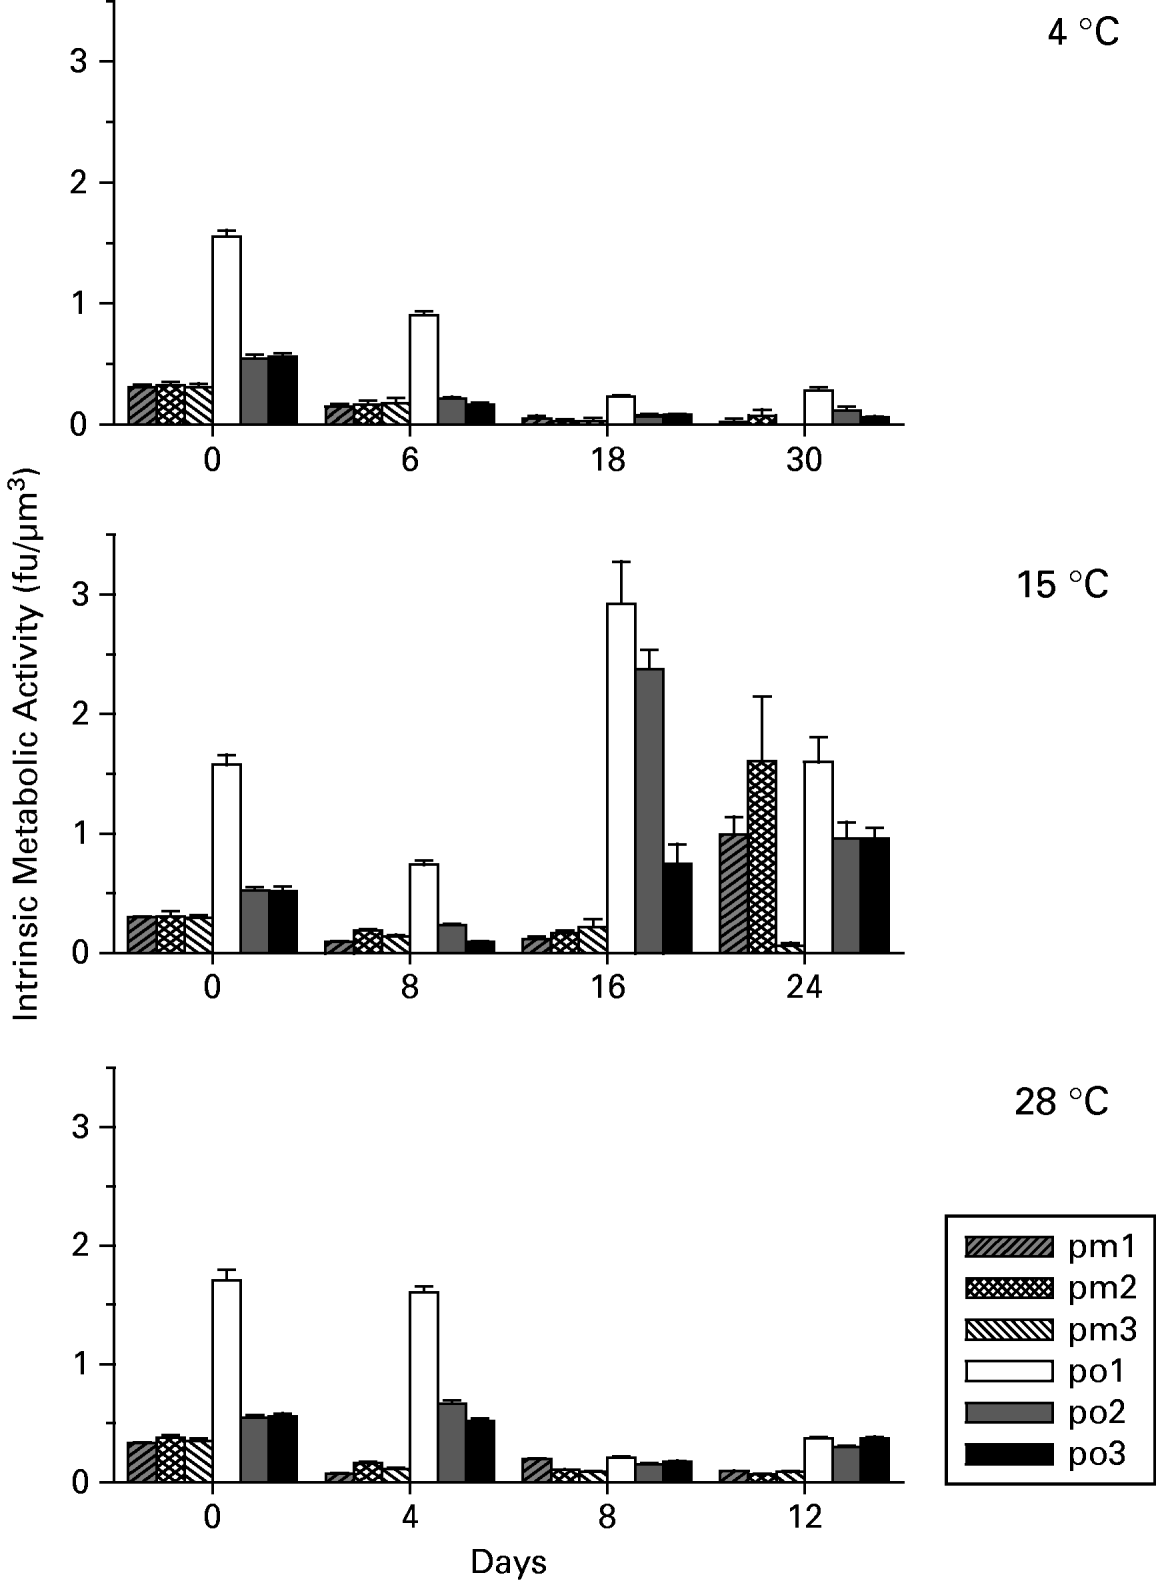
Intrinsic metabolic activity (i.e. instantaneous metabolic activity per biovolume)
At 4°C, all Perkinsus isolates had a significant decrease in intrinsic metabolic activities on Day 6 from their initial values and from Day 6 to Day 18 (Fig. 6). The intrinsic metabolic activity of po1 was significantly higher than that of all other isolates at each sampling time.
Perkinsus spp. mean±s.d. intrinsic metabolic activity (i.e. instantaneous metabolic activity per biovolume) of 3 isolates each of P. marinus (pm1, pm2, pm3) and P. olseni (po1, po2, po3) exposed to 3 temperatures (4, 15, 28°C).

At 15°C, all Perkinsus isolates had a significant initial decrease in intrinsic metabolic activities on Day 8 (Fig. 6). The intrinsic metabolic activities of each P. olseni isolate then increased significantly from Day 8 to Day 16 with values exceeding their initial (Day 0) intrinsic metabolic activities. The intrinsic metabolic activity of po3 continued to significantly increase from Day 16 to Day 24 but significantly decreased for po1 and po2 during the same period. A significant increase (pm1 and pm2) in intrinsic metabolic activities in 2 of the 3 P. marinus isolates was also measured by Day 24 (Fig. 6). Similar to 4°C, the intrinsic metabolic activities of po1 were always greater than those of other P. olseni isolates and P. marinus isolates except for pm2 on Day 24.
At 28°C, P. marinus intrinsic metabolic activities decreased significantly from Day 0 for each successive day of sampling (Fig. 6). Perkinsus olseni intrinsic metabolic activities also decreased significantly from Day 0 to Days 8 and 12. The intrinsic metabolic activities of P. olseni isolates were always greater than the intrinsic metabolic activities of P. marinus isolates except for pm1 on Day 8 (Fig. 6).
Study 2: Effects of prolonged low temperature with and without acclimation on Perkinsus marinus viability
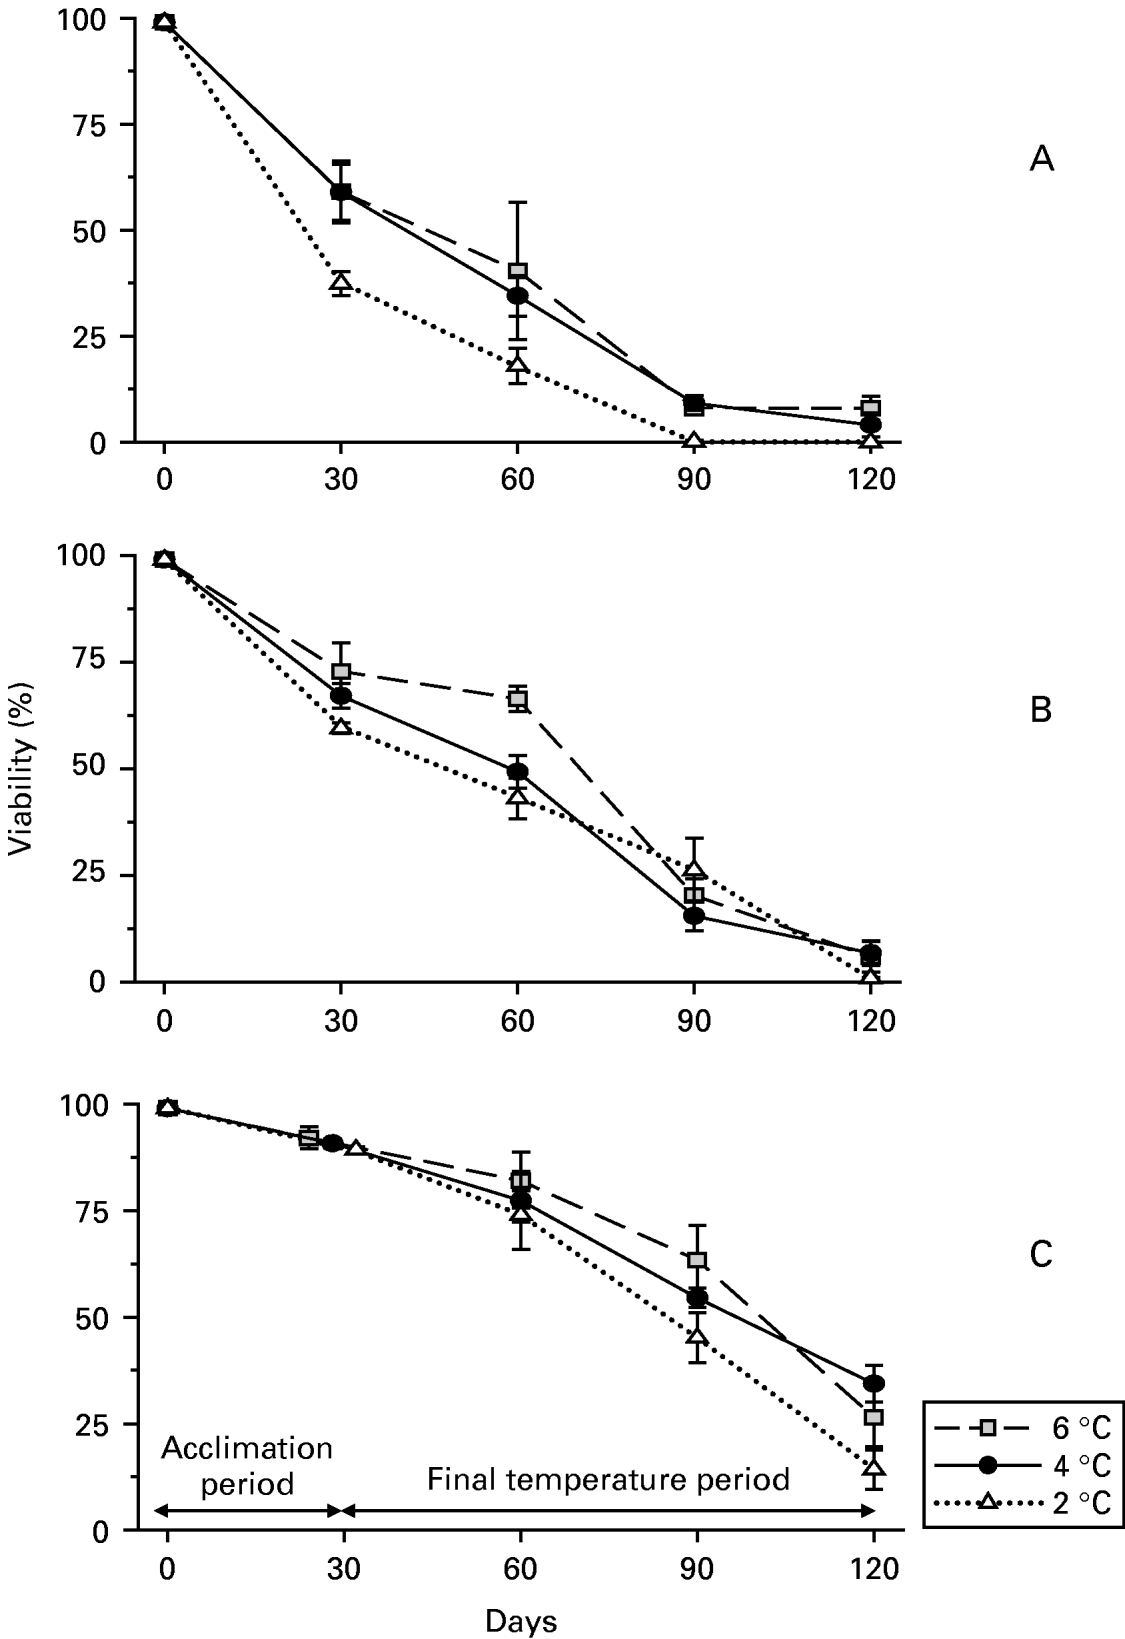
Significant differences in cell viability were found by day and temperature for P. marinus (pm2) transferred directly from 28°C to 2, 4 and 6°C. At each temperature, cell viability decreased significantly for each consecutive sampling day (Fig. 7A) except between Days 90 and 120. Cell viabilities on Days 30 and 60 were also significantly higher at 6 and 4°C than at 2°C. Viability of the control cells, maintained for 120 days at 28°C, was 88·0±4·6%.
Mean±s.d. percentage viability of Perkinsus marinus isolate pm2 over 120 days exposed to 3 temperatures (2, 4, 6°C). (A). On Day 0, pm2 cells cultured at 28°C were transferred directly from 28°C to 2, 4 and 6°C. (B). On Day 0, pm2 cells cultured at 18°C were transferred directly to 2, 4 and 6°C. (C). Pm2 cells cultured at 18°C were acclimated to low temperatures by decreasing the incubation temperature by 0·5°C per day, until reaching the experimental test temperatures of 2, 4 and 6°C.

Viability of cells transferred directly from 18°C to 2, 4 and 6°C also decreased significantly from Day 0 to Day 120 although more progressively than cells transferred directly from 28°C to 2, 4 and 6°C (Fig. 7B). There was no difference in cell viability between 2 and 4°C at each sampling day. Cell viability at 6°C was significantly higher than the cell viability at 2°C on Day 30 and the cell viabilities at 2 and 4°C on Day 60. Cell viability at 6°C decreased significantly from Day 0 to Day 30 and Day 60 and from Day 60 to Day 90 and Day 120. Viability of control cells, maintained at 18°C for 4 months was 77·9±5·3%.
Further statistical comparison of viabilities at 2, 4 and 6°C between cells directly transferred from 28°C and cells directly transferred from 18°C indicated a lessening of effect for cells transferred from 18°C to the low temperatures. At 2°C, in particular, the viability of parasites transferred from 18°C were significantly higher than the viability of parasites transferred from 28°C at each sampling time.
Viabilities of cells at the end of the acclimation period (i.e. Days 24, 28 and 32) and on Days 60, 90 and 120 from the start of the study (Day 0) were significantly different by day and by temperature with no significant interaction. Viability decreased significantly between each consecutive sampling time, from Day 0 (100%) to the end of the acclimation period (90·7±1·9%) and exposure to test temperatures for about 30 days (77·7±6·8%, 60 days from Day 0), 60 days (54·4±9·4%, 90 days from Day 0) and 90 days (25·1±9·9%, 120 days from Day 0) (Fig. 7C). Viability at 2°C was also significantly lower than at 4 and 6°C.
DISCUSSION
Temperature greatly influenced the viability, metabolic activity and proliferation of P. marinus and P. olseni trophozoites; both P. marinus and P. olseni were able to proliferate at 15°C, albeit slowly, and at 28°C. Overall, P. olseni had higher metabolic activity than P. marinus, and was less affected by the lower temperatures (15 and 4°C). While the metabolic activity was minimal at 4°C, P. marinus and P. olseni maintained an average viability of 49% and 58% respectively, after direct transfer from 28°C and 30 days of incubation at 4°C. We also found that the detrimental effects of low temperatures (i.e. 2, 4 and 6°C) on P. marinus viability were significantly lessened by either lowering the initial temperature from 28 to 18°C prior to direct transfer of the parasites to low temperatures, or by gradually decreasing the temperature to the low temperatures at a rate that is more relevant to conditions experienced by P. marinus infecting poikilothermic oysters in the wild. While the ability of P. marinus to survive cold water temperatures has been reported in multiple studies (Ray, Reference Ray1954; Andrews, Reference Andrews1965; Perkins, Reference Perkins1966; Chu and Greene, Reference Chu and Greene1989; Ragone Calvo and Burreson, Reference Ragone Calvo and Burreson1994), past laboratory studies have mostly been short term (<10 days) and no studies have reported the viability of any Perkinsus species over an extended culture period at suboptimal temperatures (Burreson et al. Reference Burreson, Ragone Calvo, La Peyre, Counts and Paynter1994; Dungan and Hamilton, Reference Dungan and Hamilton1995; Gauthier and Vasta, Reference Gauthier and Vasta1995; La Peyre and Faisal, Reference La Peyre and Faisal1996; Soudant et al. Reference Soudant, Chu and Lund2005; Ford and Chintala, Reference Ford and Chintala2006). Our study provides the first data on the extent (i.e. percentage viability) to which histozoic stages of the parasites survived at 2, 4 and 6°C over an extended period of time. This information is critical to understanding the seasonal changes in parasite numbers in the host and the role of temperature in initiating epizootics.
Our in vitro findings provide trends on P. olseni and P. marinus temperature responses that generally match existing data. Infection dynamics of P. olseni in carpet-shell clams are well characterized in Galicia (NW Spain) where the annual pattern of temperature variation of seawater in clam beds in rias ranges from 14 to 22°C between April and November (above 19°C in summer only) and 10 to 14°C in the other months (e.g. Villalba et al. Reference Villalba, Casas, López and Carballal2005). If our in vitro results were extrapolated to natural environmental conditions, proliferation of P. olseni could occur in the Galician rias from mid-spring to mid-autumn as found by Villalba et al. (Reference Villalba, Casas, López and Carballal2005) with a peak in parasite intensity in mid-spring and another peak in late summer-early autumn. It is especially interesting that the earlier peak occurred when the temperatures were close to 15°C; P. olseni in this specific environment appears to be able to multiply and cause some high infection intensities, showing that not always is perkinsosis a warm water disease. At these temperatures, however, infection intensities by P. olseni were generally moderate and did not cause elevated P. olseni-associated mortalities. High P. olseni associated mortalities (80–100%) in carpet shell clams and/or Manila clams (Tapes philippinarum) have only been reported in warmer areas of the Iberian peninsula (Ruano and Cachola, Reference Ruano and Cachola1986; Santmarti et al. Reference Santmarti, García Valero, Montes, Pech, Durfort, Castelló and Calderer1995) where summer seawater temperature can exceed 28°C and reach values as high as 34°C (Vidal et al. Reference Vidal, Morgui, Latasa, Romero and Camp1997; Menendez and Comin, Reference Menendez and Comin2000; Leite et al. Reference Leite, Afonso and Cancela2004).
Mass mortalities of Manila clams have also been associated with P. olseni infection along the west and south coasts of Korea in late summer (Choi et al. Reference Choi, Park, Lee and Matsuoka2002) following temperatures which consistently exceed 25°C in August as reported in several bays along South Korea's coastline (Hyun et al. Reference Hyun, Pang, Klinck, Choi, Lee, Powell, Hoffman and Bochenek2001; Kang et al. Reference Kang, Choi, Bulgakow, Kim and Kim2003; Ngo et al. Reference Ngo, Berthe and Choi2003; Park and Choi, Reference Park and Choi2004). Perkinsus olseni was also reported to have caused mass mortalities of greenlip abalones (Haliotis laevigata) during an unusually hot summer in southern Australia in the early 1980s (Lester, Reference Lester1986; Lewis et al. Reference Lewis, Shepherd, O'Donoghue and Phillips1987; Lester et al. Reference Lester, Goggin, Sewell, Perkins and Cheng1990); challenge of H. laevigata with P. olseni in the laboratory at 2 experimental temperatures, 15 and 20°C, was later shown to cause high mortalities (Goggin and Lester, Reference Goggin and Lester1995). The experimental temperatures at which P. olseni caused mortalities, however, were reported to vary among other molluscan species from Australian waters with parasite associated mortalities occurring at 20°C but not 15°C in the blacklip abalone Haliotis ruber (Lester and Davis, Reference Lester and Davis1981; Lester, Reference Lester1986; Goggin and Lester, Reference Goggin and Lester1995) and parasite-associated mortalities occurring at 27–30°C but not at 20°C in the cockle Anadaria trapezia (Goggin and Lester, Reference Goggin and Lester1995). The lack of infection intensification in the different hosts at different temperatures was attributed to the different ability of the host defence responses to contain and possibly eliminate P. olseni (Goggin and Lester, Reference Goggin and Lester1995); P. olseni in the blacklip abalone Haliotis ruber maintained at 15°C for example, is readily encapsulated and killed (Lester and Davis, Reference Lester and Davis1981). Host defence responses with temperature therefore appear critical factors in the fate of P. olseni. Intensification of P. olseni infection in carpet-shell clams from Galician waters (NW Spain) and P. olseni associated mortalities of greenlip abalones at 15°C clearly indicate that this parasite can proliferate in vivo at this relatively low temperature. Moreover, our in vitro study showed that P. olseni actively proliferates at 15°C and differences in cell densities and metabolic activities between 15 and 28°C are much less pronounced for P. olseni than for P. marinus.
In contrast to P. olseni which causes mortalities in certain mollusc species at and below 20°C, epizootiological and transmission studies along the Gulf of Mexico and Atlantic coasts indicate that the intensity of infections of P. marinus in eastern oysters begins to increase when water temperature increases above 20°C, with the highest infection intensities and mortalities following water temperatures close to or exceeding 25°C for several weeks (Ray, Reference Ray1954; Hewatt and Andrews, Reference Hewatt and Andrews1956; Burreson and Ragone Calvo, Reference Burreson and Ragone Calvo1996; Ford and Chintala, Reference Ford and Chintala2006). The general lack of infection intensification below 20°C is likely due to the low proliferation rate of P. marinus at lower temperatures. Our results indicated no increase or minimal increase in cell density of P. marinus isolates pm2 and pm3 and a significant increase of isolate pm1 only after 20 days in culture at 15°C. Cumulative metabolic activities of P. marinus isolates at 15°C were also negligible compared to 28°C.
Although our P. marinus isolates originated from the Gulf of Mexico, with water temperatures warmer than along the central and northeastern Atlantic coasts, we believe that our results are valid for P. marinus isolates of higher latitudes because Ford and Chintala (Reference Ford and Chintala2006) have recently shown that the cell proliferation responses, measured as mitochondrial dehydrogenase activity, of P. marinus isolates from southern (South Carolina), central (New Jersey) and northern (Massachusetts) Atlantic coast were similar from 5 to 20°C; differences between isolates were only measured at higher temperatures of 25 to 35°C. Moreover, even if P. marinus isolates from the Gulf of Mexico and Northeastern Atlantic coasts, regions at the two temperature extremes, differed in other physiological responses (e.g., viability) we would expect the isolates from the warmer waters of the Gulf of Mexico to be more sensitive to cold temperatures, not less, than isolates from the colder waters of the northeastern Atlantic. The viability of northern isolates exposed to cold temperatures would therefore be expected to be higher, not lower than the viability reported for Gulf of Mexico isolates in our study.
If our P. marinus in vitro results were extrapolated to nature, the extensive period of warm water temperatures (>15°C) of the Gulf of Mexico could allow P. marinus proliferation from March to October and the short period of cold water temperatures would only cause negligible reduction of parasite numbers in winter. In the Gulf of Mexico (Grand Terre, Louisiana), the temperature of the water is generally greater than 15°C from March to October, lower than 15°C from November to February and reaches values close to 4°C for less than 10 days a year (USGS continuous data recorder, http://waterdata.usgs.gov/usa/nwis/uv/?site_no=291929089562600). Determination of infection intensities (parasites/g wet weight tissue) in whole oysters kept in cages off Grand Isle, Louisiana, revealed, however, that there is significant decrease in parasite numbers, by several log orders of magnitude, occurring in February and March, many weeks after the onset of cold weather (Stickler et al. Reference Stickler, Wagner, Encomio, Allen and La Peyre2001; Stickler, Reference Stickler2004; La Peyre, unpublished observations). A substantial decrease in weighted prevalence, a semi-quantitative measure of infection levels in tissue subsamples, in late winter and early spring was also observed at other locations in the Gulf of Mexico (Ray, Reference Ray1954; Soniat, Reference Soniat1985). Our in vitro results indicate that exposure to 4°C for less than a month would have minimal effect on P. marinus viability, hence the reduction in infection intensities in the Gulf of Mexico is not likely due to the direct effects of cooler temperatures on the parasites and suggests instead an active process of elimination by the oyster host defences as proposed in earlier studies (Ray, Reference Ray1954; Mackin, Reference Mackin1962).
Prolonged low temperatures are likely to play a more direct role in the reduction of P. marinus infection intensities in eastern oysters at higher latitudes, with cooler winters. Our in vitro results indicated an 86% reduction in the number of viable trophozoites after 3 months of exposure to 2°C following a month during which temperature was decreased from 18°C at a rate of 0·5°C per day. This decrease in viability explains the gradual decrease in infection intensities generally observed in winter in eastern oysters along the central and northeastern Atlantic coasts (Andrews, Reference Andrews1988; Burreson and Ragone Calvo, Reference Burreson and Ragone Calvo1996; Bushek et al. Reference Bushek, Ford and Allen1994; Oliver et al. Reference Oliver, Fisher, Ford, Ragone Calvo, Burreson, Sutton and Gandy1998). Water temperatures are generally below 5°C for about 8 weeks in the Chesapeake Bay (Burreson and Ragone Calvo, Reference Burreson and Ragone Calvo1996) and for 2–3 months (i.e. winter of 1996–1997) in New England waters (Ford and Smolowitz, Reference Ford and Smolowitz2007). While cold temperatures explain the decrease of a large number of parasites (i.e. 86%) in winter, by about a log factor, it does not, however, explain why infection intensities can be several log orders lower in the spring compared to winter (Oliver et al. Reference Oliver, Fisher, Ford, Ragone Calvo, Burreson, Sutton and Gandy1998). The sharpest decrease in infection intensities of Long Island oysters, for example, was between March and May when water temperatures at the time of sampling increased from 2·2 to 13·1°C (Oliver et al. Reference Oliver, Fisher, Ford, Ragone Calvo, Burreson, Sutton and Gandy1998). Such an increase in temperature is, however, unlikely to cause a large decrease in the number of viable parasites as P. marinus transferred from 2, 4 and 6°C directly to 28°C showed little immediate change in viability (data not shown).
In previous studies, decreasing P. marinus infection intensities in Chesapeake Bay oysters occurred during periods of lowest temperatures (<5°C) (Burreson and Ragone Calvo, Reference Burreson and Ragone Calvo1996; Ragone Calvo et al. Reference Ragone Calvo, Wetzel and Burreson2000) as would be expected from our in vitro data. However, P. marinus prevalence and intensity in the Chesapeake Bay oysters continued to decrease as temperatures increased in spring, and reached a minimum about 2 months after the period of minimum temperature (Burreson and Ragone Calvo, Reference Burreson and Ragone Calvo1996; Ragone Calvo et al. Reference Ragone Calvo, Wetzel and Burreson2000). Although this temporal shift in the period of minimum infection intensity and minimum temperature has been attributed to a lag in the effect of low temperatures on P. marinus (Ragone Calvo et al. Reference Ragone Calvo, Wetzel and Burreson2000), it is not clear why infection intensities should continue to decrease as spring temperatures rise. A likely plausible physiological explanation is that the decrease in infection intensities as temperatures rise, involves an active process of elimination by the oyster host defences as proposed in earlier studies (Andrews and Hewatt, Reference Andrews and Hewatt1957; Ragone Calvo and Burreson, Reference Ragone Calvo and Burreson1994). Only 1 study has investigated changes in parasite numbers in oysters maintained at 15°C to mimic spring temperature conditions, but no parasite elimination was observed after 11 weeks (Ford et al. Reference Ford, Schotthoefer and Spruck1999). This study, however, was conducted in the laboratory which may have affected the oysters' ability to eliminate parasites, and the temperature value and regimen may not have been suitable for parasite elimination (Ragone Calvo et al. Reference Ragone Calvo, Wetzel and Burreson2000). Additional studies are urgently needed to elucidate the conditions under which and the mechanisms by which P. marinus are eliminated from eastern oysters.
The number of parasites remaining in spring is likely critical to P. marinus infection intensification and transmission as water temperature becomes favourable for P. marinus proliferation (>20°C). While the number of parasites is generally low (<10 000) in spring, log-order differences in their numbers (e.g. 10 versus 10 000) would be expected to have important effects on the progression of the disease as water temperature increases. Higher numbers of parasites in the spring would result in infection intensification earlier in the year, lengthening the period favourable for P. marinus to kill older already infected oysters and to infect the youngest generation of oysters (i.e. ~1 year old), thus fostering the development of epizootics. A higher number of parasites in the spring may be due to warmer than average spring temperatures that could limit the ability of oysters to eliminate P. marinus in this critical period, therefore shifting the host-parasite balance in favour of the parasite, as suggested by Andrews (Reference Andrews1988). In contrast, cooler than average spring temperatures could favour elimination of the parasites so that infection intensification would be delayed and transmission curtailed. Interestingly, Ford (Reference Ford1996) indicated that the failure of P. marinus to cause epizootic mortalities in Delaware Bay during the 1950s was likely due to slow development of infection which did not begin to increase until August or September and that water temperature fell below 20°C in late September before significant mortalities occurred. Moreover, the greatest change in sea surface water temperatures in the Gulf of Maine (off the coast of Maine and New Hampshire) and South Shore of New England (i.e. from Cape Cod, Massachusetts to Long Island, New York) between 1855 and 2001 was recorded in the spring (Gulf of Maine 19·1%, South Shore 18%) and not winter (Gulf of Maine 5·2%, South Shore 5·1%), summer (Gulf of Maine 7·8%, South Shore 7·4%) or fall seasons (Gulf of Maine 4·5%, South Shore 4·9%) (http://cleanair-coolplanet.org/information/pdf/indicators.pdf, Indicators of climate Change in the Northeast 2005, The Climate Change Research Center, University of New Hampshire). Spring water temperatures may therefore be more critical than winter temperatures in predicting P. marinus infection intensification and transmission and a more accurate indicator of epizootics. It is clear that analysis of the relationships between spring water temperatures and summer infection intensities is urgently needed and may lead to the development of a more realistic model for forecasting P. marinus epizootics. Moreover, the relationship between the numbers of days of the year during which temperature favours net proliferation of the parasites in oysters (i.e. >20°C) and summer infection intensities also need to be analysed as that number can be expected to change.
Although temperature is clearly a major factor controlling P. marinus epizootiology, other factors can also be critical in the development or abatement of epizootics (Burreson and Ragone Calvo, Reference Burreson and Ragone Calvo1996; Soniat, Reference Soniat1996). Elevated salinities due to drought, for example, are believed to have contributed significantly, along with warmer than average water temperatures, to the spread of P. marinus in the Chesapeake Bay in the 1980s and 1990s (Burreson and Ragone Calvo, Reference Burreson and Ragone Calvo1996). While the effects of low temperature and low salinity on P. marinus and P. olseni have now been studied separately (La Peyre et al. Reference La Peyre, Casas and La Peyre2006; this study), further studies on the synergistic effect of low temperature and low salinity are needed as their combined effect may be more important in regulating P. marinus epizootic than either condition alone (Ragone Calvo and Burreson, Reference Burreson, Ragone Calvo, La Peyre, Counts and Paynter1994; Soniat, Reference Soniat1996; Ford and Smolowitz, Reference Ford and Smolowitz2007). Analysis of the influence of other factors including the timing of the spring bloom in relation to spring temperatures and host reproductive physiology and health on P. marinus infection intensities which have also been proposed, is necessary to better understand observed patterns of P. marinus abundance and develop a more realistic model of the disease processes (Soniat, Reference Soniat1996).
Information on the effects of temperature specifically on P. marinus trophozoite growth can be concluded from studies on in vitro culture optimization (Dungan and Hamilton, Reference Dungan and Hamilton1995; Gauthier and Vasta, Reference Gauthier and Vasta1995; La Peyre and Faisal, Reference La Peyre and Faisal1996). These studies show optimum proliferation of P. marinus at 28°C, but they differ in the results obtained at suboptimal temperatures, with growth reported at temperatures ranging from 10 to 40°C (Dungan and Hamilton, Reference Dungan and Hamilton1995), 20 to 32°C (Gauthier and Vasta, Reference Gauthier and Vasta1995) and 17 to 28°C (La Peyre and Faisal, Reference La Peyre and Faisal1996). These differing results obtained at suboptimal temperatures are most likely due to limitations of the different growth assays used which may or may not measure actual cell proliferation because cell densities are not always measured directly (reviewed by La Peyre, Reference La Peyre1996). Perkinsus marinus mitochondrial dehydrogenase activity, for example, which can be assayed using tetrazolium salt (CellTiter 96 AQTM, Promega, Madison, Wisconsin), is a measure of the parasite instantaneous metabolic activity that is often used to estimate the number of viable cells and cell proliferation (Dungan and Hamilton, Reference Dungan and Hamilton1995; Soudant et al. Reference Soudant, Chu and Lund2005; Ford and Chintala, Reference Ford and Chintala2006). Perkinsus marinus mitochondrial activity can be expected to vary not only as a function of cell number and size (biovolume) as shown by Dungan and Hamilton (Reference Dungan and Hamilton1995), but also as a function of the metabolic state of the cells that varies with the culture growth phase. Measurement of mitochondrial activity must therefore be used with caution when estimating cell proliferation (La Peyre, Reference La Peyre1996). Division of the mitochondrial activity data of a cell population by its biovolume should, however, provide a good estimate of the cell population metabolic state or ‘intrinsic metabolic activity’.
In our study, chemical reduction of growth medium resulting from Perkinsus species metabolic activity was measured using the alamarBlue assay (Alamar Biosciences Inc., Sacramento, California) which incorporates an oxidation-reduction indicator that changes from an oxidized (non-fluorescent, blue) form to a reduced (fluorescent, red) form. Similar to the measurements of metabolic activity obtained by the CellTiter assay, measurements of metabolic activity obtained by the alamarBlue assay will vary as a function of size, number and metabolic state of the parasites. By measuring the densities, viabilities, and trophozoite and schizont percentages and sizes of cell populations sampled in our study, we were able to calculate the instantaneous metabolic activity per biovolume of any cell population and hence compare the metabolic states of P. marinus and P. olseni isolates maintained at the different temperatures. Moreover, repeated sampling over several weeks revealed that the metabolic states of P. marinus and P. olseni in cultures can change significantly. Intrinsic metabolic activities of P. marinus and P. olseni maintained at 4°C for 30 days, for example, decreased by about 90% from their initial values. The extent of the metabolic depression is within the range found in animals, including protozoans, in response to environmental stress (Guppy and Withers, Reference Guppy and Withers1999). Likewise P. marinus and P. olseni intrinsic metabolic activities at 15°C initially decreased from Day 0 to Day 8. This decrease was probably due to stress from transfer from 28 to 15°C because we have found that stress proteins (i.e. hsp70) were induced in P. marinus transferred from 28 to 18°C (La Peyre, unpublished data). The initial decrease in intrinsic metabolic activities were then followed by several folds increase in intrinsic metabolic activities concomitant with proliferation of all P. olseni isolates by Day 16 and 2 out of the 3 P. marinus isolates by Day 24. Finally, a decrease in P. olseni intrinsic metabolic activities on Day 24 could be due to the depletion of culture medium nutrients. A decrease in intrinsic metabolic activities was also observed at 28°C by Day 8 and Day 12 following P. marinus and P. olseni active proliferation and could also be the result of nutrient depletion from the culture medium.
Of note, P. olseni intrinsic metabolic activity was generally higher than P. marinus raising interesting questions about the significance of intrinsic metabolic activity to Perkinsus species' pathogenicity. With the higher intrinsic metabolic activity, P. olseni would be expected to place a greater demand on the host nutritional resources. The consequence of this greater nutritional demand, however, will likely depend on the extent of the demand and the capacity of the specific host species to tolerate or compensate for resource competition from the parasite.
Another interesting finding was that the difference in intrinsic metabolic activities (and other parameters measured) between isolates of each species were generally more pronounced for P. olseni than P. marinus. Perkinsus olseni, a widely distributed species with a wide range of hosts, may have greater genetic variation than other Perkinsus spp. and hence a more varied response to environmental conditions including temperature. The extent to which P. olseni isolates from around the world respond differently to temperature and their pathogenicity or virulence, however, remains to be determined empirically.
Conclusions
Data on the extent of P. marinus and P. olseni survival and proliferation at low temperatures and in the absence of any host influences were obtained for the first time providing critical information for interpreting changes in parasite numbers in their respective hosts. Our in vitro results showed that P. olseni actively proliferates at 15°C suggesting that perkinsosis is not always a warm water disease. Furthermore, P. olseni and P. marinus differed in their measured responses in that (1) P. olseni was less affected by lower temperatures than P. marinus, (2) P. olseni isolates showed greater variation than P. marinus isolates in all parameters measured in this study and (3) P. olseni intrinsic metabolic activity was generally higher than P. marinus. More explicit studies on P. olseni, including isolates from a diversity of locations would help elucidate better the full temperature range and potential for this Perkinsus species.
For P. marinus, our study provides information critical to understanding seasonal changes in parasite numbers in the host and the role of temperature in initiating epizootics. Specifically, our results support past findings and models that indicate that decreasing P. marinus infection intensities with decreasing temperatures likely reflect a temperature-associated decrease in parasite viability (i.e. Burreson and Ragone Calvo, Reference La Peyre and Faisal1996; Ragone Calvo et al. Reference Ragone Calvo, Wetzel and Burreson2000). Furthermore, our findings demonstrate that exposure to 4°C for less than 1 month would have minimal effect on P. marinus infection intensities. For the Gulf of Mexico, where temperatures rarely reach 4°C, reduction in infection intensities is thus not likely due to the direct effects of cooler temperatures on the parasites and strongly supports instead the hypothesis that there is an active process of elimination by the oyster host defences (Ray, Reference Ray1954; Mackin, Reference Mackin1962). Combined with our well-documented understanding of seasonal parasite infection dynamics in the Gulf of Mexico and along the Atlantic coast, with lowest parasite infection intensities occurring during the warming spring months (Burreson and Ragone Calvo, Reference Burreson and Ragone Calvo1996; Oliver et al. Reference Oliver, Fisher, Ford, Ragone Calvo, Burreson, Sutton and Gandy1998; Ragone Calvo et al. Reference Ragone Calvo, Wetzel and Burreson2000), these findings suggest that spring season water temperatures may be critical in determining P. marinus epizootics by controlling the timing of the shift in the host-parasite balance; warmer than average spring temperatures may limit the ability of the oysters to actively eliminate P. marinus, leading to epizootics. While temperature clearly controls P. olseni and P. marinus epizootiology, in contrast to findings from other parasites (Harvell et al. Reference Harvell, Mitchell, Ward, Altizer, Dobson, Ostfeld and Samuel2002), winter temperatures alone appear not to be the key to controlling the diseases that Perkinsus species cause.
We thank Amy Nickens, previously of the Department of Veterinary Science at Louisiana State University Agricultural Center, for technical assistance, Dr Kwang-Sik Choi for providing references on South Korea's water temperatures and 3 anonymous reviewers for their helpful comments. The research was funded through the Louisiana Sea Grant College Program and the National Sea Grant Gulf Oyster Industry Program. LSU AgCenter contribution number 2007-242-1240