INTRODUCTION
The history of Holocene climate dynamics is critical for a better understanding of natural climate variability under comparable boundary conditions (e.g., similar ice-sheet sizes, sea level, and atmospheric CO2 concentrations), particularly prior to the Industrial Revolution. This knowledge is also useful for detecting anthropogenic impacts on climate. However, Holocene climate changes have high spatiotemporal variability (e.g., Mayewski, Reference Mayewski, Rohling, Stager, Karlén, Maasch, Meeker and Meyerson2004; Neukom et al., Reference Neukom, Steiger, Gomez-Navarro, Wang and Werner2019), which complicates achieving a systematic understanding. Therefore, it is essential to extract the characteristic Holocene variation pattern of each component of the climate system to better identify linkages between these components, and to examine the ultimate forcing(s) behind widespread changes in the climate system.
The North Pacific Ocean is the largest geographic feature in the Northern Hemisphere, and its interactions with the overlying atmosphere drives critical components of the global climate system (e.g., Di Lorenzo et al., Reference Di Lorenzo, Schneider, Cobb, Franks, Chhak, Miller and McWilliams2008). The Aleutian Low (AL), the semi-permanent atmospheric low-pressure system centered near the Aleutian Islands, is closely linked to environmental change in the North Pacific and surrounding continental areas. The AL is most intense during the late fall to winter season, and weakens greatly during summer (Beamish and Bouillon, Reference Beamish and Bouillon1993). The average intensity and position of the AL shows large variation at annual and decadal timescales (Overland et al., Reference Overland, Adams and Bond1999). This environmental variability occurs at multiple spatial scales, ranging from local effects within the Bering Sea and Gulf of Alaska, to teleconnections with Mexico and the southeastern United States (Latif and Barnett, Reference Latif and Barnett1994; Trenberth and Hurrell, Reference Trenberth and Hurrell1994; Rodionov et al., Reference Rodionov, Bond and Overland2007). For example, twentieth century decadal variability of the AL intensity and position has been reported to affect salmon abundance in the Northeast Pacific Ocean (Francis and Hare, Reference Francis and Hare1994), Alaskan fjord biogenic sediment accumulation (Addison et al., Reference Addison, Finney, Jaeger, Stoner, Norris and Hangsterfer2013), and spatial patterns of precipitation across western North America (e.g., Mantua et al., Reference Mantua, Hare, Zhang, Wallace and Francis1997). These complex and wide-ranging effects highlight the need for better understanding of Holocene AL variability and potential impacts under future climate projections.
Paleoclimate reconstructions of Aleutian Low variability
Tree-ring reconstructions describe Pacific environmental variability and associated AL dynamics at the highest levels of spatiotemporal resolution, allowing reconstructions at sub-annual timescales over the recent climate record (e.g., Cook et al., Reference Cook, Meko, Stahle and Cleaveland1999; Biondi et al., Reference Biondi, Gershunov and Cayan2001; D'Arrigo et al., Reference D'Arrigo, Villalba and Wiles2001; MacDonald and Case, Reference MacDonald and Case2005; and others). However, these datasets are limited to relatively short time spans, because most of these studies are less than 1000 years old. For timescales that exceed the last 1000 years, AL variations have been interpreted from other, lower time-resolution paleoclimatic proxy archives, such as sodium concentrations in the ice-core dataset from the Mt. Logan summit in Canada (Fisher et al., Reference Fisher, Osterberg, Dyke, Dahl-Jensen, Demuth, Zdanowicz and Bourgeois2008; Osterberg et al., Reference Osterberg, Mayewski, Fisher, Kreutz, Maasch, Sneed and Kelsey2014, Reference Osterberg, Winski, Kreutz, Wake, Ferris, Campbell, Introne, Handley and Birkel2017). According to Osterberg et al. (Reference Osterberg, Mayewski, Fisher, Kreutz, Maasch, Sneed and Kelsey2014), the strong surface winds and enhanced uplift during stronger AL phases increases the sea salt concentration in the air that is transported efficiently to Mt. Logan. The correlation between the sodium concentration at Mt. Logan and the North Pacific Index (NPI), which describes the strength of the AL (Trenberth and Hurrell, Reference Trenberth and Hurrell1994), over recent instrumental timescales is statistically significant (r = -0.45, Osterberg et al., Reference Osterberg, Mayewski, Fisher, Kreutz, Maasch, Sneed and Kelsey2014). However, the relatively low correlation value suggests the presence of further factors in addition to AL intensity that may also affect the paleoclimatic interpretation.
Select δ18O archives preserved in sedimentary calcite, diatom, peat, and speleothems derived from the Aleutian Islands, mainland Alaska, northwestern Canada, and the United States (e.g., Anderson et al., Reference Anderson, Abbott, Finney and Burns2005, Reference Anderson, Berkelhammer, Barron, Steinman, Finney and Abbott2016; Anderson, Reference Anderson2011; Bailey et al., Reference Bailey, Kaufman, Sloane, Hubbard, Henderson, Leng, Meyer and Welker2018) provide other sources of paleoclimatic insight into Holocene AL behavior based on the interpretation that these records primarily reflect the δ18O of precipitation due to large-scale atmospheric circulation patterns affected by AL dynamics. Berkelhammer et al. (Reference Berkelhammer, Stott, Yoshimura, Johnson and Sinha2012) suggested that intensity and position of the AL control precipitation δ18O values in North America based on numerical simulations of precipitation δ18O using the Isotopes-incorporated Global Spectral Model (IsoGSM). The AL variability is closely linked with the Pacific North American (PNA) teleconnection pattern, which is one of the most prominent modes of atmospheric variability over the North Pacific Ocean and North American continent, with the positive phase of the PNA pattern associated with above-average barometric pressure heights in the vicinity of Hawaii and over the intermontane region of North America, and below-average barometric pressure heights located south of the Aleutian Islands (strengthened AL) and over the southeastern United States (Wallace and Gutzler, Reference Wallace and Gutzler1981); the PNA index shows high correlation with simulated δ18O value in annual and winter precipitation over North America during AD 1950–2005 (Liu et al., Reference Liu, Yoshimura, Bowen, Buenning, Risi, Welker and Yuan2014), supporting the possible role of AL on the precipitation δ18O over North America.
Based on the relation between precipitation δ18O and PNA, Liu et al. (Reference Liu, Yoshimura, Bowen, Buenning, Risi, Welker and Yuan2014) demonstrated possible changes from a negative to positive PNA-like mean state occurred during the mid- to late Holocene using paired δ18O records from northwestern and southeastern North America, which correspond with a multimillennial-scale shift from a weak to strong AL system. Similar shifts of δ18O values at around 4 ka have also been documented by Kaufman et al. (Reference Kaufman, Axford, Henderson, McKay, Oswald, Saenger and Anderson2016) from compiled δ18O records in the northern Gulf of Alaska area (Jellybean Lake, Anderson et al., Reference Anderson, Abbott, Finney and Burns2005; Horse Trail Fen, Jones et al., Reference Jones, Wooller and Peteet2014; Mica Lake, Schiff et al., Reference Schiff, Kaufman, Wolfe, Dodd and Sharp2009). However, except for the common change between mid- and late Holocene observed at multiple locations, the δ18O records show large spatiotemporal variability across mainland Alaska, the northern Gulf of Alaska, and the contiguous United States. Such heterogeneous trends could be explained by the complex patterns of precipitation δ18O anomalies associated with AL behavior (Berkelhammer et al., Reference Berkelhammer, Stott, Yoshimura, Johnson and Sinha2012), which are also complicated by both changes in intensity and spatial position changes (e.g., Rodionov et al., Reference Rodinov, Overland and Bond2005; Sugimoto and Hanawa, Reference Sugimoto and Hanawa2009). Furthermore, large age uncertainties of sedimentary records and a variety of other local influences on δ18O values including topography, temperature, and effective moisture (precipitation minus evaporation) could further contribute to spatiotemporal differences in paleoclimatic δ18O variability (e.g., Anderson et al., Reference Anderson, Berkelhammer, Barron, Steinman, Finney and Abbott2016). These differences between δ18O records have caused considerable difficulties in reconstructing consistent long records of AL variability (Newman et al., Reference Newman, Alexander, Ault, Cobb, Deser, Di Lorenzo and Mantua2016).
The climate mechanism(s) that are responsible for generating AL changes over recent instrumental timescales are also poorly understood. One important component is the Westerly Jet (WJ), which flows at an altitude of approximately 9–16 km above sea level and circles the globe along a meandering path, and which is closely associated with hemispheric-scale climate changes. Recent meteorological records indicate that the AL is sensitive to the dynamics of the WJ over East Asia and the North Pacific Ocean, with impacts observed on cyclogenesis, monsoon development, and storm tracks (e.g., White and Barnett, Reference White and Barnett1972; Lau, Reference Lau1988; Dole and Black, Reference Dole and Black1990; Nakamura et al., Reference Nakamura, Izumi and Sampe2002; Yang et al., Reference Yang, Lau and Kim2002; Athanasiadis et al., Reference Athanasiadis, Wallace and Wettstein2010; Park and An, Reference Park and An2014). However, at timescales that exceed the recent instrumental record, the interactions between the AL and the WJ are virtually unknown.
The limited paleoclimatic history of the AL and its interactions with other components of the climate system indicate these high-priority questions remain to be answered:
• What is the timing and nature (intensity and/or position) of AL variability during the Holocene?
• Is there evidence of linkages between the AL and WJ at centennial and longer timescales?
• What are the external drivers of AL variability?
The present study was designed to address these questions by (i) conducting multivariate principal component analysis (PCA) using published δ18O records from Alaska, northwestern Canada, and the western United States to eliminate local environmental effects on each δ18O record; (ii) identifying common pattern(s) of δ18O anomalies across such areas since 7.5 ka, and trace multi-centennial and longer AL variations; (iii) compare the reconstructed AL variations with records of the WJ in East Asia and the western North Pacific Ocean to determine linkages; and (iv) use these combined AL and WJ datasets to better clarify dynamic changes in North Pacific atmospheric circulation and elucidate the potential triggers of Holocene climate variability.
DATA USED FOR PRINCIPAL COMPONENT ANALYSIS
Many δ18O profiles covering part or all of the Holocene have been reported from Alaska, Canada, and the central and northwestern United States. These include δ18O of calcite or opal in lake sediments (e.g., Anderson et al., Reference Anderson, Abbott, Finney and Burns2005; Schiff et al., Reference Schiff, Kaufman, Wolfe, Dodd and Sharp2009; Clegg and Hu, Reference Clegg and Hu2010; Anderson, Reference Anderson2011, Reference Anderson2012; Steinman and Abbott, Reference Steinman and Abbott2013; Wooller et al., Reference Wooller, Kurek, Gaglioti, Cwynar, Bigelow, Reuther, Gelvin-Reymiller and Smol2012; Yuan et al., Reference Yuan, Koran and Valdez2013), organic matter in peat (Jones et al., Reference Jones, Wooller and Peteet2014), ice (Fisher et al., Reference Fisher, Osterberg, Dyke, Dahl-Jensen, Demuth, Zdanowicz and Bourgeois2008), and speleothem carbonate (Ersek et al., Reference Ersek, Clark, Mix, Cheng and Edwards2012). For this analysis, paleoclimatic δ18O records with sample resolution exceeding one data point every 250 years and durations that include the last 7.5 ka were selected for PCA.
A key second requirement for the PCA input dataset was that records are more sensitive to precipitation δ18O and had minimal evaporation-caused fractionation effects. Anderson et al. (Reference Anderson, Berkelhammer, Barron, Steinman, Finney and Abbott2016) compiled lake water δ18O and δ2H values from western North America and identified eight spatial groups (Colorado/Utah, eastern Washington, Montana/Idaho/Wyoming, British Columbia/Alberta, Yukon Territory, Alaska-central interior, Alaska-Brooks Range, and Alaska-northeast interior) using an analysis of regional evaporation water lines and the Global Meteoric Water Line (fig. 2 in Anderson et al., Reference Anderson, Berkelhammer, Barron, Steinman, Finney and Abbott2016). The record from each regional group that showed the smallest influence from evaporative effects, as well as met the requirements for sample resolution and duration, was selected for further analysis.
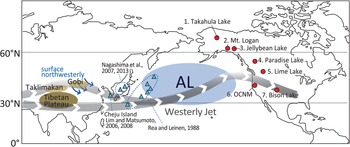
Seven δ18O records met the above criteria (Table 1, Fig. 1), including: 1) sedimentary calcite from Takahula Lake, south-central Brooks Range, Alaska (Clegg and Hu, Reference Clegg and Hu2010); 2) Mt. Logan ice core, northwestern Canada (Fisher et al., Reference Fisher, Osterberg, Dyke, Dahl-Jensen, Demuth, Zdanowicz and Bourgeois2008; Osterberg et al., Reference Osterberg, Mayewski, Fisher, Kreutz, Maasch, Sneed and Kelsey2014, Reference Osterberg, Winski, Kreutz, Wake, Ferris, Campbell, Introne, Handley and Birkel2017); 3) sedimentary calcite from Jellybean Lake, Yukon Territory, Canada (Anderson et al., Reference Anderson, Abbott, Finney and Burns2005); 4) sedimentary calcite from Paradise Lake, central British Columbia (Steinman et al., Reference Steinman, Pompeani, Abbott, Ortiz, Stansell, Finkenbinder, Mihindukulasooriya and Hillman2016); 5) sedimentary calcite from Lime Lake, eastern Washington (Steinman et al., Reference Steinman, Pompeani, Abbott, Ortiz, Stansell, Finkenbinder, Mihindukulasooriya and Hillman2016); 6) sedimentary calcite from Bison Lake, Central Rocky Mountains, central United States (Anderson, Reference Anderson2011), and; 7) a speleothem deposit from Oregon Caves National Monument (OCNM) in southwestern Oregon, western United States (Ersek et al., Reference Ersek, Clark, Mix, Cheng and Edwards2012).
Schematic of North Pacific winter atmospheric circulation patterns and location of sites with δ18O records used in this study for Aleutian Low (AL; red circles) and Westerly Jet (WJ; blue triangles) reconstructions. The number adjacent to each red circle corresponds to the site number in Table 1.

Western North America paleoclimate δ18O proxy records used in this study.

Each of these δ18O records was examined in terms of a combination of hydrological settings, relationship between lake water δ18O and δ2H, and its seasonality changes (Anderson et al., Reference Anderson, Abbott, Finney and Burns2005; Clegg and Hu, Reference Clegg and Hu2010; Anderson, Reference Anderson2011; Steinman et al., Reference Steinman, Pompeani, Abbott, Ortiz, Stansell, Finkenbinder, Mihindukulasooriya and Hillman2016), meteorological data (Fisher et al., Reference Fisher, Osterberg, Dyke, Dahl-Jensen, Demuth, Zdanowicz and Bourgeois2008; Ersek et al., Reference Ersek, Clark, Mix, Cheng and Edwards2012), and lake hydrologic and/or isotope mass balance modeling (Steinman et al., Reference Steinman, Pompeani, Abbott, Ortiz, Stansell, Finkenbinder, Mihindukulasooriya and Hillman2016). The records from Takahula and Paradise Lakes are characterized by closed-basin isotope systems, and are reported to be influenced by many factors such as effective moisture, temperature, source area of moisture (e.g., atmospheric circulation patterns), precipitation amount and seasonality (Clegg and Hu, Reference Clegg and Hu2010; Steinman et al., Reference Steinman, Pompeani, Abbott, Ortiz, Stansell, Finkenbinder, Mihindukulasooriya and Hillman2016). In contrast, the δ18O record from Jellybean Lake (an open-basin system) was originally thought to result from isotope fractionation during moisture transport from the Gulf of Alaska across the St. Elias Mountains that reflected atmospheric circulation patterns (Anderson et al., Reference Anderson, Abbott, Finney and Burns2005). However, Anderson et al. (Reference Anderson, Berkelhammer, Barron, Steinman, Finney and Abbott2016) revised their original interpretation to moisture source change because the relationship between δ18O of Jellybean Lake and NPI was oppositely reported in Anderson et al. (Reference Anderson, Abbott, Finney and Burns2005).
Similarly, records from open-basin Lime and Bison Lakes were interpreted as being influenced by precipitation δ18O values that reflect atmospheric circulation patterns and seasonality of precipitation (Steinman et al., Reference Steinman, Pompeani, Abbott, Ortiz, Stansell, Finkenbinder, Mihindukulasooriya and Hillman2016; Anderson, Reference Anderson2011). The dominant signal in the δ18O record from Mt. Logan is thought to represent source area of moisture (Fisher et al., Reference Fisher, Osterberg, Dyke, Dahl-Jensen, Demuth, Zdanowicz and Bourgeois2008; Osterberg et al., Reference Osterberg, Mayewski, Fisher, Kreutz, Maasch, Sneed and Kelsey2014, Reference Osterberg, Winski, Kreutz, Wake, Ferris, Campbell, Introne, Handley and Birkel2017), while the OCNM speleothem δ18O data mainly represents temperature (Ersek et al., Reference Ersek, Clark, Mix, Cheng and Edwards2012).
METHODOLOGY
Principal Component Analysis
Principal Component Analysis (PCA) reduces the complexity of multivariate data into a few interpretable directions of variability, or principal components, that represent synthetic variables and explain cumulative independent proportions of variance within the raw data (ter Braak and Prentice, Reference Ter Braak and Prentice1988). PCA (also known as Empirical Orthogonal Function analysis [EOF]) has been applied to modern climatology, oceanography, and paleoclimatology variables to extract climate dynamics behind the spatial distribution of observational/proxy datasets (e.g., Mantua et al., Reference Mantua, Hare, Zhang, Wallace and Francis1997; Thompson and Wallace, Reference Thompson and Wallace1998; Kaplan and Wolfe, Reference Kaplan and Wolfe2006; Harada et al., Reference Harada, Sato, Seki, Timmermann, Moossen, Bendle and Nakamura2012). In this study, we conducted PCA to empirically find common δ18O patterns of variability among stations selected from a wide geographic area in western North America. Since each δ18O record should be regarded as a superposition of both regional and local components, PCA can be useful for extracting regional components from these multiple δ18O records. Because AL intensity and position largely determine precipitation δ18O values and winter precipitation amounts over western North America (Berkelhammer et al., Reference Berkelhammer, Stott, Yoshimura, Johnson and Sinha2012; Liu et al., Reference Liu, Yoshimura, Bowen, Buenning, Risi, Welker and Yuan2014), comparisons between the spatial loading patterns of each Principal Component (PC) and (i) the winter precipitation amount from reanalysis datasets (NOAA-20C reanalysis, Compo et al., Reference Compo, Whitaker, Sardeshmukh, Matsui, Allen, Allan and Yin2011; NCEP II Reanalysis, Kanamitsu et al., Reference Kanamitsu, Kumar, Juang, Schemm, Wang, Yang and Hong2002) and (ii) the simulated δ18O anomalies using IsoGSM (Yoshimura et al., Reference Yoshimura, Kanamitsu, Noone and Oki2008; Berkelhammer et al., Reference Berkelhammer, Stott, Yoshimura, Johnson and Sinha2012; Yoshimura, Reference Yoshimura2015) are useful for evaluating possible AL relationships with each calculated PC.
PCA was applied to the seven δ18O profiles for the time range of 7.5–0.4 ka, after 1) calculating mean δ18O values at 50-yr time steps for each record after considering age uncertainties (see the following subsection) and 2) standardizing to a mean of 0 and a standard deviation of 1. The resultant PCA had two components with eigenvalues that exceeded 1.0, which together account for 68% variance explained in the underlying data (Supplementary Figure 1a). When examining the extracted communalities (e.g., the variance in each dataset that is explained by the PCA method; Supplementary Figure 1b), the median value of 69% demonstrates that PCA is a good descriptor of the combined δ18O dataset. This is further confirmed by a Kaiser-Meyer-Olkin value of 0.620, which indicates that some of the underlying variance among datasets may be explained by common variance; values greater than 0.6 are considered adequate for PCA (Kaiser, Reference Kaiser1974; Cerny and Kaiser, Reference Cerny and Kaiser1977). Finally, the PCA analysis also exceeded a significance test of <0.0001 for the Bartlett's Test of Sphericity, which tests if the PCA correlation matrix is different from an identity matrix; this result signifies there are related features in the source data that can be described by PCA. Taken together, these diagnostic analyses show that the selected δ18O records have shared underlying properties that are appropriate for examination using the PCA method.
Method for δ18O smoothing based on age uncertainties
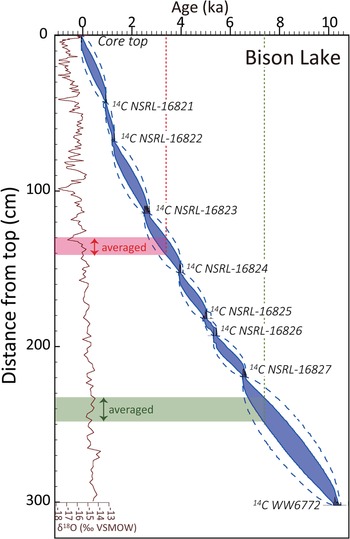
To apply the PCA method to paleoclimate proxy records that have independent age models, a new technique that averages the raw data of selected sample intervals with respect to age uncertainties was developed. First, age uncertainties (1σ) were calculated by a Bayesian age-depth model using OxCal software 4.3.2 (Bronk Ramsey, Reference Bronk Ramsey2009; https://c14.arch.ox.ac.uk/oxcal.html). The model used the age datums reported in each original reference, such as 14C, 210Pb, and U-Th ages (Table 1, Supplementary Figure 2). The age uncertainties compared against sample depths indicate the statistically possible range of sample depths that correspond with each age, as is schematically shown for the Bison Lake age-depth model example in Figure 2. Through averaging the δ18O value within the corresponding depth interval for each age, we could eliminate any possible biases on PCA originated from uncertainty in the correlation of isotope variations among sites (Fig. 3). This averaging process was conducted for the δ18O profile with linear interpolation at 0.03 mm depth intervals for OCNM and 0.1 cm depth intervals for the remaining records.
A schematic example showing the δ18O smoothing method based on age uncertainties estimated by a Bayesian approach (Bronk Ramsey, Reference Bronk Ramsey2009) for the case of Bison Lake (Anderson, Reference Anderson2011). Shaded blue area and dotted blue lines indicate the modeled error envelope at 1σ and 2σ levels, respectively. Shaded red and green areas show depth intervals of averaged δ18O data for two example time periods at 3.4 and 7.4 ka, respectively.

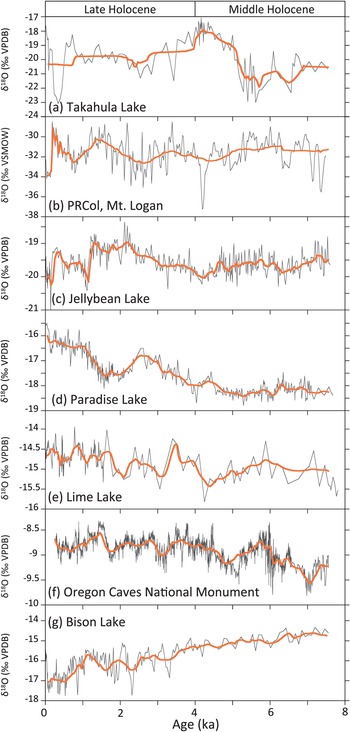
Millennial-scale comparison of δ18O records used in the PCA: (a) sedimentary calcite from Takahula Lake, Alaska (Clegg and Hu, Reference Clegg and Hu2010); (b) Mt. Logan ice core, northwestern Canada (Fisher et al., Reference Fisher, Osterberg, Dyke, Dahl-Jensen, Demuth, Zdanowicz and Bourgeois2008; Osterberg et al., Reference Osterberg, Mayewski, Fisher, Kreutz, Maasch, Sneed and Kelsey2014, Reference Osterberg, Winski, Kreutz, Wake, Ferris, Campbell, Introne, Handley and Birkel2017); (c) sedimentary calcite from Jellybean Lake, Yukon Territory (Anderson et al., Reference Anderson, Abbott, Finney and Burns2005); (d) sedimentary calcite from Paradise Lake, Central British Columbia (Steinman et al., Reference Steinman, Pompeani, Abbott, Ortiz, Stansell, Finkenbinder, Mihindukulasooriya and Hillman2016); (e) sedimentary calcite from Lime Lake, Eastern Washington (Steinman et al., Reference Steinman, Pompeani, Abbott, Ortiz, Stansell, Finkenbinder, Mihindukulasooriya and Hillman2016); (f) speleothem from Oregon Caves National Monuments (OCNM), western United States (Ersek et al., Reference Ersek, Clark, Mix, Cheng and Edwards2012); and (g) sedimentary calcite from Bison Lake, central United States (Anderson, Reference Anderson2011). Dark gray lines show raw data and thick orange lines show δ18O values averaged for the depth intervals determined by age uncertainties.

The age model for the Mt. Logan ice core is excluded from the preceding Bayesian treatment, as it was constructed using annual layer counting for the last 300 years and a theoretical accumulation model that placed a clear transition in electrical conductivity at 11.7 ka, based on a similar transition seen in Greenland (Fisher et al., Reference Fisher, Osterberg, Dyke, Dahl-Jensen, Demuth, Zdanowicz and Bourgeois2008). Instead, the δ18O averaging was conducted using original age uncertainties determined by the authors (Fisher et al., Reference Fisher, Osterberg, Dyke, Dahl-Jensen, Demuth, Zdanowicz and Bourgeois2008; ages younger than 0.3 ka ± 2 years, 0.6–0.3 ka ± 5%, and 4–0.6 ka ± 15%) and assuming a more conservative ± 20% between 7.5–4 ka as the age uncertainty for this time interval was not originally described. The averaging process between 6.3–0.4 ka was applied to the δ18O profile with linear interpolation at 0.1 m depth intervals, and for the portions of the Mt. Logan core that predate 6.3 ka, the original δ18O time intervals without linear interpolation were used because of pre-existing depth uncertainties (and accompanying time uncertainty) associated with the lower part of the core (Osterberg, E., personal communication, 2020). Finally, the temporal record of averaged δ18O was extracted with 50-yr time steps for each site and used for PCA.
RESULTS AND DISCUSSION
The δ18O records from western North America and results of Principal Component Analysis
The seven western North America δ18O records are spread across a large distance but nonetheless share several common features at millennial and longer timescales (Fig. 3). The δ18O records from Mt. Logan (Fig. 3b) and Jellybean Lake (Fig. 3c) show a similar pattern with local δ18O maxima at ~6 and 2–1.5 ka, and local minima between 4.5–4 and 1.2–0.5 ka. This δ18O pattern is generally opposite to results from Takahula Lake (Fig. 3a). These millennial-scale δ18O trends are not clearly recorded in records from central and western United States. Instead, the δ18O records from Paradise and Lime Lakes, and OCNM, show an increasing trend from the mid- to late Holocene punctuated with millennial-scale oscillations, while the δ18O record from Bison Lake is characterized by a semi-continuous decreasing trend from the mid- to late Holocene (Figs. 3d–g).
The different time-scale trends observed qualitatively from the seven δ18O records are further clarified by PCA. The first principal component (PC1) explains 42% of the variance, and has a temporal pattern that is characterized by a continuous increasing trend with negative values between 7.5–3.9 ka and positive values at 3.9–0.4 ka (Fig. 4a). Specific datasets associated with strong positive loadings for PC1 are observed at Paradise and Lime Lakes, and OCNM in the western United States, while strong negative loading is observed at Bison Lake (Fig. 4c). In addition, weak positive loadings are observed at Jellybean and Takahula Lakes. PC2 describes 24% of the data variance and is characterized by multi-centennial to millennial-scale trends with positive PC2 scores occurring at 7.5–5.1, 2.4–1.2, and 0.7–0.4 ka (Fig. 4b). Strong positive PC2 loadings are observed at Mt. Logan, Jellybean and Lime Lakes, while strong negative loadings are seen at Takahula Lake (Fig. 4d).
Principal Component Analysis (PCA) of δ18O records since 7.5 ka: (a) first principal component (PC1); (b) second principal component (PC2); (c) and (d) spatial distribution of δ18O records with loading scores corresponding to PC1 and PC2, respectively.

Principal Components and Aleutian Low variations
First Principal Component
The PC1 explains high variance (42%) and is dominated by high loading values observed across western North America. This common δ18O pattern among stations spread across western North America suggests local effects are likely not responsible for the similarities in δ18O variability reflected in PC1. The wide distribution of these associated sites suggests atmospheric circulation changes, including the AL system, have high potential to generate these similar δ18O changes (Berkelhammer et al., Reference Berkelhammer, Stott, Yoshimura, Johnson and Sinha2012; Liu et al., Reference Liu, Yoshimura, Bowen, Buenning, Risi, Welker and Yuan2014).
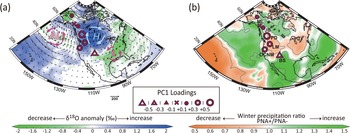
Placing the PCA loading results of the δ18O proxy data into a spatial context, the distribution of PC1 loading scores corresponds largely with the pattern of simulated δ18O anomalies that are associated with the PNA teleconnection pattern (Fig. 5a). The PNA simulation using IsoGSM reveals a positive anomaly (1–2‰) of precipitation δ18O in the winter season (December–March) over the northern to northwestern United States of ca. 40–70°N and 90–130°W in contrast to the strong negative anomaly over the southern to southeastern United States during PNA positive years (Liu et al., Reference Liu, Yoshimura, Bowen, Buenning, Risi, Welker and Yuan2014). These spatial features could be explained by the characteristic positive PNA atmospheric circulation pattern, where stronger AL and high pressure over the intermontane region of North America generate increased moisture transport from δ18O enriched tropical oceans to the northwestern United States, while δ18O depleted moisture accumulates in the southeast United States (Fig. 5a). The prominent positive δ18O anomalies in western North America represented by Paradise Lake, Lime Lake, and OCNM, and the negative δ18O anomaly at southernmost site of Bison Lake associated with the positive PC1 score at 3.9–0.4 ka show a good similarity with the characteristic northwestern enriched-southeastern depleted δ18O pattern of winter precipitation caused by the PNA positive state.
PC1 loadings compared to the (a) simulated winter (DJFM) precipitation δ18O and vertically integrated moisture flux (arrows; kg m-1 s-1) differences between PNA positive (PNA index > 0.5; n = 17) and negative (PNA index < 0.5: n = 14) years for AD 1950–2005 (PNA positive-PNA negative) using the Twentieth Century Isotope Reanalysis (IsoGSM20C, Yoshimura, Reference Yoshimura2015) after the method of Liu et al. (Reference Liu, Yoshimura, Bowen, Buenning, Risi, Welker and Yuan2014), (b) winter precipitation ratio between the PNA positive and negative years (amount of winter precipitation averaged for PNA positive years divided by that for PNA negative years) from NOAA-20C reanalysis (Compo et al., Reference Compo, Whitaker, Sardeshmukh, Matsui, Allen, Allan and Yin2011). The areas enclosed by the grey lines in (a) and (b) show significance at the P < 0.1 level for δ18O and winter precipitation differences between PNA positive and negative years, respectively. TH: Takahula Lake, ML: Mt. Logan, JB: Jellybean Lake, PD: Paradise Lake, LM: Lime Lake, OCNM: Oregon Caves National Monument, BS: Bison Lake.

Since the PNA also generates large shifts in winter precipitation amounts across wide areas of North America (Liu et al., Reference Liu, Tang, Jian, Poulsen, Welker and Bowen2017), further examination of precipitation seasonality is needed to test possible connections between PNA and the δ18O anomalies attributed to PC1. Precipitation δ18O tends to be depleted in winter compared to summer throughout western to northwestern North America (Vachon et al., Reference Vachon, White, Gutmann and Welker2007), hence abundance (less abundance) of winter precipitation compared to summer precipitation generates depletion (enrichment) of the total precipitation δ18O. The resulting spatial pattern of winter precipitation differences between the PNA positive (n = 17) and negative (n = 14) years for the period AD 1950–2005 (NOAA-20C reanalysis; Compo et al., Reference Compo, Whitaker, Sardeshmukh, Matsui, Allen, Allan and Yin2011) shows significant winter precipitation increase along the Pacific coast of North America, Mexico, and the far northern reaches of Canada and Alaska, while precipitation decreases are observed in the continental interior of North America (Fig. 5b). The winter precipitation decreases in the North America interior, and the increases in Central America, enhance the trend of enriched and depleted δ18O in winter precipitation of the two areas, respectively, during positive PNA patterns (Fig. 5). Therefore, the changes in winter precipitation δ18O and amounts responding to a positive PNA together generate the higher loading scores at Paradise, Lime, and Bison Lakes, and OCNM. In contrast, winter precipitation increases around the coastal Gulf of Alaska, and decreases in the Alaskan interior tend to cancel the enriched and depleted δ18O anomalies in winter precipitation of each area, which may explain the lower PCA loading scores associated with Takahula Lake, Jellybean Lake, and Mt. Logan. Together, these observations suggest δ18O changes represented by PC1 can be explained by PNA-like state changes, with positive PC1 values during the late Holocene corresponding to PNA positive state.
Regional-scale temperature changes may be an alternative explanation to generating the δ18O variabilities reflected in PC1, as was originally suggested for the Lime Lake and OCNM sites (Table 1, Ersek et al., Reference Ersek, Clark, Mix, Cheng and Edwards2012; Steinman et al., Reference Steinman, Pompeani, Abbott, Ortiz, Stansell, Finkenbinder, Mihindukulasooriya and Hillman2016). However, recently published temperature reconstructions using macrofossil communities in western North America (Harbert and Nixon, Reference Harbert and Nixon2018) and compiled pollen and other proxies in central North America (Shuman and Marsicek, Reference Shuman and Marsicek2016) do not support this possibility. According to Harbert and Nixon (Reference Harbert and Nixon2018), reconstructed temperatures at western North America show higher than present temperatures both in winter and summer throughout the mid- to late Holocene with millennial scale minimum between ca. 5–3 ka. This warming trend seems unlikely to explain the prominent δ18O changes observed during this period. Similarly, the temperature reconstructed by pollen and other proxies shows no prominent change between the mid- and late Holocene (Shuman and Marsicek, Reference Shuman and Marsicek2016).
Second Principal Component
In contrast to PC1, higher loading scores for PC2 are mainly observed along the northern Gulf of Alaska (Fig. 4d). The δ18O variability reflected in PC2 is observed from the lake records of both closed-basin (Takahula Lake) and open-basin (Jellybean Lake) systems, and from the Mt. Logan ice core record with extreme topography that exceeds an elevation of 5000 m. This variability of settings for these δ18O archives most closely associated with PC2 suggests that dynamic atmospheric circulation changes may be responsible for PC2 rather than local forcing.
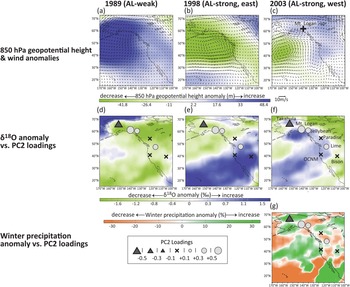
According to Berkelhammer et al. (Reference Berkelhammer, Stott, Yoshimura, Johnson and Sinha2012), a typical strengthened/westward-shifted AL (such as observed during the winter of AD 2003) generates increased moisture transport from δ18O enriched tropical oceans to western North America and coastal Alaska, along with cyclonic wind anomalies (Figs. 6c, 6f). Under this configuration, the most prominent δ18O enrichment is observed over the Pacific margin of North America rather than the western interior United States, due to the more westerly position of the AL (Fig. 6f). This spatial pattern of δ18O anomalies contrasts sharply with the patterns associated with strengthened and eastward-shifted AL conditions, or weakened AL conditions, as typically seen during the winters of AD 1998 and 1989, respectively (Figs. 6d–e). The location of records with high PC2 loading scores (the Mt. Logan, Jellybean Lake, and Lime Lake records) within this zone of enriched δ18O suggests they would be consistent with strengthened and westward-shifted AL regimes.
Comparison of PC2 spatial loading patterns and simulated precipitation δ18O anomalies during the winters (NDJFM) of AD 1989 (weak AL), AD 1998 (strong and east AL) and AD 2003 (strong and west AL) after Berkelhammer et al. (Reference Berkelhammer, Stott, Yoshimura, Johnson and Sinha2012), and AD 2003 winter precipitation anomalies. Average annual 850 hPa geopotential height (m) and wind vector anomalies (m/s) from NCEP II Reanalysis (Kanamitsu et al., Reference Kanamitsu, Kumar, Juang, Schemm, Wang, Yang and Hong2002) during AD 1989, 1998 and 2003 (a–c), the δ18O anomalies in winter precipitation from IsoGSM associated with these same years (Berkelhammer et al., Reference Berkelhammer, Stott, Yoshimura, Johnson and Sinha2012) (d–f) and winter precipitation anomalies of AD 2003 from NCEP II Reanalysis (g) plotted with the loadings of PC2.

The remaining δ18O records from inland Alaska and western North America are located in areas with either prominent δ18O enrichment (OCNM) or no substantial δ18O anomalies (Takahula Lake, Paradise Lake, and Bison Lake) (Fig. 6f). However, these sites may be consistent with the combination of winter precipitation changes associated with a strengthened and westward-shifted AL system (Figs. 6f–g). The NCEP II Reanalysis data for the AD 2003 pattern shows an extreme winter precipitation increase over Alaska, while winter precipitation anomalies elsewhere are relatively small and show a mosaic pattern around western and northern North America (Fig. 6g). These AL-driven large changes in winter precipitation for Alaska have also been reported from the long-term (AD 1951–2005) observation record of Clegg and Hu (Reference Clegg and Hu2010). The amount of winter (December–March) precipitation at the Bettles weather station near Takahula Lake shows ca. 70% increase in AD 2003 compared to the average winter precipitation for AD 1952–2020 (Western Regional Climate Center; https://wrcc.dri.edu/). Since winter precipitation at Takahula Lake is highly depleted δ18O (modeled value of -24‰) in contrast to the enriched δ18O (modeled value of -14‰) of summer precipitation (Clegg and Hu, Reference Clegg and Hu2010), this large increase in winter precipitation likely generates the δ18O depletion. Similarly, slight increase of winter precipitation around OCNM generates δ18O depletion, compensating the enriched δ18O in winter precipitation of this area. The remaining two stations of Paradise Lake and Bison Lake are located around the boundaries between the negative and positive anomalies for both amount of the winter precipitation and the δ18O (Figs. 6f–g), which likely explains their low PC2 loading scores.
An alternative explanation for PC2 is temperature change, as was originally interpreted for Lime Lake in the Pacific Northwest (Steinman et al., Reference Steinman, Pompeani, Abbott, Ortiz, Stansell, Finkenbinder, Mihindukulasooriya and Hillman2016). A quantitative temperature reconstruction study using the modern analogue technique for pollen from the northern Gulf of Alaska and the Alaskan interior (which contain δ18O records with high PC2 loading scores) shows slightly higher winter/annual temperatures during the mid-Holocene that gradually decrease to the present (Viau et al., Reference Viau, Gajeski, Sawada and Bunbury2008). For summer temperatures, this reconstruction shows almost constant values for both the mid- and late Holocene, as well as a lack of millennial-scale temperature changes (Viau et al., Reference Viau, Gajeski, Sawada and Bunbury2008). Other temperature records for this same area derived from midges, pollen, and biogeochemical indicators show gradual temperature decrease from mid-Holocene toward the present, with slight millennial-scale maxima around 3–2 ka and minima around 2–1 ka (Kaufman et al., Reference Kaufman, Axford, Henderson, McKay, Oswald, Saenger and Anderson2016). These studies thus cannot account for the higher δ18O anomalies seen around the Gulf of Alaska during 2–1 ka, which are described by a positive PC2 score (Fig. 4b).
In summary, PC1 and PC2 that were extracted by multivariate PCA statistical methods applied to these paleoclimate proxy δ18O records appear to reflect different states of AL changes and atmospheric modes. The former reflects negative to positive PNA-like state changes characterized by AL intensification from mid- to late Holocene, which is consistent with previous work by Liu et al. (Reference Liu, Yoshimura, Bowen, Buenning, Risi, Welker and Yuan2014). In contrast, PC2 reflects centennial to millennial-scale changes in AL intensity and longitudinal position. It should be noted that the temporal variation of PC2 shows close similarity to the stacked δ18O records from Mt. Logan ice, Jellybean and Mica Lakes, and Horse Trail Fen (Kaufman et al., Reference Kaufman, Axford, Henderson, McKay, Oswald, Saenger and Anderson2016), even though the latter two records were excluded from the PCA dataset due to lower time resolutions (Jones et al., Reference Jones, Wooller and Peteet2014; Schiff et al., Reference Schiff, Kaufman, Wolfe, Dodd and Sharp2009). Nevertheless, this similarity supports the idea that the δ18O variability reflected in PC2 is the typical δ18O feature of paleo-archives from the northern Gulf of Alaska because both the amount of winter precipitation and the regional δ18O values of this area seem to be sensitive to AL spatial changes.
The interpretations that δ18O changes represented by PC1 and PC2 reflect changes in winter precipitation amount and δ18O values are basically consistent with the original interpretations of these datasets (Table 1). The exception is the record from OCNM, where the investigators interpreted that temperature is the dominant factor controlling δ18O values, based on a significant correlation (r 2 = 0.65) between amount-weighted monthly precipitation δ18O values and monthly temperature at the location (Ersek et al., Reference Ersek, Mix and Clark2010, Reference Ersek, Clark, Mix, Cheng and Edwards2012). However, this high correlation between monthly averaged δ18O and temperature does not necessarily explain longer-timescale precipitation δ18O changes since it is based on three years observations. Hence it cannot easily be dismissed that winter precipitation amount and δ18O changes forced by paleoclimatic AL dynamic shifts have not played a significant role in the δ18O changes recorded at OCNM.
Comparison to other Aleutian Low records
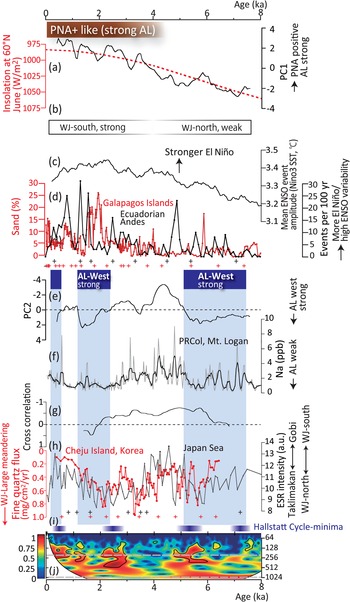
Comparing the δ18O PCA results with other records of past AL variability places these findings into a broader context. The sodium concentration record of the Mt. Logan ice core (Fig. 7f; Fisher et al., Reference Fisher, Osterberg, Dyke, Dahl-Jensen, Demuth, Zdanowicz and Bourgeois2008; Osterberg et al., Reference Osterberg, Mayewski, Fisher, Kreutz, Maasch, Sneed and Kelsey2014, Reference Osterberg, Winski, Kreutz, Wake, Ferris, Campbell, Introne, Handley and Birkel2017) shows poor resemblance to the temporal profile of PC1, but shows good agreement with PC2, where higher sodium concentrations correspond with lower PC2 values (Figs. 7a, 7e–f; note the Y-axis of Fig. 7e is reversed). However, the previously offered explanations for these two records are inconsistent. The positive PC2 record suggests a strengthened and westward-shifted AL, while low sodium concentration record suggests a weakened AL. This discrepancy could be attributed to the large influence that AL location has on sea salt transport to Mt. Logan. When the AL shifts westward, southerly winds intensify over the eastern North Pacific Ocean (Fig. 6c), and the region that is located between a zone of lower 850 hPa geopotential height anomaly in the west and a higher anomaly zone in the east also shifts westward (Berkelhammer et al., Reference Berkelhammer, Stott, Yoshimura, Johnson and Sinha2012). These movements result in a northerly wind anomaly over Mt. Logan (Fig. 6c) that might limit sea salt transport along coastal areas despite strengthened AL intensity. This potential influence of AL position change on sodium concentration in the Mt. Logan ice-core record may also explain the somewhat weak correlation (r = −0.45) observed between the sodium concentration and the December-March AL intensity record between AD 1990–1998 (Osterberg et al., Reference Osterberg, Mayewski, Fisher, Kreutz, Maasch, Sneed and Kelsey2014). Furthermore, Mt. Logan sodium concentrations show decadal-scale decreases during ca. AD 1930–1940 when an intensified AL was observed (Anderson et al., Reference Anderson, Berkelhammer, Barron, Steinman, Finney and Abbott2016). This discrepancy could also be attributed to a westward shift of the AL observed during the same period (Overland et al., Reference Overland, Adams and Bond1999).
Time comparisons of proxy records of the Aleutian Low, the Westerly Jet, and El Niño–Southern Oscillation; (a) PC1 of δ18O records (black line) and insolation at 60°N in June (red dotted line); (b) schematic orbital-scale trend of the WJ based on Rea and Leinen (Reference Rea and Leinen1988), Nagashima et al. (Reference Nagashima, Tada, Matsui, Irino, Tani and Toyoda2007), and Chen et al. (Reference Chen, Chen, Huang, Chen, Huang, Jin and Jia2019); (c) simulated Nino3 mean temperature amplitude of El Niño events in overlapping 500 year windows (Clement et al., Reference Clement, Seager and Cane2000); (d) frequency of flood events at Laguna Pallcacocha in the Ecuadorian Andes (black line; Moy et al., Reference Moy, Seltzer, Rodbell and Anderson2002) and sand grain abundance at El Junco Crater Lake, Galapagos Islands (red line; Conroy et al., Reference Conroy, Overpeck, Cole, Shanahan and Steinitz-Kannan2008); (e) PC2 of δ18O records; (f) Na concentration from Mt. Logan ice core (gray line: raw data, black line: 5-pt moving average; Fisher et al., Reference Fisher, Osterberg, Dyke, Dahl-Jensen, Demuth, Zdanowicz and Bourgeois2008); (g) cross-correlation between PC1 and 5-pt moving average of Mt. Logan Na using a 2000-yr moving window; (h) Electron spin resonance (ESR) signal intensity of quartz in core D-GC-6 from the Japan Sea (black line; Nagashima et al., Reference Nagashima, Tada and Toyoda2013) and fine quartz flux deposited at Cheju Island, Korea (red line; Lim and Matsumoto, Reference Lim and Matsumoto2006, Reference Lim and Matsumoto2008); (i) solar minima of the Halstatt cycle (blue horizontal bars; Vasiliev and Dergechev, Reference Vasiliev and Dergachev2002); and (j) wavelet of total solar irradiance (Steinhilber et al., Reference Steinhilber, Abreu, Beer, Brunner, Christl, Fischer and Heikkilä2012). Age control points for selected records shown at the bottom of Figures 7d and 7h (cross marks).

A 2000-year moving window cross-correlation calculated between the Mt. Logan sodium record and PC2 shows that the correlation between these datasets is negative between ca. 6–2 ka and positive after 2 ka (Fig. 7g; note the Y-axis is reversed)). Between 2–1.1 ka and after ca. 0.5 ka, PC2 increases with the increase of sodium concentrations at Mt. Logan, and both trends are inversed during 1.1–0.5 ka. The increase in PC2 and increase in sodium concentration at 2–1.1 ka and after 0.5 ka is consistent with the previous suggestion of a strengthened AL with a westward shifted center. During these periods, the extent of the AL westward shift may be small enough so as to not limit sea salt transport to Mt. Logan by the northerly wind anomaly pattern. This comparison between the δ18O PC2 composite and the Mt. Logan sodium record highlights the difficulties of estimating both intensity and position change of the AL using single station paleoclimate records.
The late Holocene negative PC2 scores and lower sodium concentrations at Mt. Logan (Osterberg et al., Reference Osterberg, Mayewski, Fisher, Kreutz, Maasch, Sneed and Kelsey2014) consistently suggest weaker AL at ca. 1.2–0.6 ka (1.1–0.7 ka at Mt. Logan), an interval broadly consistent with the Medieval Warm Period. A weakening of the AL during the Medieval Warm Period is consistent with a reconstruction of the Pacific Decadal Oscillation (PDO) index, where a negative PDO shift is interpreted from hydrologically sensitive tree-ring records in southern California and western Canada (MacDonald and Case, Reference MacDonald and Case2005). At the same time, greater aridity across the western United States is seen in a compilation of drought sensitive tree-ring records (Cook et al., Reference Cook, Woodhouse, Eakin, Meko and Stahle2004), and while there are complex reasons to explain this aridity, a weakening of the AL may have contributed decreased moisture transport to the western United States.
Causes of Aleutian Low intensification from the mid-to late Holocene
Modern instrument observations show that the AL is sensitive to the dynamics of the upstream WJ over East Asia and the North Pacific Ocean (e.g., White and Barnett, Reference White and Barnett1972; Lau, Reference Lau1988; Dole and Black, Reference Dole and Black1990; Nakamura et al., Reference Nakamura, Izumi and Sampe2002; Yang et al., Reference Yang, Lau and Kim2002; Athanasiadis et al., Reference Athanasiadis, Wallace and Wettstein2010; Park and An, Reference Park and An2014). Furthermore, a positive PNA mode is thought to follow intensified WJ conditions (Athanasiadis et al., Reference Athanasiadis, Wallace and Wettstein2010) due to enhanced wave activity along the WJ path over East Asia which becomes the trigger for PNA development (e.g., Mori and Watanabe, Reference Mori and Watanabe2008). Hence, WJ behavior is linked closely to the state of the AL and its relationship with larger-scale atmospheric circulation modes.
Past WJ variations over East Asia have been reconstructed using Asian dust deposition flux, grain size, and provenance from terrestrial and lake sediments in China, Korea, and Japan (e.g., Ono et al., Reference Ono, Naruse, Ikeya, Kohno and Toyoda1998; Sun, Reference Sun2004; Lim and Matsumoto, Reference Lim and Matsumoto2006, Reference Lim and Matsumoto2008; Han et al., Reference Han, Lü, Appel, Berger, Madsen, Vandenberghe and Yu2019), and marine sediments from the Japan Sea and northwestern Pacific Ocean (e.g., Janecek and Rea, Reference Janecek and Rea1985; Rea and Leinen, Reference Rea and Leinen1988; Nagashima et al., Reference Nagashima, Tada, Matsui, Irino, Tani and Toyoda2007, Reference Nagashima, Tada, Tani, Sun, Isozaki, Toyoda and Hasegawa2011, Reference Nagashima, Tada and Toyoda2013). Rea and Leinen (Reference Rea and Leinen1988) reconstructed latitudinal changes of dust grain size using sediments from the northwestern Pacific Ocean (Fig. 1), and demonstrated a southerly shift of the northern margin of the WJ. Similar results were revealed by latitudinal changes of the grain size and deposition flux of Asian dust within Japan Sea sediments (Nagashima et al., Reference Nagashima, Tada, Matsui, Irino, Tani and Toyoda2007), where it was demonstrated that the WJ winter and spring paths shifts southward due to reduced summer insolation at 30°N, corresponding to the situation of the late Holocene. The history of WJ behavior has also been derived from aridity reconstructions of Central Asia, where the moisture is supplied by the WJ (inferred as westerlies in the original reference; e.g., Chen et al., Reference Chen, Chen, Huang, Chen, Huang, Jin and Jia2019). According to Chen et al. (Reference Chen, Chen, Huang, Chen, Huang, Jin and Jia2019), a Holocene compilation of aridity records from Central Asia show wetter conditions during the late Holocene, which they interpret to reflect strengthened westerlies.
In summary, these reconstructions of the past WJ suggest a southward shift of the WJ path with probable intensification of wind speeds during the mid- to late Holocene, following the insolation decrease in summer and/or increase in winter (Fig. 7b). One of the proposed explanations for these orbital-scale WJ changes is that larger meridional temperature gradients exist due to stronger winter insolation during the late Holocene, which in turn generates a strengthened WJ over Central and East Asia (Chen et al., Reference Chen, Chen, Huang, Chen, Huang, Jin and Jia2019). Reduced summer insolation during this same period probably attributes to the southern position of the WJ path, which would be analogues to the present seasonality of the WJ path that is characterized by a northward entrainment from winter to summer with the intensification of solar irradiation. These trends of WJ intensification along a southward path across the northwestern Pacific Ocean is characteristic of positive PNA conditions (Athanasiadis et al., Reference Athanasiadis, Wallace and Wettstein2010). These observations suggest that orbitally-driven WJ intensification and southward shift generate positive PNA-like (strong AL) state changes that are reflected in PC1 during the late Holocene (Figs. 7a–b).
Alternatively, the El Niño–Southern Oscillation (ENSO) is considered one of the most important factors driving North Pacific climate through its modulation of the PNA teleconnection pattern, which is sensitive to equatorial sea surface temperature (SST) anomalies (e.g., Horel and Wallace, Reference Horel and Wallace1981). The PNA tends to be positive (strong AL) during El Niño events due to higher SST in the tropical eastern Pacific (Renwick and Wallace, Reference Renwick and Wallace1996). This can produce enhanced Rossby wave propagation from the tropical Pacific, directly exciting the PNA pattern (Horel and Wallace, Reference Horel and Wallace1981). Therefore, ENSO-like state changes have a high potential to generate AL variations between the middle and the late Holocene. This effect has been demonstrated by comparisons of δ18O records from western North America and paleo-ENSO proxies (Barron and Anderson, Reference Barron and Anderson2011). To examine the possible effect of ENSO on our PCA composite of AL change, two ENSO proxy records (Moy et al., Reference Moy, Seltzer, Rodbell and Anderson2002; Conroy et al., Reference Conroy, Overpeck, Cole, Shanahan and Steinitz-Kannan2008) and model simulations (Clement et al., Reference Clement, Seager and Cane2000) were used for comparison. A sediment core from Laguna Pallcachocha in the Ecuadorian Andes contains a record of flood frequency preserved as hundreds of light-colored, inorganic clastic laminae, which generally correlate with known strong El Niño events in instrumental and historical records over the past 200 years (Moy et al., Reference Moy, Seltzer, Rodbell and Anderson2002). A complementary record of past ENSO variability has been interpreted from the grain size record of a sediment core derived from El Junco Crater Lake in the Galapagos Islands which shows several abrupt changes in lake level and precipitation during the Holocene (Conroy et al., Reference Conroy, Overpeck, Cole, Shanahan and Steinitz-Kannan2008). Hydroclimatic model simulations suggest that the El Junco Lake level is sensitive to increases in precipitation associated with El Niño events, rising during wet El Niño events and falling during dry La Niña events (Conroy et al., Reference Conroy, Overpeck, Cole, Shanahan and Steinitz-Kannan2008). The two records (Fig. 7d) show asynchronous centennial-scale peaks due to age uncertainty, but both show increases of ENSO variability with a greater abundance of El Niño-like conditions during the late Holocene. These trends are further supported by a numerical model of the tropical Pacific Ocean that includes orbital forcing that shows higher frequency and/or intensification of El Niño-like conditions as the Holocene progresses (Fig. 7c; Clement et al., Reference Clement, Seager and Cane2000). According to Cane (Reference Cane2005), the weaker ENSO events during the early and middle Holocene were likely caused by stronger summer insolation, which helps to maintain a more northerly position of the Intertropical Convergence Zone. This is a barrier that prevents SST and wind conditions that favor the development of ENSO anomalies known as the Bjerknes feedback (Bjerknes, Reference Bjerknes1969). Inversely, the stronger ENSO events during the late Holocene were caused by weaker summer insolation or precessional-driven winter insolation increase in the tropic.
Based on this idea, ENSO intensification and frequent El Niño events during the late Holocene may also explain the PC1 change suggesting positive PNA-like state during the late Holocene. Consequently, either or both orbitally-driven changes in the WJ and ENSO generate preferential conditions for positive PNA modes and accompanied AL intensification during the mid- to late Holocene.
Causes of multi-centennial to millennial-scale Aleutian Low variability
Links with the Westerly Jet and ENSO
PC2 suggests AL intensifications and westward shifts during three time intervals: 7.5–5.1, 2.4–1.2, and 0.7–0.4 ka (Fig. 7e). These occurrences highlight the importance of identifying possible triggering mechanisms. The different spatial loading patterns observed between PC1 and PC2 (Figs. 4c–d) suggest that different mechanisms likely drive these two different modes of AL variability. The multi-centennial to millennial-scale AL variations in PC2 shows close synchronicity with WJ variations reconstructed from high-resolution Asian dust proxy records from the Japan Sea and Cheju Island, Korea (Lim and Matsumoto, Reference Lim and Matsumoto2006, Reference Lim and Matsumoto2008; Nagashima et al., Reference Nagashima, Tada and Toyoda2013). An Asian dust provenance study that used sediment from the Japan Sea was used to reconstruct the WJ path over East Asia (Nagashima et al., Reference Nagashima, Tada, Tani, Sun, Isozaki, Toyoda and Hasegawa2011, Reference Nagashima, Tada and Toyoda2013). Based on their interpretation, a predominance of dust from the Taklimakan Desert (Gobi Desert in southern Mongolia) represents the early (late) seasonal northward progression of the WJ path to the north of the Tibetan Plateau. This interpretation is based on the observation that dust emitted from the Gobi Desert is transported by near-surface northwesterly winds, while dust from the Taklimakan Desert is transported eastward by the WJ when it is shifted to the north of the Tibetan Plateau (Sun et al., Reference Sun, Zhang and Liu2001). Nagashima et al. (Reference Nagashima, Tada and Toyoda2013) identified a dominance of Asian dust from the Taklimakan Desert during ca. 7–5, 3.5–1.5, and after 0.4 ka (Fig. 7h) using Japan Sea sediment. These intervals overlap with those periods of multi-centennial to millennial-scale strengthened and westward shifts of the AL as interpreted above from PC2. The exception is the period around 0.5 ka, when Asian dust from the Gobi Desert dominates during a period with a strengthened and westward shifted AL, which is probably due to the age uncertainty of the Japan Sea sediment as there is no age constraint after 0.8 ka (Nagashima et al., Reference Nagashima, Tada and Toyoda2013).
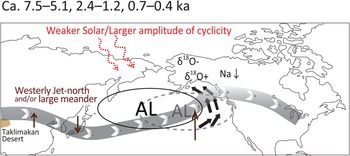
The flux and median diameter of fine fraction quartz deposited in a maar on Cheju Island since 6.5 ka have been used as indicators of WJ path changes (Lim and Matsumoto, Reference Lim and Matsumoto2006, Reference Lim and Matsumoto2008). The fine quartz fraction, which is composed of clay to fine-silt sized grains, is considered aeolian dust transported from the Taklimakan Desert by westerly winds (Lim and Matsumoto, Reference Lim and Matsumoto2006, Reference Lim and Matsumoto2008). The fine fraction quartz flux record deposited on Cheju Island exhibits similarities with the dust provenance study from the Japan Sea, as time intervals with higher dust flux correlates with periods of Taklimakan Desert-sourced dust over the Japan Sea (Fig. 7h; Lim and Matsumoto, Reference Lim and Matsumoto2008). These authors also showed that the grain size of this fine quartz fraction increases with higher flux rates, which suggests a longer duration and/or higher frequency of the WJ passing over both the Taklimakan Desert and Cheju Island. Both of these studies imply a predominant location for the WJ to the north of the Tibetan Plateau, with efficient dust transport to the Japan Sea and Cheju Island probably due to its larger meandering path (Lim and Matsumoto, Reference Lim and Matsumoto2008). This path is composed of a deeper northward ridge over the East Asia deserts and a deeper southward trough over the Japan Sea and Cheju Island, which frequently occur with a strengthened and westward shifted AL (Fig. 8).
A schematic illustration of the Aleutian Low and the Westerly Jet behavior during Holocene intervals of PC2 maxima: 7.5–5.1, 2.4–1.2, and 0.7–0.4 ka. Corresponding changes in precipitation δ18O and ice-core sodium concentration in North America are also depicted.

The co-occurrence of northward shifts and/or large meanderings of the WJ with strengthened and westward shifted AL dynamics is similar to the typical atmospheric circulation pattern of the North Pacific sector that has been extracted statistically from the modern climate data (Athanasiadis et al., Reference Athanasiadis, Wallace and Wettstein2010). These authors used an EOF analysis of the zonal wind field at 250 hPa over the Pacific sector (120°E–105°W, 0°N–90°N) using the European Centre for Medium-Range Weather Forecast reanalysis during AD 1957–2002 to examine the relation between the WJ and North Pacific storm tracks. The negative polarity of EOF 2 is characterized by (i) a minor intensification of the WJ along its higher latitude margin over East Asia, and (ii) a large intensification over the eastern North Pacific Ocean along the northern branch of the WJ around 45°N (Athanasiadis et al., Reference Athanasiadis, Wallace and Wettstein2010), which is also known as an eddy-driven jet or a polar front jet. Abnormally strong storm tracks are embedded in the eddy-driven jet over the North Pacific (which is indicated by the negative polarity of EOF 2), which generate strengthened and northwestward-shifted AL. This pattern is distinct from the configuration associated with EOF 1, which is interpreted to show the WJ pattern associated with the PNA (Athanasiadis et al., Reference Athanasiadis, Wallace and Wettstein2010). The multi-centennial to millennial-scale WJ changes reconstructed from Asian dust provenance studies (Lim and Matsumoto, Reference Lim and Matsumoto2006, Reference Lim and Matsumoto2008; Nagashima et al., Reference Nagashima, Tada and Toyoda2013) seem to be closely linked to the AL changes represented by PC2, which is distinctly different from the WJ-AL relationship reflected by PC1.
The influence of ENSO on the AL behavior reflected in PC2 is difficult to evaluate because the two ENSO proxy records show asynchronous peaks at multi-centennial to millennial scales (Fig. 7d; Moy et al., Reference Moy, Seltzer, Rodbell and Anderson2002; Conroy et al., Reference Conroy, Overpeck, Cole, Shanahan and Steinitz-Kannan2008). However, the impact seems to be small or limited since neither of the ENSO proxy records show synchronicity with PC2 (Figs. 7d–e).
A role for solar forcing?
Meteorological records and reanalysis datasets have shown a sensitive response of WJ dynamics to the 11-year solar sunspot cycle (e.g., Arai, Reference Arai1958; Labitzke, Reference Labitzke1987; Kodera, Reference Kodera1995; Kodera and Kuroda, Reference Kodera and Kuroda2002). For longer timescales, spectral and wavelet analyses of paleoclimate proxy records representing WJ and AL behavior, such as flux of fine fraction quartz of lake sediment from Cheju Island (Lim and Matsumoto, Reference Lim and Matsumoto2008) and sodium concentration record of the Mt. Logan ice core (Osterberg et al., Reference Osterberg, Mayewski, Fisher, Kreutz, Maasch, Sneed and Kelsey2014), show cyclicity similar to the known solar activity cycles from multi-decadal to millennial timescales.
The dynamic mechanisms connecting solar activity and lower atmospheric circulation including WJ variability have been demonstrated by numerous studies (e.g., Haigh, Reference Haigh1996; Shindell et al., Reference Shindell, Schmidt, Mann, Rind and Waple2001, Reference Shindell, Schmidt, Miller and Mann2003; Kodera and Kuroda, Reference Kodera and Kuroda2002; Meehl et al., Reference Meehl, Arblaster, Matthes, Sassi and van Loon2009; Gray et al., Reference Gray, Beer, Geller, Haigh, lockwood, Matthes and Cubasch2010; Ineson et al., Reference Ineson, Scaife, Knight, Manners, Dunstone, Gray and Haigh2011). One of these processes, the “top-down” mechanism, describes the response of stratospheric ozone to the ultraviolet (UV) radiation of the solar spectrum (Meehl et al., Reference Meehl, Arblaster, Matthes, Sassi and van Loon2009; Gray et al., Reference Gray, Beer, Geller, Haigh, lockwood, Matthes and Cubasch2010). The small percentage of UV variation in the 11-year solar cycle generates changes in stratospheric circulation patterns (Frame and Gray, Reference Frame and Gray2010; and references therein). These stratosphere changes then propagate downward into the tropospheric circulation, such as Hadley cell expansion/contraction (e.g., Gleisner and Thejll, Reference Gleisner and Thejll2003; Haigh Reference Haigh2003; Haigh et al., Reference Haigh, Blackburn and Day2005) and WJ variability (Shindell et al., Reference Shindell, Schmidt, Mann, Rind and Waple2001, Reference Shindell, Schmidt, Miller and Mann2003). This linkage between solar activity and the WJ suggests that solar forcing is a plausible mechanism forcing the multi-centennial to millennial-scale atmospheric circulation changes related to the WJ and the AL.
Solar activity during the Holocene has been reconstructed by analyses of cosmic-ray produced radionuclides (14C in tree rings and 10Be in polar ice) using physics-based models (e.g., Solanki et al., Reference Solanki, Usoskin, Kromer, Schüssler and Beer2004; Usoskin et al., Reference Usoskin, Gallet, Lopes, Kovaltsov and Hulot2016; Steinhilber et al., Reference Steinhilber, Abreu, Beer, Brunner, Christl, Fischer and Heikkilä2012). The periods of AL intensification and westward shifts inferred from the PC2 positive scores, taken together with the WJ northward shift and/or larger meandering path, appear to correlate with periods of solar minima associated with the Hallstatt cycle (2000–2400-year cyclicity, Fig. 7i; Vasiliev and Dergachev, Reference Vasiliev and Dergachev2002). Amplitudes of decadal to multi-centennial scale solar cycles have been shown to be modulated by the Hallstatt cycle, particularly with the largest amplitude events of the 210-year de Vries cycle (Figs. 7i–j; Eddy, Reference Eddy1997; Stuiver et al., Reference Stuiver, Braziunas, Becker and Kromer1991; Usoskin et al., Reference Usoskin, Gallet, Lopes, Kovaltsov and Hulot2016) occurring during Hallstatt cycle minima centered at approximately 7.2, 5.5, 2.5, and 0.5 ka (Fig. 7i; Vasiliev and Dergachev, Reference Vasiliev and Dergachev2002; Knudsen et al., Reference Knudsen, Riisager, Jacobsen, Muscheler, Snowball and Seidenkrantz2009; Steinhilber et al., Reference Steinhilber, Abreu, Beer, Brunner, Christl, Fischer and Heikkilä2012; Usoskin et al., Reference Usoskin, Gallet, Lopes, Kovaltsov and Hulot2016; Usoskin, Reference Usoskin2017). The periods of PC2 minima and related WJ anomalies overlap either or both the Hallstatt solar minima (Fig. 7i) and amplified de Vries cycle (Fig. 7j). This possible linkage between solar activity and the dynamic WJ-AL system is also supported by the 2000-year periodicity of PC2 (p < 0.01), extracted by a Lomb periodogram (Supplementary Figure 3). Hence it cannot be dismissed that external solar forcing can impact AL dynamics through changes of the WJ path over East Asia and the North Pacific Ocean. However, there is an inconsistency between the Hallstatt solar minima centered at 2.5 ka and a positive PC2 peak at the same time period, which highlights the need for additional new high-resolution and precisely dated WJ and AL paleoclimate records to further evaluate causal relationship between solar activity and linked WJ and AL variability.
CONCLUSIONS
Holocene variability of the AL and external forcing mechanism(s) were examined with a special focus on its relationship to the WJ. AL variability since 7.5 ka was reconstructed with multivariate PCA methods using seven previously published δ18O records from sedimentary calcite, ice, and speleothems from Alaska, northwestern Canada, and the western United States. The extracted PC1 is characterized by a continuous increasing trend from the mid- to late Holocene, which appears to reflect intensified AL associated with a multi-millennial-scale shift in the PNA teleconnection pattern from a negative to positive-like state change. This interpretation is based on the comparison between the spatial distributions of individual δ18O records, their respective PC1 loading scores, and the spatial patterns of both winter precipitation anomalies and simulated winter precipitation δ18O anomalies associated with a positive PNA. This PNA-like change represented with PC1 seems likely related with either (or both): (i) orbitally-driven southward shift and intensification of the WJ; and/or (ii) ENSO intensification. This result also suggests that the modern AL system was established during the late Holocene.
The extracted PC2 shows dominance of multi-centennial to millennial-scale oscillations. The spatial loading pattern of PC2 and its comparison to winter precipitation amount and simulated winter precipitation δ18O anomalies under different AL modes of variability suggests that PC2 reflects AL intensification with a westward shift during three periods since the mid-Holocene: 7.5–5.1, 2.4–1.2 and 0.7–0.4 ka. The timings of these AL anomalies are remarkably similar to periods when the WJ follows a more northerly route and/or large meander pathways over East Asia and the North Pacific Ocean. The paleoclimate records of these phenomena also show a similarity to the millennial-scale record of Hallstatt solar activity minima and the enhanced de Vries 210-year solar cyclicity. Together, these lines of evidence suggest changes in solar activity and/or the strength of cyclicity are associated with AL dynamics through interactions with the WJ path. The close linkage of the AL with the position of the WJ and its meandering pathways over East Asia and western North America suggest that the pacing of AL variability follows the rhythm of large-scale atmospheric circulation changes over the North Pacific Ocean and surrounding continents. These findings are critically important for understanding natural climate variability during the Holocene.
ACKNOWLEDGMENTS
We thank Hitoshi Hasegawa, John Barron, and Jay Alder for providing useful input on early versions of this manuscript, as well as reviews by Daniel Mann, Thomas Cronin, and several anonymous reviewers. This research was supported by grants to Kana Nagashima (18H03370) from the Japan Society for the Promotion of Science. Support for Jason Addison was provided by the USGS Climate Research and Development Program. Any use of trade, firm, or product names is for descriptive purposes only and does not imply endorsement by the U.S. Government.
SUPPLEMENTARY MATERIAL
The supplementary material for this article can be found at https://doi.org/10.1017/qua.2020.116