A growing body of literature finds evidence of “colorism” around the world (Dixon and Telles Reference Dixon and Telles2017). This concept is closely related to racism but focuses on the effects of skin color on outcomes—effects that may extend beyond those associated with racial or ethnic self-identification (Glenn Reference Glenn2009). Studies find that skin tone can affect wages (Goldsmith, Hamilton, and Darity Reference Goldsmith, Hamilton and Darity2006), educational attainment, perceived attractiveness (Hersch Reference Hersch2006), and health outcomes (Monk Reference Monk2015). Scholars have suggested that such social inequalities based on skin color have the potential to be catastrophic for a democratic political system (e.g., Houle Reference Houle2015). However, little is known about the political consequences of social differences tied to skin pigmentation. Does inequality tied to skin tone translate into dissatisfaction with the political system that allows these inequalities to persist?
We use recent Latin American Public Opinion Project (LAPOP) surveys to answer two questions about the relationship between skin pigmentation and political life in Latin America. That survey project has included the Project on Ethnicity and Race in Latin America (PERLA) Color Palette on most surveys conducted since 2010. The item asks the interviewer to record the skin tone of the respondent by referring to a carefully designed, numbered color palette. We leverage this extensive pool of datasets to improve our understanding of the social and political consequences of skin pigmentation in Latin America.
We begin by documenting the clear pattern across countries in this region where those with darker skin attain systematically lower levels of education and wealth. These relationships hold after controlling for other demographic characteristics—including, notably, self-reported race. The negative relationship between the darkness of skin tone and socio-economic standing is strong and emerges in the analysis pooling across countries as well as in each of the 18 individual countries we consider.
We then consider the political implications of these fundamental social inequalities. Do the deleterious social consequences of skin pigmentation lead to decreased satisfaction with the way the political system operates? We examine the relationship between pigmentation and three attitudes about the political system: (1) satisfaction with the state of democracy in the respondent's country, (2) external political efficacy, and (3) respect for political institutions. Surprisingly, our pooled analysis suggests that, if anything, darker pigmentation is associated with more positive assessments of the political system.
When we disaggregate by country, we find a negative relationship between pigmentation and these political views in some countries, but positive relationships in others. The positive and negative relationships fail to conform to any obvious a priori expectations regarding why the effects of pigmentation should vary across countries. Instead, the distributions of estimates we find across samples look very much like what we would expect to find by chance if no real relationships existed.
In short, although our evidence corroborates existing work in finding a robust, substantial, and negative relationship between the darkness of skin color and socio-economic standing in Latin America, these inequalities do not tidily translate into political dissatisfaction as we might expect. We consider several explanations for the unexpected pattern of relationships that emerge across surveys including heterogeneity tied to individuals' economic status and racial self-identification, as well as variation tied to the skin pigmentation of countries' political leadership. However, we find little evidence that these factors explain our top-level findings. Thus, we leave it to future researchers to solve the puzzle we document here. We emphasize that our evidence regarding the relationships between skin pigmentation and political outcomes suggests that research on this front must treat this question comprehensively—studies that focus on relationships found in a single survey in a single country may be susceptible to false positives (e.g., Franco, Malhotra, and Simonovits Reference Franco, Malhotra and Simonovits2014).
Skin Tone in Latin America
Owing to the European conquest and the slave trade, Latin American countries exhibit tremendous racial diversity. The conquistadores dominated and decimated the indigenous population, taking territory and assuming political control. Later, the establishment of plantation economies and the Atlantic slave trade added another layer of racial domination and exploitation. In the resulting societies, peninsulares Footnote 1 and their descendants, criollos, occupied the upper strata, while indigenous peoples, those of African descent, and those of mixed race (either mulattoes or mestizos) were relegated to the bottom of the social pyramid (Appelbaum, Macpherson, and Rosemblatt Reference Appelbaum, Macpherson and Rosemblatt2003). This racial inequality persisted well into the 20th century, leading one scholar to label the countries of the region as pigmentocracies, where skin color determined social status and power (Lipschütz Reference Lipschütz1975).
Most of the countries in Latin America now have almost 40 years of democratic experience. Although some scholars posited that democracy would reduce race-based inequalities more in Latin America than in countries like the United States (e.g., Freyre Reference Freyre1951), recent work finds that discrimination and racism persist in the region (Hernández Reference Hernández2012; Joseph Reference Joseph2013; Peña, Sidanius, and Sawyer Reference Peña, Sidanius and Sawyer2004). These racial divisions continue in countries where large numbers of indigenous peoples live, such as Peru (Cadena Reference Cadena1998; Cervone Reference Cervone2012) and Guatemala (Grandin Reference Grandin2000), as well as countries with large numbers of people of African descent, such as Brazil (Telles Reference Telles2004) and the Dominican Republic (Simmons Reference Simmons2009). Divisions also persist in countries where most citizens are of European descent, like Argentina and Uruguay (Gordillo and Hirsch Reference Gordillo and Hirsch2003), and in countries like Nicaragua (Lancaster Reference Lancaster1991) and Mexico (Villareal Reference Villareal2010) where the populations are principally mestizo. Racial inequalities even endure in Cuba, which experienced a social revolution that sought to eliminate discrimination and inequality (Clealand Reference Clealand2013; Sanchez and Adams Reference Sanchez and Adams2008).
To date, most studies examining the relationships between race and discriminatory outcomes have relied on surveys where respondents self-report their race. One limitation of this type of categorical measure is that two individuals with very different skin pigmentation might self-categorize in the same way—a reflection of the fact that race is a social construct. In other words, self-reported racial identities may be the product of psychological and social processes independent of outward appearances that affect how people perceive their own identity. For example, some people may identify themselves as members of a particular racial group because, for example, they prefer to think of themselves as members of the majority group (Ahmed, Feliciano, and Emigh Reference Ahmed, Feliciano and Emigh2007; Davis Reference Davis1991).
However, skin color appears to play a central role in determining how people racially categorize others (Feliciano Reference Feliciano2016).Footnote 2 To the extent that race-related forces affect how people are treated in society, how an individual is categorized by others is likely to be more consequential than how they classify themselves. This may be particularly true in the context of Latin America, where the lines between racial categories can be particularly blurry and “race” and “color” are often used interchangeably, as opposed to the United States where individuals with any amount of African ancestry are typically perceived as Black (Davis Reference Davis1991). Thus, in the analysis below, we rely on interviewer ratings of skin pigmentation as provided by LAPOP surveys.
This measurement approach is not devoid of bias (e.g., Feliciano Reference Feliciano2016; Flores and Telles Reference Flores and Telles2012), but, consistent with our claims above, existing work suggests it better captures variation across individuals' social experiences—including experiences with unequal treatment—than self-reported categorical measures (e.g., Bailey, Fialho, and Penner Reference Bailey, Fialho and Penner2016). For example, Telles found that “light-skinned people, regardless of their [racial and ethnic] identity, had higher levels of education and higher occupational status than their darker counterparts” in Brazil, Colombia, Mexico and Peru (Reference Telles2014, 226). Another study similarly found that skin color is closely related to material wealth in Mexico, with darker-skinned respondents having less wealth than those with lighter skin (Zizumbo-Colunga and Flores Martínez Reference Zizumbo-Colunga and Flores Martínez2017). Using the 2010 AmericasBarometer Brazil survey—one of the studies we use in our analysis below—Monk finds that skin color is a better predictor of outcomes including educational attainment and occupational status than “race (i.e., census categories) as it is commonly operationalized in virtually all existing research on ethnoracial inequality” (Reference Monk2016, 416). In other work, Maddox and Gray find that respondents in the United States associated “dark skin tone… with poverty, aggressiveness, lack of intelligence, lack of education, and unattractiveness” (Reference Maddox and Gray2002, 258). Put simply, the “colorism” suggested by relationships between skin pigmentation and social outcomes appears to be a “global phenomenon” (Dixon and Telles Reference Dixon and Telles2017, 418).
The Political Implications of Inequalities Tied to Skin Tone
Despite the growing body of evidence that skin tone is closely linked to patterns of discrimination and social inequality, we know surprisingly little about the political implications of this pattern. As Levitt noted in a recent article, “the domestic economic impacts of discrimination have received some attention from scholars, [but] the extant social science literature has less to say about domestic political consequences of discrimination” (Reference Levitt2015, 418). In that article, Levitt finds evidence that self-reported experiences with discrimination—particularly at the hands of government actors—are associated with distrust of government institutions. This suggests that inequalities tied to skin pigmentation may shape attitudes about the political system. In the analysis below, we address a critical, unanswered question: does the persistence of a pattern where those with lighter skin enjoy more favorable socio-economic status undermine support for the political system among those with darker skin?
Democratic theorists have argued that social inequalities, particularly those tied to racial and ethnic differences, are potentially dangerous for the survival of democratic systems (Dahl Reference Dahl1971). Tilly emphasizes that when categorical inequalities exist—e.g., race, caste, ethnicity—“democratization remains impossible” (Reference Tilly2009, 327). Lijphart argued that those who “…are continually denied access to power will feel excluded and discriminated and may lose their allegiance to the regime” (Reference Lijphart1999, 32, emphasis added). Aberbach and Walker, who examined political trust in Detroit, found that mistrust among Blacks stems from a variety of factors, including “… expectations of discriminatory treatment in contacts with government officials …and low evaluations either of one's present situation in life or one's personal future prospects” (Reference Aberbach and Walker1970, 64).
The result of intense and long-lasting lack of trust in the system, as Miller suggests when looking at lack of trust in the United States among African Americans in the late 1970s is “the potential for radical change,” because they “perceive the legitimate means of attaining such influence [to achieve desired policy changes] as ineffective” (Reference Miller1974, 970). Taken together, this research suggests that we should expect members of groups that experience unequal treatment or social status to have lower levels of faith in the political system and believe that the political system is unlikely to respond to their demands (i.e., report low levels of external political efficacy).
This said, Dahl notes that even when significant inequalities exist, democratic regimes can take steps that “do not reduce the objective inequalities but do reduce feelings of relative deprivation” (Reference Dahl1971, 104). Similarly, Tilly argues that if inequalities are insulated from public politics so that minority groups do not perceive their inferior lot in life as a direct consequence of the political system, then those inequalities will not undermine the system (Reference Tilly2007, 75). Consistent with this expectation, Shingles found that African Americans only lose trust when they blame their socio-economic condition on the system rather than on themselves (Reference Shingles1981). Some further argue that democratic values have become so ingrained among citizens that despite extant social problems, most people tend to report trust in and support for the system (Bermeo Reference Bermeo2003). Thus, there are a number of reasons why those with darker skin may not report systematically different attitudes about the political system, in spite of persistent “colorism.”
It is important to note that some scholars see racial politics in the United States as distinct from racial politics in Latin American countries. One prominent theory has suggested that “racial democracy” has existed in Latin America since the region's racial mixing created a post-racial society. The idea of racial democracy originated in the writings of Freyre (Reference Freyre1951). But the recent evidence of persistent ethno-racial inequality and discrimination in the region has challenged this theory, with much of the work centered on Brazil (Joseph Reference Joseph2013; Peña, Sidanius, and Sawyer Reference Peña, Sidanius and Sawyer2004). Despite extant discrimination, another potential reason that people of color in Latin America might demonstrate support for the political system is that recent evidence suggests those with darker skin are much more likely to be the targets of vote-buying (Johnson Reference Johnson2020), which may prompt them to feel some satisfaction with political parties.
Below we assess whether darker-skinned citizens in Latin America—who tend to be of lower socio-economic status—evaluate political institutions and the way democracy functions in their country less favorably than lighter-skinned individuals. We also assess whether they report lower levels of external political efficacy. Before proceeding, we note the important distinction between “diffuse” and “specific” support for a political system (Easton Reference Easton1965). Existing evidence suggests that while attitudes about specific policies, political leaders, and institutions (specific support) may be affected by an array of forces, transient mistrust tied to, say, economic conditions does not necessarily undermine diffuse support for democracy or the system as a whole (Citrin Reference Citrin1974).Footnote 3 The measures we use in our analysis capture respondents' assessments of how democracy is working in practice in their country—attitudes that we might expect to be more closely tied to socio-economic inequalities—rather than measures of support for democracy in the abstract which may be less sensitive to existing socio-economic inequalities.
Latin America is racially and ethnically diverse, the region's citizens of color have been marginalized for centuries, and skin color appears to still affect social status. Thus, if inequalities tied to skin pigmentation lead to less favorable evaluations of how the political system operates, we might expect it to be particularly likely to do so in this region. However, if darker-skinned citizens do not attribute their lower status to the political system, if they have internalized democratic norms to the point where they are reluctant to express unfavorable attitudes about the way democracy functions, or if attitudes about the political system are simply rooted in factors that are not related to socio-economic and racial inequalities (e.g., if they are primarily driven personality dispositions [Stenner Reference Stenner2005]), this pattern may not emerge.
Data Analysis: The Social and Political Effects of Skin Color
To assess the effects of skin pigmentation on social standing and political outcomes, we use data from the Latin American Popular Opinion Project (LAPOP), AmericasBarometer 2010, 2012, 2014, and 2016/2017 surveys.Footnote 4 We use the countries of Ibero-America (the Spanish speaking countries of the region and Brazil), and Haiti, which are the nations normally referred to as Latin America, from a cultural/language perspective.Footnote 5 Thus, the data we leverage includes 71 cross-sectional samples—four from each of these 18 countries, with the exception of Haiti where the 2010 survey did not include the skin pigmentation measure. To ensure comparability across models we restrict our sample to the 116,056 respondents with non-missing values on the pigmentation variable and the demographic measures we use as controls. The number of observations varies across outcomes as some outcomes were asked only of subsets of respondents in particular years or include missing values.
For each of the outcomes we consider, we begin by estimating models pooling across all countries and waves and then estimate models for each country separately (still pooling across years to maximize statistical power). In all models, we include fixed effects for survey wave (year). In the pooled models we account for the structure of our data—individual respondents nested within countries—by estimating multilevel models (Schmidt-Catran and Fairbrother Reference Schmidt-Catran and Fairbrother2016). We use sample weights provided with the data in all models to ensure that each country sample is representative of the national population. In the pooled models we use these sample weights in the individual-level stage and weight the country-level random-effects model by the average number of observations per country (across waves), divided by the number of observations in the given country. This step means that each country receives equal weight in our pooled model.Footnote 6 We present descriptive statistics for all variables used in our analysis in Table A1, in the Appendix.
In each of our models, the quantity of interest is the coefficient on the skin pigmentation item. For this item instructions to interviewers read: “Without asking, please use the Color Chart and indicate the number that is closest to the color of the skin of the face of the respondent.” The color chart presented a gradient of 11 colors ranging from 1 (lightest) to 11 (darkest). We present the color chart in Figure A1 of the Appendix. We rescale this item, as well as our outcome measures, to range from 0 to 1. Thus, the coefficient on this variable can be interpreted as the expected change in a 0–1 outcome associated with a change from lightest to darkest skin tone.
We begin by reexamining the relationship between skin pigmentation and social position using our expansive dataset. We consider two key measures of social status: educational attainment (years of schooling; 0–18) and wealth (a 10-item measure of material well-being), rescaling each to range from 0 to 1.Footnote 7 In Tables A2 and A3 of the Appendix we report the results of the regression model predicting each of these outcomes with the pigmentation measure. Because pigmentation is largely immutable, we only control for other immutable characteristics: gender, age, and age-squared (to account for potential non-linearity in the relationship between age and our outcomes). In Tables A4 and A5, we add controls for ethno-racial self-identification.Footnote 8 We present the findings of interest from all of these models—the coefficient on the pigmentation variable—graphically in Figure A2 of the Appendix.
The results confirm the robustness of existing work that has focused on a subset of the countries we consider here. Those with darker skin report lower levels of educational attainment and have fewer material possessions (wealth). These relationships are virtually unchanged when we control for racial and ethnic self-identification. In short, the darkness of skin tone is associated with lower social standing above and beyond the effects associated with ethnic self-identification. The magnitudes of these relationships are not trivial. The standard deviation of the pigmentation measure in our weighted full dataset is .18. Thus, even after controlling for ethnic self-identification, a two standard deviation increase in darkness of skin tone is associated with an expected change of −.074 units on education (or 1.33 fewer years of schooling) and about one fewer item on our 10-item wealth measure.
Tables A2-A5 and Figure A2 also report findings from similar models for each individual country. We find negative, statistically significant (p < .01) relationships between the darkness of skin tone and educational attainment in each of the 18 countries we consider, in both model specifications. We note that controlling for ethnic self-identification only modestly affects our estimates of the effect of skin pigmentation. Across the 36 models (18 controlling for ethnic self-identification, 18 without those controls), the coefficients on the pigmentation variable range from −.091 to −.499, with an average of −.233. Similarly, the negative relationship between pigmentation and wealth is significant (p < .01) across all countries, with coefficients ranging from −.054 to −.536, with an average coefficient of −.257. In short, darker skin pigmentation is tied to lower objective socio-economic standing in every country we consider—even after we account for self-reported racial identification.
The results of our analysis thus far corroborate previous research on some countries in the region which shows that darker skin pigmentation is associated with lower objective socio-economic status. Our evidence builds on that work by confirming that the patterns reported in published work are not products of cherry-picking countries where surveys show “significant” relationships. We also demonstrate that these adverse effects of pigmentation cannot be explained by racial and ethnic self-identification in any country in the region. More broadly, this pattern is consistent with existing work in the region and elsewhere that finds that skin tone, at least in some cases, better captures socially relevant experiences than categorical measures of ethno-racial self-identification.
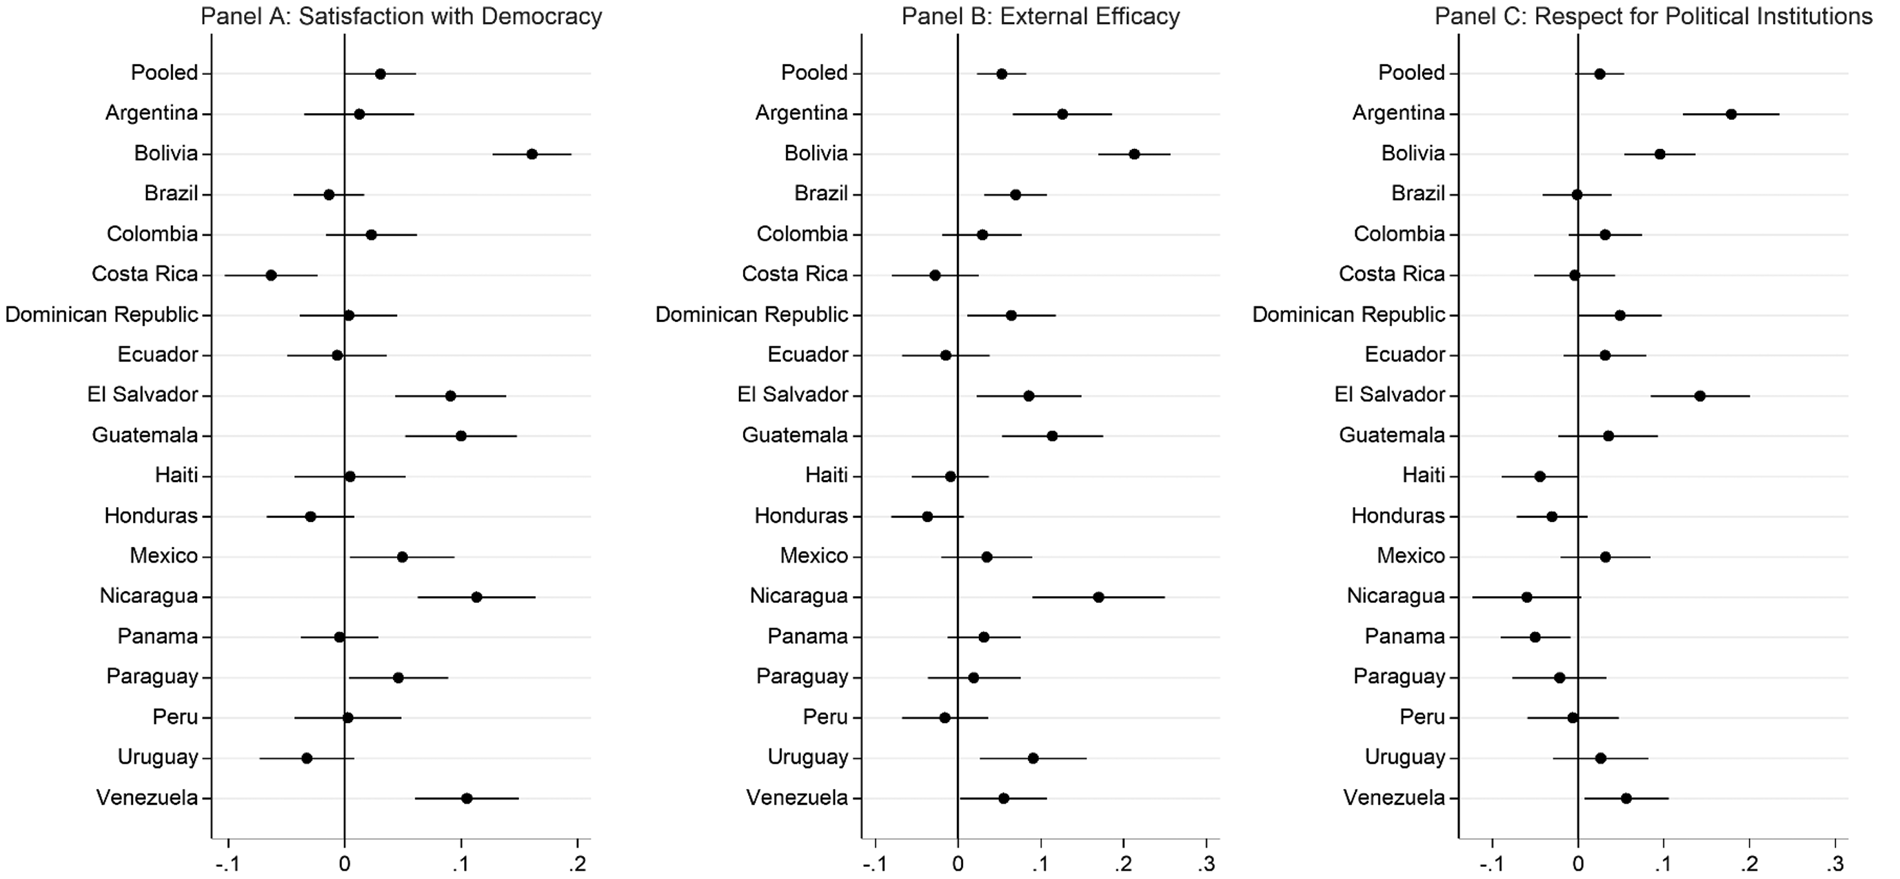
Next, we proceed to our core question regarding whether the nexus between pigmentation and unfavorable social outcomes extends to the political realm. Do those with a darker skin tone report lower levels of satisfaction with the political system? We assess whether a person's skin color is associated with three political attitudes: (1) reported satisfaction with democracy,Footnote 9 (2) external political efficacy,Footnote 10 and (3) reported respect for political institutions in the country.Footnote 11 We rescale each outcome to range from 0 to 1 and estimate models analogous to those used above. The full models (excluding controls for ethnic self-identification) are presented in Tables A6–A8 of the Appendix. We present the results from these models in Figure 1.
Pigmentation and political attitudes by country. Markers show predicted change in outcome for a change from the lowest (lightest) to highest (darkest) value on the skin pigmentation measure. Models control for gender, age, age-squared, and survey wave. Outcomes range from 0 to 1. Whiskers are 95% confidence intervals. See Appendix Tables A6–A8 for underlying models.

Surprisingly, the results offer virtually no support for the expectation that darker skin pigmentation is associated with negative outcomes in the political domain. In fact, pooling across countries, darker-skinned respondents tend to report slightly more positive attitudes toward their political system. Although the relationships they suggest are substantively small, the coefficients on the pigmentation measure show positive signs in the models predicting the three attitudinal outcomes and exceed conventional thresholds of statistical significance for two of our outcomes—satisfaction with democracy and external efficacy. These relationships persist (and are a bit larger) when we control for ethnic self-identification (see Tables A9-A11). The coefficient is also positive in the models predicting reported respect for political institutions in the respondent's country but falls short of conventional thresholds of statistical significance in each case (p = .080 without ethnic self-identification control, and .096 with; N = 112,980).
We note that, in contrast to the relationships between pigmentation and education and wealth, the relationships we find in Figure 1 are trivial in magnitude. Even allowing for the maximum possible difference in skin pigmentation (from lightest to darkest), the expected change in each outcome is no more than about one-twentieth of the range—and less than a third of a standard deviation—of the outcome variable. However, given the pronounced relationship between pigmentation and socio-economic outcomes, there was a clear reason to expect non-negligible negative coefficients. Rainey (Reference Rainey2014) posits that the lower bounds of 90% confidence intervals can be read as the most negative plausible population parameter given the data. The 90% confidence intervals around the estimates from our pooled models (see the top of Figure 1 where we report 95% confidence intervals) each have lower bounds that are positive. Thus, we can be quite confident that the population parameter is not negative, much less substantially so.
In short, the evidence from our pooled data presented in Figure 1 is inconsistent with the expectation that darker-skinned citizens in Latin America are systematically less supportive of the way their democratic institutions function. The remainder of Figure 1 presents coefficients from models estimated separately for each country for each of the outcome measures. The results yield scattered results that fail to conform to any a priori expectations regarding particular contexts where those with darker skin tone would feel more disconnected from or skeptical of political institutions. Despite at least 5,000 observations in each country, most of the relationships fall short of conventional thresholds of statistical significance. We find statistically significant, negative coefficients in some countries, but they are rare.
Of the 36 country models we estimated for the satisfaction with democracy outcome, only one coefficient (Costa Rica, not controlling for ethnic self-identification) is negative and statistically significant. None of the handful of negative coefficients in our external efficacy models is statistically significant. We find negative and statistically significant coefficients in Nicaragua (but only when we control for ethnic self-identification) and Panama in the models predicting respect for political institutions. However, darker pigmentation is associated with greater external efficacy in both countries (only when controlling for ethnic self-identification in Panama) and with greater satisfaction with democracy in Nicaragua. In short, the estimates we report in Panels A–C of Figure 1 and Appendix Tables A6–A11 do not appear to follow any discernable pattern.
A critical advantage of having data from many samples taken in various countries across time is that they allow us to assess whether the pattern of coefficients we find across samples diverges from what we would expect to find by chance if each of these samples was a random draw from a population where the true relationship between pigmentation and these outcomes is zero. If that were the case, the distribution of coefficients should be normally distributed and centered on zero. Put differently, that distribution would suggest a reason to suspect that the positive and negative “statistically significant” relationships we find are false positives—apparent effects that emerge by chance.
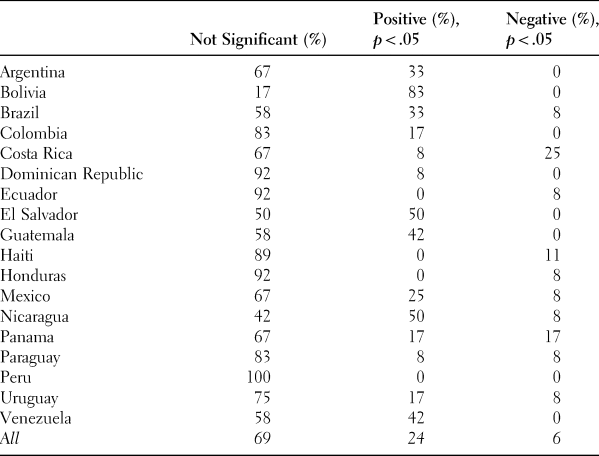
We estimated separate models for each of our 71 countries/years (the Haiti survey did not include a pigmentation measure in 2010). We regress each outcome on the pigmentation item and controls for age, age-squared, and gender.Footnote 12 For each outcome, the median coefficient is close to zero (satisfaction with democracy = .034; efficacy = .054; respect for political institutions = .022). Additionally, for each of these distributions of coefficient estimates, we conducted a Shapiro-Wilk test and fail to reject the null of normality in each case. We summarize the share of these 213 relationships that met the p < .05 threshold in Table 1.
Summary of Relationships

Note: Cell entries are percentages of coefficients on the pigmentation measure with p-values less than .05. Coefficients are from models estimated separately for each country/year and each outcome.
Overall, 69% of our estimates of the effect of pigmentation fails to reach the p < .05 threshold. Contrary to our expectations, 24% of our estimates of the effects of pigmentation yield positive coefficients that meet this threshold, compared with only 6% that shows negative coefficients that meet the .05 threshold. There are some countries where our findings may suggest a meaningful underlying pattern. Most notably, 87% of our estimates (10 out of 12) in Bolivia are positive and statistically significant and the remaining two fall short of the .05 threshold. More than one-third of the relationships we estimate are “statistically significant” in Nicaragua, El Salvador, Guatemala, Brazil, and Venezuela. In most cases, these relationships are positive, though we also find one negative relationship each in Nicaragua and Brazil. Three of the 12 coefficients we estimate in Costa Rica are negative and meet the .05 threshold. However, we also find one positive relationship that meets this threshold in Costa Rica.
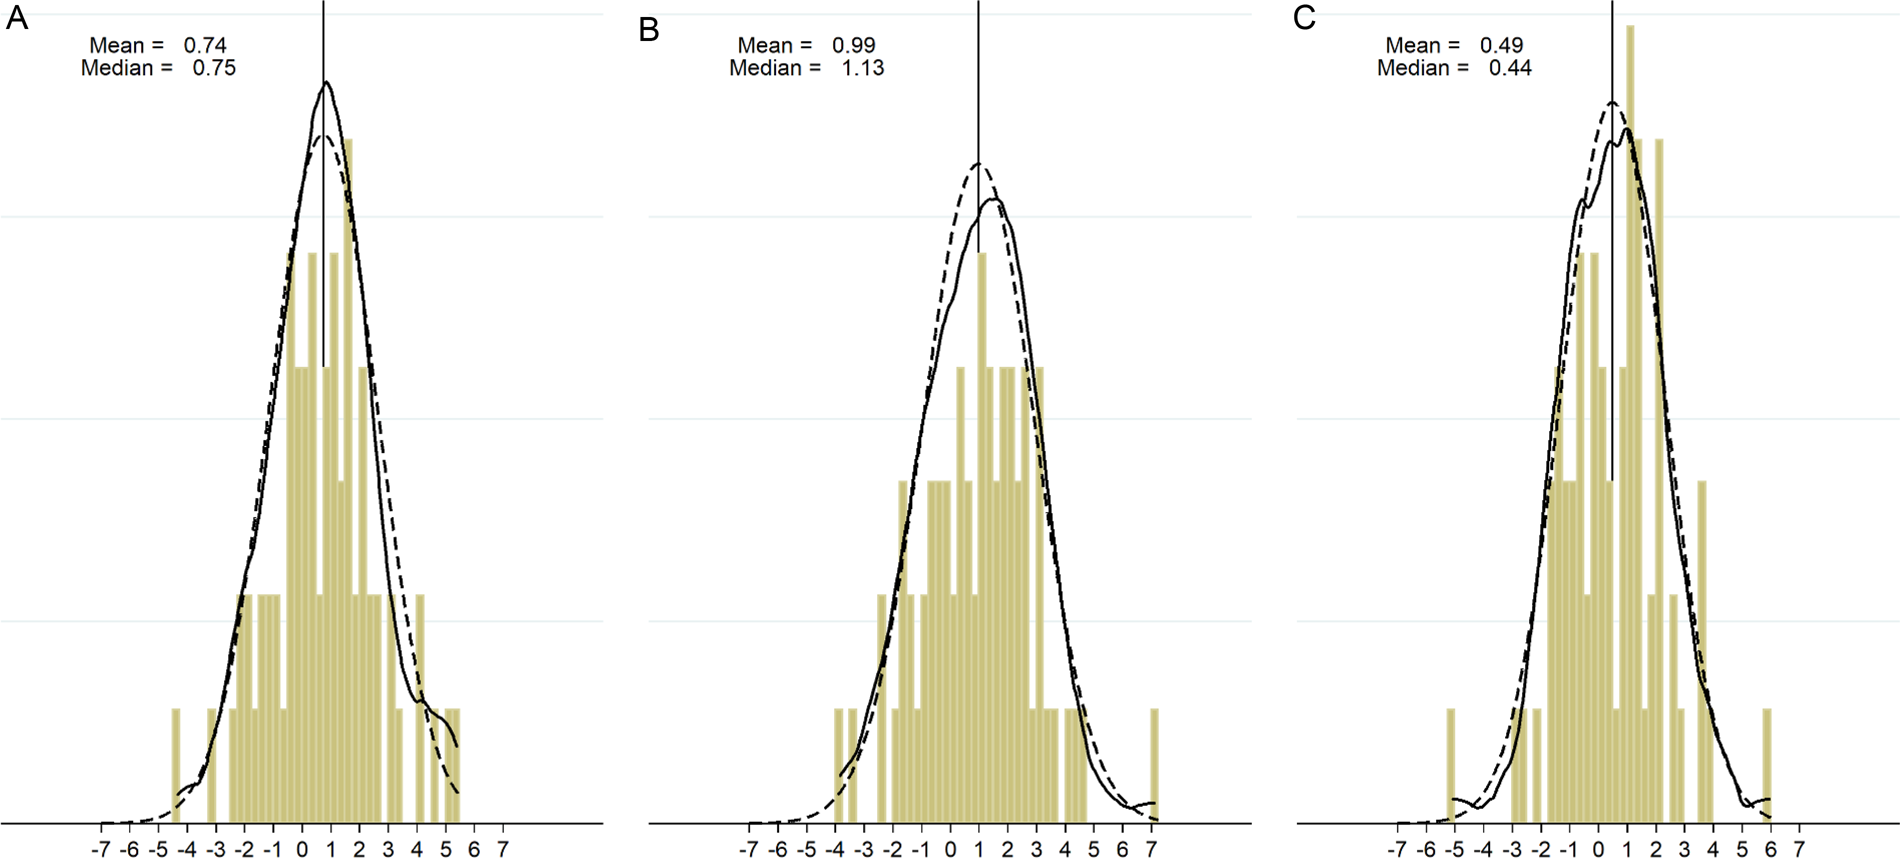
In Figure 2 we report the distributions of the t-statistics associated with the coefficients on the pigment variable from these models. We report histograms, as well as a kernel density plots, of these distributions. As a reference, we overlay a normal distribution (dashed line). The figure shows that the t-statistics are almost perfectly normally distributed for each outcome and Shapiro-Wilk tests do not allow us to reject the null of normality for the any of the t-statistic distributions. The distributions are each centered slightly above zero.
Distribution of t-statistics associated with pigmentation variable across country/years.
Note: Histograms illustrate distributions of t-statistics from models estimated separately for each country/year and each outcome. Solid curve shows kernel density plot; dashed lines illustrate normal distribution; vertical line indicates mean t-statistic.

If we treat the estimates reported in Figure 1 and Table 1 as independent hypothesis tests, some do exceed conventional thresholds of statistical significance. However, we have conducted many tests and the distributions reported in Figure 2 suggest that at least some of the “statistically significant” relationships we find may be emerging by chance. Further, we emphasize that, to the extent that we find relationships that reach conventional thresholds of statistical significance, they are predominately positive. This pattern is sharply at odds with our expectations and surprising given the potent and pervasive negative relationship between pigmentation and socio-economic status reported in Figure A2.
Additional Exploratory Analysis
To be clear, our evidence cannot prove that the patterns we find are strictly a product of sampling variability (random chance). In this section, we consider three possibilities that our analysis may fail to capture. Each pertains to the possibility that our models are misspecified because the effects of pigmentation on the outcomes we consider are conditional. We emphasize that these are post hoc explanations for our failure to find consistent, negative relationships between pigmentation and political attitudes (akin to those that emerge when we consider measures of socio-economic status as our outcomes).
First, it may be the case that the effects of pigmentation on political outcomes are confined to some ethnic groups in particular countries. We consider this possibility in Tables A12-A14 in the Appendix where we report models that include interactions between our pigmentation measure and indicators for self-reported ethnic identity. We report the p-value associated with a test of the joint significance of these interactions at the bottom of each model. Of the 54 models (3 outcomes × 18 countries), these tests only meet the .05 thresholds in six cases.
Moreover, in three of these cases, the evidence suggests this type of moderation for one outcome but not others. Specifically, our estimates suggest moderation in Costa Rica and Panama in our models predicting respect for political institutions, but not in models predicting the other two outcomes (p = .058 in the Panama model predicting external efficacy). Self-reported ethnicity appears to moderate the effects of pigmentation in Brazil in the satisfaction with democracy model, but not the others.
Bolivia is an exception where we find apparent evidence of moderation across all three outcomes. In our data, the vast majority of Bolivian respondents identify as Mestizo (70%) or Indigenous (17%). Our estimates suggest that the relationship between pigmentation and satisfaction with democracy differs significantly across these two groups (p < .01 for comparison of slopes). However, similar differences do not emerge for the other two outcomes. Instead, in these cases, the joint significance of the interaction terms is tied to apparently distinctive pigmentation effects among respondents who identified as “Black” or “Mulatto”—groups that, together, account for less than 1% of our Bolivian respondents. The relationship between pigmentation and respect for political institutions also appears to be less positive among Mestizo and Indigenous respondents than their white counterparts (who comprise a bit less than 7% of our Bolivian sample).
Second, we consider the possibility that, rather than serving as a link in the causal chain between pigmentation and political satisfaction (i.e., as a mediator), socio-economic status moderates the effects of pigmentation. For example, it may be that pigmentation only affects satisfaction with the political system among those who are economically disadvantaged or have low levels of educational attainment. Conversely, the effects of pigmentation may be confined to those higher on the social ladder because these individuals are more likely to recognize the connection between pigmentation and social standing.
We consider these possibilities in Table A15. For each outcome, we estimate four models, including interactions between pigmentation and: (1) educational attainment; (2) material wealth; (3) both education and wealth; (4) an index of education and income (with both measures standardized before averaging). In the models predicting satisfaction with democracy, none of the interaction terms reaches conventional thresholds for statistical significance and the interaction between pigmentation and our index of socio-economic status is not significant for any outcome.
In the external efficacy models, we find some evidence consistent with the notion that education (but not wealth) moderates the effects of pigmentation. Specifically, the relationship between pigmentation and external efficacy becomes more positive as educational attainment increases. In the model predicting respect for political institutions, we find a similar pattern, but this time tied to wealth—the relationship between pigmentation and this outcome becomes more positive as wealth increases (but not as education increases). Like our core analysis, these patterns are tantalizing and may be tied to real systematic patterns. The challenge is that they defy tidy theorizing—even post hoc.
Our final avenue of exploration considers the possibility that the relationship between pigmentation and feelings about the political system depends on who serves as the face of the political system. For each survey wave in each country, we retrieved images of the presidents serving at the time the survey was fielded. Four coders independently rated the skin pigmentation of each president using the pigmentation color chart (see Appendix Figure A1). We averaged scores across coders (correlations between the four coders' scores ranged from .796 to .847). We then estimated a multilevel model where respondents are treated as nested within country/years. We interact the country/year level measure of presidents' pigmentation with our measure of respondents' pigmentation to assess whether the relationship between individuals' pigmentation and their attitudes about the political system are more positive in contexts where the president is darker-skinned. However, the coefficient on the interaction term is not statistically significant in any of the three models (see Appendix Table A16).
Conclusions and Implications
We find that darker skin color is associated with lower levels of education and wealth, in every country in Latin America. Nevertheless, our evidence fails to support the expectation that the substantial socio-economic inequalities tied to skin pigmentation lead to negative political outcomes: individuals with darker skin do not seem to blame the political system for their lower status. In fact, our point estimates suggest that darker pigmentation is associated with slightly more favorable evaluations of the political system.
In concert with the distributions of t-statistics presented in Figure 2, the apparent variation in the effects of pigmentation across countries illustrated in the panels of Figure 1 is largely consistent with a simple explanation: when researchers conduct many hypothesis tests, some of the tests will yield false positives. Across the 213 countries/year models (18 countries × 4 years × three outcomes), only about 30% yielded coefficients with p-values less than .05. This is a higher overall rate of “statistically significant” relationships than the 5% we would expect to find by chance. However, only 6% were “statistically significant” and negative. We are not aware of any theoretical or empirical work that posits that darker-skinned individuals should be more favorably disposed to the political system in this region. Thus, the share of coefficients that were both “statistically significant” and conformed to our (seemingly reasonable) theoretical expectations was about what we would expect by chance.
We emphasize that we cannot rule out the possibility that systematic country-specific factors can explain the pattern of relationships we find. We considered several factors—self-identified race, socio-economic status, and the characteristics of salient political leaders—that might moderate the effects of pigmentation on satisfaction with the political system. However, we find little evidence that these factors systematically condition the effects of pigmentation. An additional possibility is that complex cultural and historical factors explain the seemingly idiosyncratic pattern of relationships we find. For example, although our pooled analysis does not yield clear evidence that the relationship between pigmentation and the outcomes we consider varies with the skin tone of the president, the positive attitudes of darker-skinned Bolivians towards the political system might be explained by the election of political leaders of indigenous descent that has taken place in recent years. The positive attitudes of darker-skinned respondents toward the system in El Salvador could derive from the electoral success of the Farabundo Marti National Liberation Front, a revolutionary front that emerged as a political party at the end of the civil war and that has continued to mobilize poorer, darker-skinned Salvadorans. Future work could build more robust theories regarding the country-level factors that shape the relationship between pigmentation and political outcomes, perhaps using our findings as a starting point. These theories could be tested using future waves of the AmericasBarometer survey or other data.
In summary, although our large dataset offers robust confirmation that skin color fosters socio-economic inequality in Latin America, we find little evidence that the effects of pigmentation extend to evaluations of the political system. Pigmentocracy may still be present in Latin America but darker-skinned citizens appear to retain their respect for their political institutions. The patterns of coefficients we find across samples suggest that analyses that rely on data from a single country at a single moment in time risk false positives. Thus, they offer a reason for scholars interested in studying this phenomenon further to develop theories that can explain cross-national (and, perhaps, over time) variation in the relationship between pigment and political attitudes.
Supplementary material
To view supplementary material for this article, please visit https://doi.org/10.1017/rep.2020.13.