


Introduction
Secular trends of global biodiversity have been studied for several decades (e.g., Newell Reference Newell1959; Sepkoski Reference Sepkoski1978, Reference Sepkoski1979, Reference Sepkoski1984, Reference Sepkoski1988, Reference Sepkoski1993; Sepkoski et al. Reference Sepkoski, Bambach, Raup and Valentine1981; Raup and Sepkoski Reference Raup and Sepkoski1982; Labandeira and Sepkoski Reference Labandeira and Sepkoski1993; Alroy et al. Reference Alroy, Marshall, Bambach, Bezusko, Foote, Fürsich, Hansen, Holland, Ivany and Jablonski2001, Reference Alroy, Aberhan, Bottjer, Foote, Fürsich, Harries, Hendy, Holland, Ivany and Kiessling2008). In contrast, only recently has it become possible to adequately quantify spatial variation in biodiversity over geologic time. The preeminent geographic pattern is the latitudinal biodiversity gradient (LBG), which is nearly ubiquitous across taxa (Hillebrand Reference Hillebrand2004; Mittelbach et al. Reference Mittelbach, Schemske, Cornell, Allen, Brown, Bush, Harrison, Hurlbert, Knowlton and Lessios2007) and through time (Crame Reference Crame2001; Powell Reference Powell2009; Naimark and Markov Reference Naimark and Markov2011). One of its fundamental characteristics is the latitude at which peak biodiversity occurs. Present-day marine biodiversity generally reaches its maximum at around 10–20°N (Valentine et al. Reference Valentine, Jablonski, Krug and Roy2009; Tittensor et al. Reference Tittensor, Mora, Jetz, Lotze, Ricard, Berghe and Worm2010; Powell et al. Reference Powell, Beresford and Colaianne2012) and declines toward both poles. In contrast, studies of fossil LBGs have documented that peak biodiversity has occurred at different latitudes over time (e.g., Renema et al. Reference Renema, Bellwood, Braga, Bromfield, Hall, Johnson, Lunt, Meyer, McMonagle and Morley2008; Powell Reference Powell2009; Mannion et al. Reference Mannion, Benson, Upchurch, Butler, Carrano and Barrett2012; Yasuhara et al. Reference Yasuhara, Hunt, Dowsett, Robinson and Stoll2012). Until recently, peak biodiversity of marine taxa was located around 30–40°N (Powell Reference Powell2009; Naimark and Markov Reference Naimark and Markov2011); it appears to have shifted toward the equator in the last few tens of millions of years for some taxa (Renema et al. Reference Renema, Bellwood, Braga, Bromfield, Hall, Johnson, Lunt, Meyer, McMonagle and Morley2008) but not others (Powell Reference Powell2009). These findings challenge the implicit assumptions that peak diversity occurs at the equator (as when diversity is regressed on latitude) and that the source of evolutionary novelty is some factor(s) intrinsic to the tropical environment. Our ability to reconcile these patterns and reach a full understanding of the dynamics of the LBG over time requires accurate reconstructions not only of the LBG, but also of its proximal controls. Here, we report Phanerozoic-scale, latitudinal gradients of macroevolutionary rates (origination and extinction) and geographic range shifts (invasion and extirpation) for a monophyletic, well-preserved, and taxonomically well-described taxon, the Brachiopoda, using sample-standardized occurrence data from the Paleobiology Database (http://paleodb.org).
Diversity within a region changes as the result of four factors: the rates at which taxa originate or invade a region, and the rates at which taxa become extinct or are extirpated from a region (Hawkins and Porter Reference Hawkins and Porter2003; Jablonski et al. Reference Jablonski, Roy and Valentine2006; Mittelbach et al. Reference Mittelbach, Schemske, Cornell, Allen, Brown, Bush, Harrison, Hurlbert, Knowlton and Lessios2007; Roy and Goldberg Reference Roy and Goldberg2007). We refer to these four components as the proximal controls of diversity in order to distinguish them from the ultimate processes that control speciation, extinction, and geographic range shifts (e.g., Stanley Reference Stanley1990). Total diversity within a region also depends on the number of holdover taxa (survivors) from the previous interval. Many studies of the proximal controls of the present-day LBG have focused on whether the tropics are a “cradle” or “museum” of diversity (Jablonski Reference Jablonski1993; Chown and Gaston Reference Chown and Gaston2000; Goldberg et al. Reference Goldberg, Roy, Lande and Jablonski2005; Mittelbach et al. Reference Mittelbach, Schemske, Cornell, Allen, Brown, Bush, Harrison, Hurlbert, Knowlton and Lessios2007; Arita and Vázquez‐Domínguez Reference Arita and Vázquez‐Domínguez2008), that is, whether diversity is high in the tropics because of high origination rates (=cradle) or because of low extinction rates (=museum). The available empirical evidence suggests that both speciation and extinction rates tend to be highest at low latitudes (Stehli et al. Reference Stehli, Douglas and Newell1969; Stehli and Wells Reference Stehli and Wells1971; Rohde Reference Rohde1992; Jablonski Reference Jablonski1993; Flessa and Jablonski Reference Flessa and Jablonski1996; Crame Reference Crame1997; Crame and Rosen Reference Crame and Rosen2002; Martin and McKay Reference Martin and McKay2004; Powell Reference Powell2007; Krug et al. Reference Krug, Jablonski, Valentine and Roy2009). High tropical diversity is apparently due to high speciation rates that outpaced high extinction rates (Crame Reference Crame2000; Buzas et al. Reference Buzas, Collins and Culver2002). High tropical origination and extinction rates have been linked to the large proportion of endemic taxa in that region (Stanley and Powell Reference Stanley and Powell2003; Powell Reference Powell2005, Reference Powell2007), which tend to have intrinsically higher speciation and extinction rates (Stanley Reference Stanley1990).
The role of geographic range shifts (by invasion or extirpation) has received less attention than in situ speciation and extinction rates (Roy and Goldberg Reference Roy and Goldberg2007). The most comprehensive analysis of a link between macroevolution and geographic range shifts is the “out of the tropics” model (Jablonski et al. Reference Jablonski, Roy and Valentine2006; Krug et al. Reference Krug, Jablonski and Valentine2007; Valentine et al. Reference Valentine, Jablonski, Krug and Roy2009; Jablonski et al. Reference Jablonski, Belanger, Berke, Huang, Krug, Roy, Tomašových and Valentine2013), which proposes that the tropics serve as a diversity pump as species originate at low latitudes and then invade higher latitudes. Because of the rapidity with which species can alter their ranges (Root et al. Reference Root, Price, Hall, Schneider, Rosenzweig and Pounds2003; Parmesan Reference Parmesan2006), it is difficult to capture geographic range changes with fossil data, and so this “out of the tropics” model has been formulated and tested mainly with living taxa. There are some indications that the “out of the tropics” model is strictly true only for the present-day fauna, and that the mechanism by which taxa originate in a particular area and then spread to higher latitudes is not necessarily localized to the tropics but occurs wherever the center of origin of a particular taxon may be. For example, Krug et al. (Reference Krug, Jablonski and Valentine2007) demonstrated that high speciation rates co-occurred with the area of highest diversity in the Anomalodesmata, a clade of bivalves that have a reverse LBG. Likewise, Beadle (Reference Beadle1991) documented an “into the tropics” spread of dendrasterid sand dollars after they originated at northern midlatitudes during the late Miocene.
Our compilation of secular latitudinal trends of the four proximal controls of biodiversity demonstrates a previously undescribed inverse relationship between macroevolutionary rates and geographic range shifts, which generally acted together to maintain an LBG over time. More generally, this study is the first to document secular latitudinal trends of macroevolutionary rates and geographic range shifts that underlie the LBG, and therefore provides the most comprehensive understanding yet of how these factors varied to produce observed diversity.
Methods
We downloaded 130,777 fossil occurrences for 3166 brachiopod genera from the Paleobiology Database, spanning the past 536 Myr (downloaded on 18 December 2012; search parameters, raw data, references, and contributors are available as supplementary online information). We refined the data set by removing genera represented by a single occurrence (n=529), and all occurrences dated less precisely than 20 Myr (n=5311), resulting in a final data set consisting of 124,937 occurrences for 2632 genera. Single-occurrence genera are unsuitable for geographic analyses because it is extremely difficult to determine whether a taxon was truly geographically restricted, or widespread but undetected (Buzas et al. Reference Buzas, Koch, Culver and Sohl1982).
These occurrences were grouped into bins 10 Myr long by 10° latitude wide, which provided an acceptable resolution for analyzing broad-scale patterns while maintaining sufficient within-bin sample sizes. The quality of our data set is affected by several factors. First, occurrences may be assigned to an incorrect time bin if they were dated incorrectly by the original author, or if the midpoint age was insufficiently precise. Second, diversity changes across intervals may be dampened because boundaries between the 10-Myr time intervals chosen for this study do not necessarily coincide with important paleontological boundaries. For example, the 450–440 Ma bin lumps the end-Ordovician mass extinction (ca. 444 Ma) with early Silurian rediversification, diminishing the apparent magnitude of this major event. Third, to calculate results, we used only taxa actually sampled within each bin, rather than counting overlapping polygons encompassing known occurrences. The overlapping polygon method, used in previous studies (Powell Reference Powell2007, Reference Powell2009), compensates for undersampling by projecting occupancy into bins in which a taxon was not necessarily sampled but was likely to have occurred. Using a sampled-in-bin method introduces more volatility to the results, but allows diversity estimates to be standardized by the number of occurrences, thus increasing confidence in estimates calculated for bins in which taxa are actually found. For these reasons, our data should be interpreted as reflecting broad-scale trends rather than true interval-by-interval variation.
We then used the occurrences to quantify diversity, origination, extinction, invasion, and extirpation within each bin (Fig. 1), using Fisher’s alpha (α) to correct for variation in sampling effort (Fisher et al. Reference Fisher, Corbet and Williams1943; Hayek and Buzas Reference Hayek and Buzas1997). Fisher’s α is a commonly used biodiversity metric that is calculated recursively from two measured variables, the number of occurrences (N) and the number of taxa (S), using the equation S=α ∙ ln[1+(N/α)]. Fisher’s α is independent of sample size provided that the data conform to a log-series distribution (Hayek and Buzas Reference Hayek and Buzas1997; Magurran Reference Magurran2004), which is true for our data (r 2=0.98, p<0.001). Unlike several other sample-standardization methods, α does not assume that variation in the number of occurrences is necessarily due to differences in sampling effort (Hayek and Buzas Reference Hayek and Buzas1997), a property it shares with a relatively new metric, shareholder quorum subsampling (SQS; Alroy Reference Alroy2010). For our data, α and SQS diversity are highly correlated (see below) and the results would be essentially identical had we used SQS. Certain combinations of N and S result in values of α that are not biologically meaningful because the value of α is greater than the number of sampled genera (Hayek and Buzas Reference Hayek and Buzas1997). In these cases, we replaced α with S, and replaced rates that were greater than one with a rate of one, because more than 100% of taxa cannot have arrived (by origination or invasion) or departed (by extinction or extirpation) from a bin. The sum of rates within a bin may be more than one, because a genus may count in more than one category; e.g., a genus may have invaded a latitudinal bin before becoming extinct during the same time interval. These substitutions affected 20% of diversity bins (96 of 485 bins with non-zero diversity), 2.7% of extinction bins (13 of 485), 3.9% of origination bins (19 of 485), 7.6% of extirpation bins (37 of 485), and 8.6% of invasion bins (42 of 485).
Method used to enumerate origination, extinction, invasion, and extirpation, using occurrence data for Leioproductus as an example. The number of Leioproductus occurrences is given in each occupied (shaded) bin.

Global diversity calculated as α closely resembles secular patterns of diversity generated by other methods. Fisher’s α is highly correlated with (1) range-through diversity calculated from the Sepkoski et al. (Reference Sepkoski, Jablonski and Foote2002) data set after interpolation to 10-Myr bins (accessed from http://strata.geology.wisc.edu/jack/; r=0.75, p<0.0001), (2) sampled diversity in 10-Myr bins obtained from the Paleobiology Database (r=0.79, p<0.0001), and (3) diversity data from the Paleobiology Database after sample-standardization by SQS (r=0.77, p<0.0001).
Results
Geography of Origination, Extinction, Invasion, and Extirpation
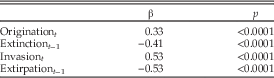
Sample-standardized rates of origination, extinction, invasion, and extirpation are presented in Figure 2. Averaged across all bins, mean invasion and extirpation rates were significantly greater than mean origination and extinction rates (Fig. 3). We assessed the relative importance of each factor to changes in diversity by regressing the Fisher’s α of originations, extinctions (in the previous interval), invasions, and extirpations (in the previous interval) on the change in diversity from the previous interval, after removing bins with zero diversity (n=560, r 2=0.85, p<0.0001). All four factors contributed significantly to changes in diversity (Table 1). However, the standardized coefficients for invasion and extirpation were greater than those of origination and extinction by a factor of about 1.3; i.e., changes in regional diversity are determined more by existing taxa invading or becoming extirpated from a region than by in situ origination or extinction. Survival rates were comparable to origination and extinction rates (Fig. 3), indicating that, at this geographic and temporal scale, holdover taxa contribute substantially to total diversity within a region.
Sample-standardized geographic patterns of extinction, origination, invasion, extirpation, and survival (holdover) rates, in 10-Myr×10° latitude bins. Rates were calculated by determining Fisher’s α of genera in each category and then dividing by Fisher’s α of the total number of genera in the bin. For example, if a bin contained 100 occurrences of 20 genera, and 5 of the genera represented by 25 of the occurrences became extinct in that bin, the extinction rate is α[25, 5]/α[100, 20]=1.9/7.5=0.25. Sample-standardized rates were highly correlated with nonstandardized rates (all pairwise comparisons r>0.83, p<0.001). Holdover taxa do not contribute to changes in diversity, but are included here because they partially determine total diversity in a region.
Phanerozoic mean rates and bootstrapped 95% confidence intervals of origination (Org.), extinction (Ext.), invasion (Inv.), extirpation (Etp.), and survival (Surv.). The rates significantly differed from one another, p<0.0001. Means with the same subscript were not significantly different at the 0.05 significance level using Fisher’s Least Significant Difference test.
Standardized coefficients (β) from a multiple regression of four predictors on change in diversity. Standardized coefficients assess the degree to which changes in the predictor change the dependent variable. Variance inflation factors were all less than 10 (origination=1.5, immigration=1.6, extinction=1.3, emigration=1.3), indicating that multicollinearity did not affect the statistical significance of the individual predictors (O’Brien 2007).
Major mass extinctions and radiations were not necessarily latitudinally extensive (Fig. 2). Geographically prominent extinction events occurred during the last interval of the Permian Period (260–250 Ma) and the last interval of the Triassic Period (210–200 Ma). During the late Permian event, extinction rates exceeded 80% over at least three-quarters of the globe (13 of 17 latitudinal bins), and during the Triassic event, they exceeded 60% over nearly half of the globe (8 of 17 latitudinal bins). Geographically prominent origination events occurred during the Early Cambrian Period (530–520 Ma) and the first interval of the Triassic Period (250–240 Ma). Brachiopods simultaneously appeared in 10 of 17 latitudinal bins within a 10-Myr interval of the Early Cambrian. During the earliest Triassic, origination rates exceeded 60% over more than half the globe (9 of 17 latitudinal bins) as the brachiopod fauna recovered from the end-Permian event. Other major events were not as geographically extensive. For example, mass extinctions at the end-Ordovician (450–440 Ma), Late Devonian, and end-Jurassic (160–150 Ma) were taxonomically severe for brachiopods, but were restricted to a narrow latitudinal zone. In general, these major origination and extinction events were not accompanied by unusual patterns of invasion or extirpation (Fig. 2); i.e., they did not involve major shifts in geographic distribution.
Broad-scale trends in origination and extinction rates, once averaged across time and latitude, were inversely related to invasion and extirpation rates. Zonally averaged origination and extinction rates declined in two phases, the first from Cambrian to late Permian time, and the second from latest Permian time to the present. These declines were paralleled by concomitant increases in zonally averaged invasion and extirpation rates (Fig. 4). Average geographic range size, quantified as the mean number of occupied latitudinal bins (Fig. 5), did not trend significantly during the first interval (r 2=0.02, p=0.4), but declined from the latest Permian to the present (r 2=0.5, p<0.0001; results were the same when geographic range was quantified as the total latitudinal range rather than number of occupied bins; Cambrian–late Permian: r 2=0.002, p=0.8, latest Permian–present: r 2=0.3, p=0.002).
Zonally averaged rates of origination, extinction, invasion, and extirpation over time. Trend (dashed) lines were fit by reduced major axis regression.
Mean number of occupied latitudinal bins per time interval with bootstrapped 95% confidence intervals. Trend (dashed) lines were fit by reduced major axis regression.
Time-averaged latitudinal gradients showed a weaker, but similar, inverse relationship between macroevolutionary rates and geographic range shifts. Mean rates of origination and extinction, averaged across time bins, tended to be highest at low latitudes, whereas mean rates of invasion and extirpation tended to be lowest at low latitudes (Fig. 6). These trends were evident only in the data between 60°S and 60°N, and the trend was evident but not statistically significant for invasion and extirpation rates.
Time-averaged rates and bootstrapped 95% confidence intervals of origination, extinction, invasion, and extirpation.
Geography of Diversity
The general volatility of origination, extinction, invasion, and extirpation rates contrasts with the relative stability of diversity over time (Fig. 7). The sample-standardized pattern of diversity compiled here shows the same basic pattern as an earlier study of brachiopods compiled from a different data set (Powell Reference Powell2009), and with results for all marine invertebrates compiled from the Paleobiology Database (Naimark and Markov Reference Naimark and Markov2011). Our new data permit a slightly more refined understanding of brachiopod diversity over time: the latitudinal distribution of diversity shows three distinct phases occurring at different times of the Phanerozoic, each characterized by a different shape of the mean LBG (Fig. 8). The first interval covered the Paleozoic Era, during which brachiopods were generally present everywhere there was continental shelf area, which included all but high northern latitudes until Pangea formed during the Pennsylvanian Period. The second interval covered the Triassic through Jurassic Periods, during which brachiopods maintained broad latitudinal coverage but were most diverse in the northern midlatitudes. The third interval covered the Cretaceous Period to the present. During this interval, diversity was bimodally distributed as the northern midlatitude peak persisted from the second interval and a southern mid-latitude peak developed in the middle Cretaceous Period, while becoming scarce elsewhere, particularly in the tropics. A few genera repopulated the tropics toward the end of this third interval (approximately the middle Eocene; Fig. 7).
Sample-standardized geographic pattern of diversity during the Phanerozoic Eon, in 10-Myr×10° latitude bins. Note that a log scale is used for Fisher’s α so that fine detail is not obscured by binning. Dotted line indicates the latitudinal position of peak biodiversity.
Average latitudinal biodiversity gradients (mean normalized Fisher’s α and bootstrapped 95% confidence intervals) for the Phanerozoic Eon, Paleozoic Era, Triassic–Jurassic Periods, and Cretaceous Period to present. Diversity within each bin was normalized by dividing by the maximum diversity in that interval before averaging, so that the average shape was not distorted by differences in the absolute magnitude of diversity between intervals.
In most cases, the combination of origination, extinction, invasion, and extirpation was not sufficient to reestablish a new LBG in any one time interval. We tested whether the change in diversity from the previous interval was distributed uniformly among latitudinal bins, using a Kolmogorov-Smirnov exact test. Even at a very liberal significance level of α=0.05 (uncorrected for multiple comparisons), changes in diversity were distributed non-uniformly in only eight of the 53 10-Myr time intervals. These intervals included the early Cambrian (530–520 Ma, p=0.02), late Cambrian–early Ordovician (490–480 Ma, p=0.01), late Permian (280–270 Ma, p=0.003; 270–260 Ma, p=0.003; 260–250 Ma, p=0.01), middle Triassic (240–230 Ma, p=0.002; 230–220 Ma, p=0.03), and early Jurassic (190–180 Ma, p=0.02). In most intervals, the existence of an LBG was not the result of geologically recent processes that created or enhanced an uneven latitudinal distribution of diversity, but was instead a holdover from a previous interval.
Discussion
The Phanerozoic decline in origination and extinction rates seen in our brachiopod data was first documented for the global marine fauna by Raup and Sepkoski (Reference Raup and Sepkoski1982). Gilinsky (Reference Gilinsky1994) explained the decline as the progressive culling of higher taxa with intrinsically high origination and extinction rates. These taxa were eliminated because their diversity histories were more volatile and therefore more likely to be completely eliminated. Unlike the decline described by Raup and Sepkoski (Reference Raup and Sepkoski1982), however, the brachiopod decline seen here is best modeled as two declines that were separated by the end-Permian mass extinction, which reset origination and extinction rates to high levels. Non-monotonic declines in extinction rate have been described by Van Valen (Reference Van Valen1984; a two-phase decline separated by the end-Permian mass extinction) and Bambach et al. (Reference Bambach, Knoll and Wang2004; a three-phase decline separated by the end-Ordovician and end-Permian mass extinctions). The two-phase pattern exhibited by brachiopods may be explained by the fact that the Paleozoic and post-Paleozoic brachiopod faunas were almost entirely taxonomically distinct, owing to the severity of the end-Permian mass extinction (just 1.4% of all genera are present in both intervals). Following the end-Permian event, the culling process described by Gilinsky (Reference Gilinsky1994) acted anew on an ecologically similar but essentially evolutionarily distinct fauna. A two-phase decline may not be as evident in the entire marine fauna (Raup and Sepkoski Reference Raup and Sepkoski1982) because many of the component taxa did not suffer in the end-Permian event as severely as the brachiopods.
Our results suggest that long-term changes in origination and extinction rates were closely related to the ability of brachiopods to shift their geographic ranges. The connection between macroevolutionary rates and geographic range shifts was first made by Stanley (Reference Stanley1990), who suggested that taxa with greater dispersal ability have lower origination rates because dispersal limits the formation of isolated populations. These taxa also have lower extinction rates because dispersal produces a widespread, stable population resistant to disturbance. The benefits of a widespread geographic range are well known (Jablonski Reference Jablonski2005; Payne and Finnegan Reference Payne and Finnegan2007): the larger the geographic range, the more widespread a perturbation has to be to completely eliminate the population. However, this reasoning cannot explain the long-term declines in origination and extinction observed here, because the average latitudinal range of brachiopods trended nonsignificantly during the first phase and decreased during the second, the opposite of the expected relationship. The fact that invasion and extirpation rates increased over this time interval suggests instead that greater dispersal ability conferred extinction resistance because it enabled species to escape selection pressures by tracking favored environments. Over time, taxa with poor dispersal ability, and hence intrinsically high origination and extinction rates, were replaced by taxa able to withstand environmental change by shifting their geographic range, thus buffering them from extinction while reducing the probability of allopatric speciation. This same negative relationship was also weakly evident as a latitudinal trend. Tropical regions harbor high biodiversity today because they contain many endemic taxa (Myers et al. Reference Myers, Mittermeier, Mittermeier, Da Fonseca and Kent2000; Roberts et al. Reference Roberts, McClean, Veron, Hawkins, Allen, McAllister, Mittermeier, Schueler, Spalding and Wells2002), which, by definition, have small geographic range sizes and therefore intrinsically high origination and extinction rates (Stanley Reference Stanley1990). Conversely, higher latitudes generally contain taxa that are broadly adapted, because environmental conditions there vary considerably on both ecological and geological time scales (Addo-Bediako et al. Reference Addo-Bediako, Chown and Gaston2000). Consequently, taxa living at higher latitudes typically have large geographic range sizes and a greater ability to shift their geographic ranges in response to changing environmental conditions, and, therefore, exhibit intrinsically low rates of origination and extinction. This hypothesis cannot be tested directly because adequate data on secular or latitudinal trends in the dispersal ability of brachiopods have not been reported in the literature. In living brachiopods, higher fecundity is associated with larger body sizes (Williams et al. Reference Williams, James, Emig, Mackay and Rhodes1997), which increased through the Paleozoic (Novack-Gottshall and Lanier Reference Novack-Gottshall and Lanier2008). This trend may underlie the secular pattern documented here, if higher fecundity increased the probability of dispersing widely.
Overall, the fact that regional diversity was determined more by invasion and extirpation than in situ origination and extinction is not surprising. Species are able to rapidly invade new areas by shifting the boundaries of their geographic range (Root et al. Reference Root, Price, Hall, Schneider, Rosenzweig and Pounds2003). By comparison, usual rates of evolution are too slow to keep up with environmental change unless phenotypic plasticity is high (Visser Reference Visser2008; Quintero and Wiens Reference Quintero and Wiens2013). As a consequence, most regions acquire more of their diversity from immigrants than in situ speciation. An illustrative example is the Hawaiian islands, which, as geographically isolated oceanic islands, contain what is considered to be a highly endemic marine fauna (Kier et al. Reference Kier, Kreft, Lee, Jetz, Ibisch, Nowicki, Mutke and Barthlott2009). Even so, only about one-third of the marine species are endemic (Kay and Palumbi Reference Kay and Palumbi1987), the rest consisting of colonizers from elsewhere in the Indo-West Pacific.
In general, origination, extinction, invasion, and extirpation rates in combination tended to maintain, rather than alter, the shape of the LBG. In most intervals, the LBG exists as a holdover from a previous interval rather than the result of a continuous process of renewal. Intervals for which a different shape of the LBG could arise as a result of processes occurring within one 10-Myr time interval occur over about 15% of the Phanerozoic Eon, at most. Although our results do not contradict any of the existing models to explain the LBG, they do suggest that the evolutionary dynamics characterizing any particular time interval may not be representative of other times. Living brachiopods are most diverse at midlatitudes, unlike many other marine invertebrates (Powell Reference Powell2009; Tittensor et al. Reference Tittensor, Mora, Jetz, Lotze, Ricard, Berghe and Worm2010; Powell et al. Reference Powell, Beresford and Colaianne2012), a latitudinal distribution that has remained essentially unchanged since the Jurassic. Because this study is the first to document the proximal controls of the LBG over the Phanerozoic, it is currently unclear whether the patterns documented here are similar to the underlying processes that govern the LBGs of other taxa.
Acknowledgments
This work was supported by a grant to M.G.P. from the NASA Astrobiology Program. This is Paleobiology Database publication number 214.
Supplementary Material
Supplemental materials deposited at Dryad: doi:10.5061/dryad.7k7k5



