


INTRODUCTION
Interest in deliberative democracy, as a field of scholarly study and as a policy tool, has exploded in the last decade. The weaknesses of solely relying on electoral democracy to ensure accountable and responsible government have never been more apparent, and as such, deliberative systems have been revived as a complement to electoral systems, to deepen democratic processes (American Political Science Association 2012). This shift has been especially marked in developing countries, where collective action via citizen engagement has become a very important modality; indeed, the World Bank alone has spent over USD 80 billion in interventions to promote deliberative citizen engagement (Mansuri and Rao Reference Mansuri and Rao2012). By moving decision-making power from government offices to the village itself, these efforts have been viewed as a way to wrest power from elites and improve the equity of allocations across local communities. Whether in village meetings or neighborhood associations (Auerbach Reference Auerbach2017), citizen engagement of this sort is thought to result in more efficiently implemented and inclusively distributed development outcomes. These instrumental aims, however, are only part of the reason that international organizations and national governments have embraced deliberative democracy; the other key reason is that we increasingly think that citizen’s voice has intrinsic normative value (Dryzek Reference Dryzek1994; Elster Reference Elster1998; Gutmann and Thompson Reference Gutmann and Thompson2004).
Despite this resurgence, however, scholarship on deliberative democracy has been quite limited—both in method and in setting. To date, the empirical study of deliberation remains primarily focused on relatively affluent settings, with a clear presumption of relative equality among actors. This paper shifts focus to the developing world—in particular, to the largest deliberative institution in human history, the constitutionally mandated gram sabhas, or village assemblies, of rural India. Studying transcripts from these gram sabhas permits us to observe how deliberation works in a real-world (rather than lab-based) and institutionalized (rather than ad hoc) setting. It also allows us to analyze how deliberation works in a context with high inequality and low literacy.
Of particular concern are the ways in which gender inequalities and power differences between officials and citizens may be reinforced or even exacerbated in deliberative fora. First, deliberative forums may perpetuate the existing inequalities among citizens. Unlike aggregative forms of democracy, where standing among voters is leveled by the equal-weighting ballots, and institutional safeguards such as the secret ballot protect against coercion, deliberation requires public, often costly, exercise of voice. It takes place in highly localized settings, where social norms shape the actions of individuals within the group. These issues may be particularly acute for women, who tend to be perceived as less influential than men, who are less likely to set the agenda, and who are less likely to impact outcomes (Karpowitz and Mendelberg Reference Karpowitz and Mendelberg2014). Second, inequality between voters and state officials can undermine the promise of deliberative institutions. When participation is induced by the state, as in decentralization efforts or community-driven development programs, agents of the state often are stuck in the ironic situation of having to act against their self-interest by promoting institutions whose purpose is to undermine their power. Therefore, local bureaucrats and politicians may try to undermine these institutions by canceling them, crowding out meaningful deliberation with bureaucratic announcements, or ignoring voters’ claims and evading their requests (Bhattacharjee and Chattopadhyay Reference Bhattacharjee and Chattopadhyay2011).
Whether and to what extent these forms of dominance—of men over women and of state officials over citizens—affects deliberative institutions in practice is an empirical question, but one that has been challenging to study systematically on a large scale, particularly in real-world, citizen-centered deliberative forums. In this paper, we overcome the challenge of scale by applying Natural Language Processing (NLP, or text-as-data) methods to an original corpus of village assembly transcripts from the south Indian state of Tamil Nadu. We then systematically explore the relationship between deliberative influence and the gender or position (citizen versus official) of a speaker. By using NLP methods, we are able to quantitatively examine not only the relative floor time enjoyed by different types of speakers, but also their ability to influence the topic of conversation (agenda-setting power) and to have the state listen to their claims (dialogic responsiveness).
We find that, despite women’s high rates of attendance in Tamil Nadu’s village assemblies, they are indeed the “silent sex.” Women make up 58% of attendees on average, but are responsible for only one third of the available floor time. Moreover, when women do speak on a particular topic, they are significantly less likely than men to elicit a topical or relevant response from state officials—suggesting a meaningful inequality in deliberative influence across the sexes. Importantly, these results hold even if we control for the particular topic that is being raised; that is, for any given topic, a man is more likely to get a response from an official than a woman. In contrast to our findings on gender inequality, we do not find evidence assemblies are dominated by elected officials. A majority of floor time is taken up by citizens, who are more likely than officials to set the agenda. Moreover, while officials often read a set of announcements at the beginning of meetings, these statements are generally in response to the issues raised by citizens, not efforts to steer the conversation.
Our work also speaks to the literature on the impact of descriptive representation on social norms. In particular, we explore whether and how gender quotas for the village council presidents affect deliberative equality. Advocates of quotas have long argued that this policy not only improves representation of women and minorities via the election of policy makers who may share their preferences but also creates a precedent for women voicing their own preferences (Mansbridge Reference Mansbridge1999). We find that the presence of a female president has a meaningful and significant impact on the ability of women to be heard and responded to. We show that women are not only more likely to drive conversation under female presidents, but that female presidents themselves are significantly more responsive to women constituents, consistent with the argument that “descriptive representation facilitates vertical communication between representatives and constituents” (Mansbridge Reference Mansbridge1999, 641) in conditions where women have been historically marginalized. However, the mere presence of female incumbents has no effect on the frequency or volume of women’s speech—suggesting that reservations are not a panacea for gendered inequality in these deliberative forums.
This paper contributes to the growing empirical literature on deliberation, which began with rich and careful ethnographies of deliberation in Western settings,Footnote 1 and has since expanded to study developing country contexts as well.Footnote 2 While the bulk of this literature has been limited to “successful” examples of deliberative resource allocation, such as participatory budgeting in Brazil (Baiocchi et al. Reference Baiocchi, Heller and K. Silva2011) and the People’s Campaign in Kerala (Heller, Harilal, and Chaudhuri Reference Heller, Harilal and Chaudhuri2007), scholars are now turning to deliberation in more challenging contexts. Through detailed qualitative and ethnographic work, scholars have shown how deliberative forums can be used as a space to make dignity claims for underprivileged groups, and even as a tool to solve social problems such as female general mutilation (Mackie Reference Mackie, Rao and Heller2015). Other work has expanded the scope of deliberation to include everyday communication outside the context of formal forums (Swidler and Watkins Reference Swidler, Watkins, Heller and Rao2015).
In other work on gram sabhas, Rao and Sanyal (Reference Rao and Sanyal2010) use qualitative discourse analysis to study the transcripts of 290 gram sabhas from South India to show that these forums help shape the discursive styles of disadvantaged groups. Since gram sabhas are embedded within a democratic system that is also subject to electoral accountability, they are a relatively safe space for open speech. Things that cannot be said in private discourse become possible in a gram sabha, because political elites may face electoral costs by taking action against a citizen for something said in a gram sabha. This allows lower castes to use the space to transgress social norms and make claims for dignity; marginal groups voice their concerns and previously “hidden transcripts” become public—forcing public discussion on sensitive social issues that people would rather avoid. Moreover, Ban, Jha, and Rao (Reference Ban, Jha and Rao2012), looking at the same transcripts, finds that the topics discussed within it are congruent with the preferences expressed by median households in a large representative sample of the village. Thus, gram sabhas are arguably democratically “efficient.”
Beyond these studies, there is a growing literature that tests hypothesis derived from deliberative theory in the context of lab experiments (Fishkin and Luskin Reference Fishkin and Luskin2005; Goeree and Yariv Reference Goeree and Yariv2011; Karpowitz and Mendelberg Reference Karpowitz and Mendelberg2014; Karpowitz, Mendelberg, and Shaker Reference Karpowitz, Mendelberg and Shaker2012; List et al. Reference List, Luskin, Fishkin and McLean2013). While such work has helped inform our understanding for how institutional contexts (e.g., decision rules and moderators) affect deliberative quality, studying systematic variation in the real world has been much more challenging. A notable exception has been the study of parliamentary debates, where the availability of data has enabled scholars to leverage temporal variation to study patterns in deliberative quality (Clayton, Josefsson, and Wang Reference Clayton, Josefsson and Wang2017); unfortunately, this strand of work has often been limited in its ability to test the effects of institutional variation due to the focus on a single deliberative body.
Our work builds upon this scholarship by examining deliberative outcomes in a challenging rural context, but departs methodologically from this earlier literature by quantifying inequalities in participation. We study a new source of transcript data from numerous local deliberative bodies—enabling us to correlate deliberative outcomes with local institutional variation, including the gender of the local politicians moderating the discussion. Moreover, the focus on local, rather than national-level institutions, allows us to examine citizen voice rather than official debate; in doing so, we are able to address normative questions about whether and how citizens are able to participate in their own governance. The limitation of studying gram sabhas, however, is that, compared to parliamentary deliberations they are relatively short and convene only four times a year. Thus, a question that arises is whether these bodies can be considered deliberative. We would argue that they are deliberative bodies because they meet regularly, play a central role in the governance of the village, and are a form of direct democracy in which every citizen of the village is a potential participant.
This paper also provides an important bridge between empirical work and normative theories of deliberation by generating a clear set of metrics that can be coded using automated methods. Given the considerable debate within the normative literature both about deliberative standards as well as the more basic question of what constitutes deliberation, there has been meaningful disagreement within the empirical literature as to how to systematically assess deliberative quality (Myers and Mendelberg Reference Myers, Mendelberg, Huddy, Sears and Levy2013). Here, we build upon the minimalist approach to deliberation outlined by Mansbridge (Reference Mansbridge, Rao and Heller2015) and focus on a set of context-relevant standards that relate to the political and ethical functions of deliberation. In doing so, we outline qualities of good deliberation that are both applicable to development contexts and that can be operationalized by future scholars.
INSTITUTIONAL CONTEXT: PANCHAYATI RAJ
Deliberative democracy has deep historical roots in India, where, for centuries, deliberative bodies were central to systems of local governance, and religious discourse and dialogue (Parthasarathy and Rao Reference Parthasarathy, Rao, Bachtinger, Dryzek, Mansbridge and Warren2018). In the period of colonial rule in the nineteenth century, the interplay of ideas between western liberal philosophers and Indian intellectuals led to India becoming a fertile ground for experiments in governance. The idea of self-sustaining village democracy, in particular, appealed greatly to Mahatma Gandhi, who made it a central tenet of his philosophy. In 1993, 45 years after independence, the Gandhian push for deliberative village democracy was given constitutional sanction with the passing of the 73rd amendment to the Indian constitution. The amendment mandated that all Indian villages would be governed by an “executive” elected village council, and a “legislature” formed by the gram sabha, to which every citizen of the village would be a member, with meetings held at least two times a year. Lastly, the amendment required that at least 33% of seats in village councils would be reserved for women, and a number proportionate to their population in the village reserved for disadvantaged castes. Today, every one of India’s eight hundred million rural residents is a member of a gram sabha, where important issues such as the allocation of public funds and the selection of beneficiaries for public programs are discussed.
While these mandates represented the minimal requirements for the village panchayat system, every Indian state was given a wide degree of leeway in how the VPs would function—leading to considerable variation in the VPs’ budgets, functions, and implementation of the gram sabha. In Tamil Nadu, where this study is located, the specific functions and requirements of the VPs were defined by the Government of Tamil Nadu (1994). Formally, the functions devolved to the VP have been to identify target populations for federal and state poverty alleviation programs; the construction and maintenance of basic public goods (village roads, streetlights, drinking water, and drains); and the provision of sanitation services.
In general, Tamil Nadu has not been a front-runner in devolving much power to VPs nor have recent improvements significantly improved policy devolution.Footnote 3 Though Tamil Nadu VPs are not sufficiently well-financed to actually deliver public goods and services on their own, they do play a vital role in (a) implementing the last mile of various functions and programs and (b) relaying information about local needs to the higher block tier of government, which has final authority on the provision of key services. For example, the VPs identify the areas that need more drinking water; keep track of repair and construction needs; collect census data on household toilet access; provide information on local infrastructure needs (such as roads and drainage); and identify beneficiaries from the target population for several other federal and state anti-poverty programs. The VP also provides information to higher levels of government on public service problems that range from the functioning of the public food distribution systems to glitches in the new electronic payments system for public works. Lastly, the VP is fully responsible for the full implementation (including payment of salaries) of the federal rural employment scheme (NREGA), which guarantees 100 days of work on public works for any individual who wants this work.Footnote 4
Much of this information is collected via the village-wide assembly, or gram sabha, which serves a key venue for citizens to engage with local officials to discuss the administration of government programs. In response to the widely acknowledged problem of infrequent gram sabhas, the state government of Tamil Nadu passed Acts in 1994 and 1998 that gave the gram sabha substantial powers, and subsequently issued an order saying that it should be held four times a year (Palanithurai Reference Palanithurai2003). Since its passage, this mandate has had near universal compliance; today, panchayat elections and the quarterly ritual of the gram sabha have become ingrained into the political culture of rural Tamil Nadu.
WHAT COUNTS AS (BETTER) DELIBERATION?
Definitions of deliberation, and the normative standards underlying them, have evolved considerably over the last decade, partly as a consequence of empirical work from field and lab settings. While more traditional definitions of deliberation (Dryzek Reference Dryzek1994; Elster Reference Elster1998; Goodin Reference Goodin2005; Gutmann and Thompson Reference Gutmann and Thompson2004; Habermas Reference Habermas1990) often presume equality among actors and limit what counts as deliberation to claims rooted in rationality and impartiality, these standards have been challenged by the rapid revival of deliberative institutions in the developing world. In this section, we define the metrics by which we evaluate deliberative quality in such a setting—that is, one in which inequality and illiteracy may shape patterns of discussion and debate.
We begin with Mansbridge’s (Reference Mansbridge, Rao and Heller2015) minimalist definition, which explicitly acknowledges that deliberation, particularly among the less educated, may depart from purely “rational” speech; rather, deliberation may involve story-telling and emotional claims that are meant to build empathy, trigger a sense of injustice, and establish credibility. Indeed prior studies show that low literacy may contribute to limited “oratory competency,” where speech may engage in identity claims and declarations rather than rational reflection focused on communicating, and weighting between, competing interests. Though such speech would be excluded by a more traditional definition of deliberation, it still constitutes “mutual communication regarding matters of common concern.” Moreover, even this type of speech can still provide functional benefits, such as improving the transmission of information, coordinating collective action, and bolstering the legitimacy of decisions (Fearon Reference Fearon and Elster1998).
The ideal expectation of equality of power among participants has also been chastened by reality, so newer approaches to deliberation emphasize the importance of equalizing power across separate spheres or by facilitating countervailing forces (Dryzek Reference Dryzek2000; Mansbridge et al. Reference Mansbridge, Bohman, Chambers, Estlund, Føllesdal, Fung, Lafont, Manin and Martí2010) within fora. In other words, the goal of achieving a rationally motivated consensus has been set aside in favor of goals that are arguably more desirable and realistic in pluralistic societies, such as arriving at “workable agreements” (Dryzek Reference Dryzek2000, 170), “clarifying conflicts” (Mansbridge et al. Reference Mansbridge, Bohman, Chambers, Estlund, Føllesdal, Fung, Lafont, Manin and Martí2010, 93), and better understanding the others’ viewpoint through deliberating across differences (Young Reference Young and Macedo1999). The view of deliberation as a cooperative venture (Gutmann and Thompson Reference Gutmann and Thompson1996; Mansbridge Reference Mansbridge1980) has also been forfeited in favor of recognizing disputes and contestation as central to deliberative democracy (Curato et al. Reference Curato, Dryzek, Ercan, Hendriks and Niemeyer2017; Dryzek Reference Dryzek2000; Mansbridge et al. Reference Mansbridge, Bohman, Chambers, Estlund, Føllesdal, Fung, Lafont, Manin and Martí2010).
Following these developments, we depart from previous attempts to measure deliberative quality, including, for example, Bächtiger et al.’s (Reference Bächtiger, Spörndli, Steenbergen and Steiner2005) Discourse Quality Index (DQI). Instead, we focus on the measures that relate explicitly to the political and ethical functions of deliberation (Mansbridge Reference Mansbridge, Rao and Heller2015).Footnote 5 That is, we conceive of good deliberation as that which (1) gives all participants an equal opportunity to influence the outcome by promoting “an inclusive and egalitarian political process;”Footnote 6 (2) embodies the ideal of mutual respect, whereby citizens listen attentively to one another; and (3) allows citizens to be agents who participate in the governance of their society (Mansbridge Reference Mansbridge, Rao and Heller2015, 43).
It is difficult to know or even claim how much of each of these three attributes is needed for good deliberation, or even how their relative merits should be weighed in determining whether deliberation “works.” That would require strong theoretical claims that we are unable to make, especially given the ambiguity about the nature of deliberation expressed in the more recent normative literature. Therefore, we conduct a more modest exercise of testing the variation in each of these metrics in our data, with the claim that an ordinal improvement in any of them would constitute “better” deliberation. We next address each of these measures in turn.
Equality of Participation
First, good deliberation must give participants equal opportunity to influence the outcome—at its most basic, this can be captured with a measure of floor time. While the frequency or volume of speech alone may not be a measure of equality, the ability or willingness to speak does reflect one’s authority or standing in the community. By viewing speech as a social act, we follow Karpowitz and Mendelberg (Reference Karpowitz and Mendelberg2014), who define speech as “a form of symbolic political or civic participation that may reflect and contribute to the sense of political efficacy and authority—in short, as a political act that creates civic standing” (Karpowitz and Mendelberg Reference Karpowitz and Mendelberg2014, 5–6). Understood as a political act, then speakers’ relative amount of floor time can be a useful indicator of social equality.
Equality, of course, may be defined across multiple axes of difference, including class, race, caste, and gender. While each of these merits consideration, in this study, we focus on gender for three reasons: first, there is a significant body of scholarship that suggests that differences in communication styles may limit women’s ability to be heard, to exercise authority, and to shape outcomes in deliberative settings (Karpowitz and Mendelberg Reference Karpowitz and Mendelberg2014). In other words, deliberation as a method of collective decision-making may have a gendered component—and it is of normative importance to understand the extent of such differences, and how they can be overcome. Second, concerns of gender equality are perhaps more acute in contexts such as rural Tamil Nadu, where this study is located. In such settings, women are often deeply disadvantaged across key welfare metrics—from health outcomes to education and labor force participation. For example, female signature literacy in Tamil Nadu is at a mere 64.5% in rural areas according to the 2011 census, with male literacy at 82.4%.Footnote 7 Gaps in labor force participation are even more acute, with rural women employed half as often as rural men (31.8% versus 59.3%).Footnote 8 Given that women enter deliberative fora at a disadvantage, it is important to understand the ways in which gender—as a description of a person’s social identity, as a dimension of style of interaction, as a characteristic of the setting—affects patterns and content of speech. Third, from a practical perspective, gender is a relatively easy marker of social identity to observe and code in deliberative settings; in contrast to class or caste, which may be hard to identify visually, gender differences are immediately perceptible, allowing data collection on whether men or women are speaking at any given moment. We should note that given the disadvantages faced by women, it is possible that women who participate in the gram sabha are more motivated than the average, and in our results we cannot distinguish whether increases in women’s participation are because of equalized opportunity or selection on increased motivation.
Agenda-Setting Power
Second, good deliberation is characterized by citizens “listening attentively” to one another out of mutual respect (Mansbridge Reference Mansbridge, Rao and Heller2015, 43). That is, participants should acknowledge what is said by others—not merely push their own agenda forward. To capture this concept, we examine whether a given citizen is as likely as another to have his issue addressed by the speakers that follow. Consider the following example from Neganur village, whose citizens are complaining about various public goods and infrastructure needs.
Female 1: There are many wells in our village, but the wells are without a pulley wheel. Moreover, since the water is not used for any purpose, it gets wasted. So if you can de-silt the wells, we can not only use the water for drinking purposes but for other purposes also…
Male 1: The kitchen has been constructed in the balwadi [pre-school] in our village. It is not used. Please arrange for the construction of a toilet for women. We also need a play ground for games. The canals are muddy. We have to de-silt the canals. We need a library. All our children are going to school with a dream of becoming IAS and IPS officers. But to get general knowledge, they need books in the library. Our President has not say ‘no’ for any of our requests. With the hope that he will definitely do whatever we have asked, I take leave.
Male (Official): We have a library in our panchayat. We have arranged for five magazines—an English paper, The Hindu and four Tamil magazines. All the elderly persons and children are reading. I am also asking the officers to improve the library and have passed resolution in this regard. We have already de-silted the canal and cleaned it under Mahatma Gandhi Rural Employment guarantee scheme.
Viluppuram District
Vallam Block
Neganur Panchayat
Here, a woman raises a particular issue about well water, but before she is able to get a resolution, a man interrupts to raise a separate set of issues, which then generate a response and resolution from the village official. That a speaker is so obviously ignored by other participants represents a marked departure from good deliberation.
More generally, by examining patterns in the topic of discussion across whole assemblies, we can identify the speakers who are most likely to drive conversation. As the example above highlights, we ought to be particularly concerned about the way in which gender may influence agenda-setting power—a disparity that has been well documented in other contexts (Karpowitz and Mendelberg Reference Karpowitz and Mendelberg2014) and that may be present here as well.
Dialogic responsiveness
Finally, good deliberation enables citizens to be active participants in decisions that affect their lives. This is particularly relevant given the setting studied here, which was explicitly designed so that citizens could play a greater role in local development. As described above, the rural Indian gram sabha was formalized to give communities greater voice in the development process and to improve governmental transparency and accountability. Indeed, most gram sabhas begin with an explicit call for citizen participation; however, the extent to which officials actually respond to citizen requests varies tremendously. In Mullangudi, for example, the village president actively engages with a citizen who requests the construction of new infrastructure—not only exchanging information about potential sources of land for the requested projects but also identifying the affected parties and determining who needs to approve of the proposed solution before making a final decision.
Male 1: My name is Veerapandiayan… A marriage hall is needed for our village, crematorium is needed. Drainage is needed near the tank. Also, pathway is needed for crematorium. Cement road is needed for both streets…. We place these demands before you [the president]. Importantly, community hall is necessary. President, you have to respond.
Male (President): You said that community hall is needed for the village. After selecting the place for this, you should ask the village administrative officer. If you give a memorandum to him he will consider the place needed for that and give consent for the place where it can be built. I will get it built without any hesitation… You have also asked for a marriage hall. There is a plot for it. But there is no poramboke [government] land. There is a poramboke [government] land near the temple. In that place there is a public toilet. We do not need that. All the public are ready to give in writing that [the public toilet] is not needed? Can you get it built there?
Male 1: That is women’s sanitary complex. So I cannot do as you say… The women’s self help groups should say that it is not needed…
Male 2: We will get consent from the women’s association. A toilet facility will come in the marriage hall. Let them use that. There is no problem. That sanitary complex is only lying waste.
Male (President): Your demand is, of course, correct. But to a build marriage hall, that place is not sufficient…
Cuddalore District
Komaratchi Block
Mullangudi Panchayat
By contrast, the citizens of Veeranam receive no response to their concerns about corruption within their local government. Not only does the president fail to respond to citizen’s specific accusation, but the panchayat secretary swiftly punts the issue to the end of the meeting, and redirects the conversation to another issue. Perhaps not surprisingly, the meeting ends before the corruption charge has been addressed.
Male 1: So far, no work has been without bribing anybody.
(Crowd murmurs.)
Male 2: Wait. You answer his question.
Male 1: So far, has our President done any work without getting a bribe?
Male 3 (Secretary): The answer for this question will be given at the end of the meeting. Discussion before gram sabha now regards unused open bore wells in public lands and individual lands…
Tiruvannamalai District
Thandarampet Block
Veeranam Panchayat
These starkly different excerpts suggest meaningful variation in dialogic responsiveness. We should note that this is different from the more general conception of state responsiveness which requires a stronger criterion—when government action or legislation reflects people’s views. Dialogic responsiveness is a limited, earlier stage where the state verbally acknowledges the demands of citizens.
DATA & MEASURES
Data Collection
To evaluate the quality of deliberation in Tamil Nadu’s gram sahbas, we recorded, transcribed, and translated the proceedings of assemblies conducted on Republic Day 2014, one of the four mandated days for all villages in the state to hold a gram sabha. The full sample, which consisted of 100 such assemblies, was collected as part of a broader impact evaluation of the Pudhu Vaazhvu Project, a woman-centered poverty alleviation program funded by the World Bank.Footnote 9 For this paper, we focus only on villages in the control group to describe what deliberation looks like, absent any additional policy interventions. These 50 villages are spread across nine districts, chosen to ensure geographic representation.Footnote 10
From these 50 villages, we collected two forms of data with the assistance of local women, who were trained as field enumerators: (1) full audio recordings of the gram sabha and (2) a standardized questionnaire on the attendance of citizens and local officials, the nature of issues raised, and demographic data on who raised these issues. This survey data also included a roster of state and local government officials in attendance, the physical location of the assembly, and attendance at regular intervals.Footnote 11 (See Appendix A for a full description of the data collection process.)
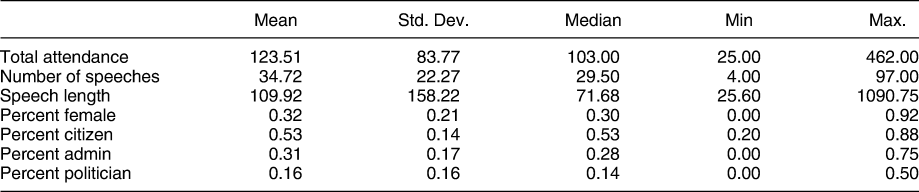
The audio recordings of meetings were transcribed and translated into a corpus of textual data by an independent survey firm. Transcripts included verbatim transcriptions and translations of the assemblies, as well identifiers on the gender and position of each speaker.Footnote 12 These transcripts form the backbone of the following analysis. Each “document” in the corpus consists of an uninterrupted speech. From the 50 village assemblies, we have 1,736 documents; Table 1 presents descriptive information about the number and character of documents within each village. Assemblies have relatively good attendance (with 123 people attending on average) and consist of roughly 34 speeches, of which one third are made by women. Speeches average 100 words in length, but vary considerably from short utterances of 25 words, to lengthy soliloquies of more than 1,000 uninterrupted words. Citizens deliver just over half (54%) of speeches, with the remainder distributed between administrators (29%) and politicians (16%).
Village-Level Summary Statistics

A Text-As-Data Approach to Deliberation
While these descriptive statistics allow us to examine who speaks within the gram sabha, to understand the agenda-setting power of speakers and dialogic responsiveness to citizen issues, we also examine what is said. More specifically, we draw on natural language processing methods that use text-as-data to better understand the content and character of speech. By treating our transcripts as textual data, we can estimate an unsupervised topic model, which is a computational tool to “discover” a set of salient topics within a document collection.
While the complexity of language will never be fully captured by an automated method such as ours, this sort of analysis can help to overcome meaningful challenges in hand-coded analyses of deliberation—including biases due to the researcher’s priors and inconsistencies in coding across various settings. Hand-coding usually begins with a predetermined set of categories into which documents are classified—based on their content, tone, etc. By contrast, the unsupervised approach allows us to learn the underlying features of the text without imposing our own assumptions. Though this is necessarily imperfect and requires ex post validation, it can be useful for identifying previously understudied or theoretically new aspects of speech in these settings, as well as scaling up large volumes of textual data.
Prior to estimating the topic model, we preprocess the set of 1,736 documents such that infrequent words (those with fewer than five occurrences in the corpus) and certain proper nouns, as well as overly common “stopwords” are removed.Footnote 13 Infrequent and proper nouns are often names of beneficiaries, townships, or neighborhoods that are mentioned in meetings, but are not in common usage. The remaining terms are then “stemmed” such that various forms of the same word are counted together.Footnote 14 We also exclude numbers. While preprocessing texts in this manner does have the potential for bias (Denny and Spirling Reference Denny and Spirling2018), we leverage our knowledge of the original language of the transcripts to guide a reasonable set of preprocessing decisions. From the original set of citizen speeches, 1,700 documents remain after processing.
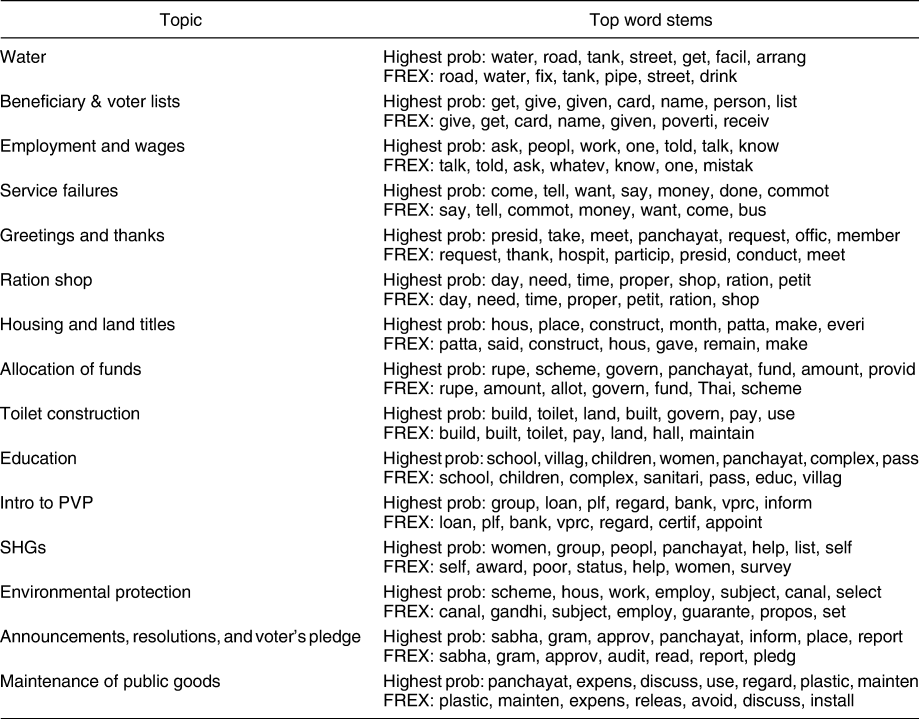
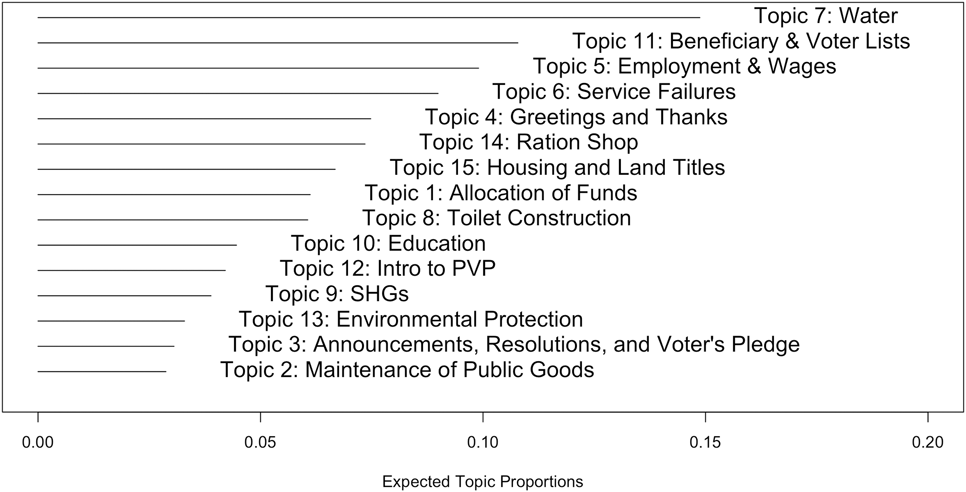
Using this processed corpus, we adopt the approach of Roberts et al. (Reference Roberts, Stewart, Tingley and Airoldi2013) to estimate a Structural Topic Model (STM), which allows us to inductively discover topics, or clusters of words that commonly co-occur within the data. The model outputs (1) a set of topics, which are defined as mixtures of words, where each word has a probability of belonging to each topic, and (2) for each document analyzed, the proportion of the document associated with each topic. As such, each document is characterized by a vector of proportions, representing the share of the document associated with each topics. Using STM, we identify a set of 15 topicsFootnote 15 discussed within the gram sabhas, and explore how these topics vary with the identifiable characteristics of speakers and villages. Specifically, we specify the topic model to include covariates for the gender of the speaker, the position of the speaker, and the reservation status of the village council president (female and/or Scheduled Caste). The generated topics are presented in Table 2, which lists the highest probability words in each topic, as well as the FREX words, which are both frequent and exclusive, thereby identifying the words that distinguish topics.Footnote 16 Figure 1 presents the distribution of these topics across the full corpus.
Top Word Stems by Topic

Distribution of Topics Across Corpus

A key challenge in the text-as-data literature, particularly with unsupervised methods, lies in how to interpret the topics that are produced. Here, we use highest probability and FREX words, as well as example documents associated with each topic, to generate a substantive label for each topic. Appendix B presents the top documents most associated with the two most frequent topics in the corpus.
Topic Validation
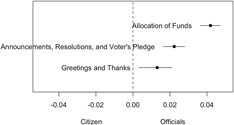
While the topics identified by this method are largely consistent with what we would expect in a gram sabha meeting, we further validate the topics generated in two ways. First, as a test of predictive validity, we examine whether the topics that capture proforma features of the assembly are indeed more likely to be discussed by officials, rather than citizens. More specifically, the topic model identifies a set of standard remarks—such as the reading of resolutions, the formal greetings and votes of thanks, and discussion of government funding allocation—as distinct topics. If these topics capture the rote features of assemblies as they are conducted, these should be primarily spoken by officials, who are responsible for convening and adjourning the meeting, as well as sharing information about the recent public expenditures. Figure 2 plots the difference between the expected proportion of these proforma topics between citizens and officials (both elected and administrative) for the documents in the corpus. As expected, these proforma speeches are all significantly more likely to be raised by officials, suggesting that the topics reflect our substantive interpretation of their content.
Topical Prevalence of Proforma Topics, by Position of Speaker
Note: The figure above plots the expected topic proportion and 95% confidence interval for each proforma topic, by the speaker’s position. Coefficients greater than zero indicate topics that are more frequently raised by officials, while those less than zero indicate topics that are more frequently raised by citizens.

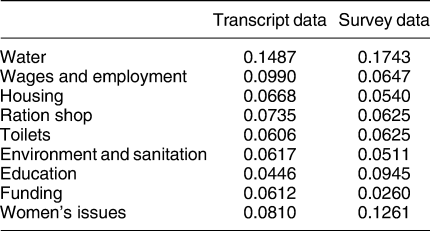
Second, we also validate the topics against the survey data collected by enumerators sent to each village. As part of the data collection process, enumerators were asked to record information on the types of issues raised during the assemblies. We can coarsely examine whether the type and frequency of issues counted in the survey-collected data correspond to their counterparts in transcript data. This comparison, while helpful, is necessarily imperfect for two reasons: First, while the survey-collected data merely count whether an issue was raised within a village assembly, the transcript data shares are calculated based on the proportion of documents associated with that topic. As such, the transcript data will overweight topics that are discussed at length or by many speakers, relative to those that are briefly mentioned. Second, while many topics have clear analogs across the datasets, others are coded differently across the two sources. Given these discrepancies, we find the closest possible analogs, or aggregate where necessary. There are also a handful of topics for which clear analogs are not available. (See Appendix Table B.1 for topic comparisons.) Despite these differences in measurement, however, we can still evaluate whether the relative frequency of specific topics is roughly similar across the two datasets (Table 3). The similar proportions (both in levels and in rank) for topics with ready analogs suggest that our unsupervised methods reflect substantively what hand-coded results would yield.
Validation of Topical Prevalence Using Survey Data

Note: This table presents the relative frequency of topics across both our survey and transcript data. Categories collected in the survey data were post-coded by issue area. For transcript data, documents were coded as a mixture of topics. As such, we take the share of all documents associated with that topic. Direct comparisons across the dataset were not possible for all topics, as there were only a limited set of clear analogs.
PATTERNS OF DELIBERATIVE QUALITY
Having validated the output of the topic model, we can then generate a set of quantitative measures to examine patterns in deliberative quality based on the three metrics identified above—namely, equality of participation, agenda-setting power, and dialogic responsiveness.
Equality of Participation
The most basic measure of equality relates to whether everyone has relatively equitable access to the floor—both in the frequency and in the volume of speech. That is, we can examine counts for the number of speakers with each demographic category of interest (men versus women, citizens versus officials). We also examine the length of speech as a proxy for the amount of floor time that speakers occupy. Given that a key aim of the assembly is to give citizens a chance to voice needs to officials, and for officials to respond, we would expect a healthy sabha to have roughly equal shares of speeches from both groups. Indeed, we find that on average, citizens deliver 55.41% of speeches, while officials deliver the remaining 44.59%. These raw speech shares support the notion that the gram sabha is not merely a state-dominated space, in which officials disseminate information or overtake the space; rather, citizens are able to speak up and engage others in a deliberative fashion.
In terms of gender equity, however, we focus on the speeches made by citizens and find that differences are quite stark—men deliver a full 65% of speeches, while women speak only 35% of the time (Row 1, Table 4). Of course, such a disparity may simply reflect the shares of men and women in attendance; as such we also normalize speech frequency by attendance (Row 2) and population share among voters (Row 3). For these measures, a value of one indicates that women (or men) are speaking as frequently as their population share would suggest, while values greater than one indicate that women (or men) are speaking more frequently than their population share would warrant. Even with these normalizations, however, we see that the gender gap remains wide and significant.
Frequency of Citizen Speeches, by Gender

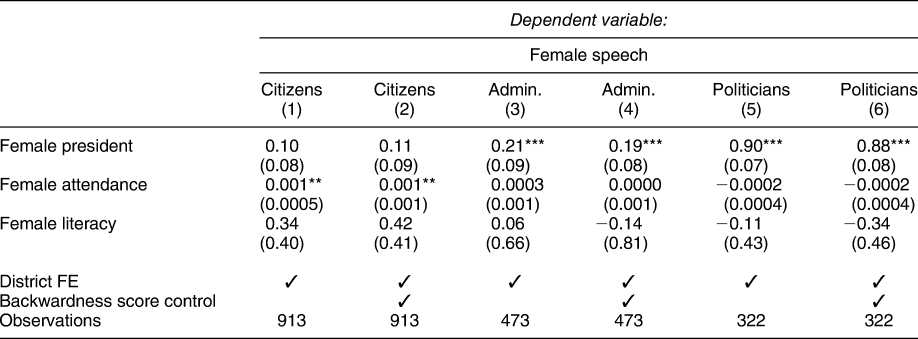
To understand what might be driving the relative infrequency of female speech, we perform a series of multivariate regressions, which allow us to correlate village-level factors with the likelihood of female speech. We focus on three factors that theoretically should improve the frequency of women’s speech: the presence of a female president, the level of female attendance, and the village-level female literacy. Though female attendance and literacy are likely endogenous, we can interpret the effect of a female president causally by using the reservation assignment of the village.Footnote 17 In doing so, we follow a significant body of literature that leverages the as-if-random assignment of gender quotas in Indian local government (Bhavnani Reference Bhavnani2009; Chattopadhyay and Duflo Reference Chattopadhyay and Duflo2004) to determine the effect of the incumbent’s gender on local governance. The specific process for assigning women’s reservations is described in the Tamil Nadu Panchayats Rules of 1995, Section 7.3, Rule 7, which mandates the creation of a “list of Wards or Panchayats arranged in descending order of the percentage of…Women,” and then details the rotation of reservations every 10 years by proceeding down the list. Since the percentage of women in the population is roughly the same across the state’s panchayats, assignment is as-if-random.
Results are presented in Table 5. Models 1, 3, and 5 show that while female citizens speak slightly more often when women attend in greater numbers (a one standard deviation increase in women’s attendance leads to a 7% increase in the probability that a given speech is made a woman), they are not more vocal in the presence of a female president or in more educated villages. Among politicians and administrators, the presence of a female president does positively correlate with female politician speech, likely due to the actions of the president herself.Footnote 18 These results hold even when we control for the overall “backwardness” of the district, using an indexed score that includes demographic and infrastructural variables (Models 2, 4, and 6).Footnote 19
Frequency of Female Speech

Note: *p < 0.1; **p < 0.05; ***p < 0.01. Robust Standard Errors, clustered at the district, in parenthesis. The Backwardness Score is a measure of village-level development, calculating using demographic and infrastructural variables, including the share of population belonging to the Scheduled Castes and Tribes, as well as indicators for the presence of a primary or secondary school, hospital or medical clinic, and bank.
In addition to frequency of speech, we can also examine whether the total floor time occupied by men and women is roughly equal. Given that women speak significantly less often than men, they would have to speak longer per speech to equalize floor time—but consistent with our expectations, they do not. Women on average speak a mere 55 words per speech, where as men average roughly 77 words per speech (Table 6), exacerbating the overall gender gap in floor time within each village. If we compare average male to female floor time (measured by total number of words spoken by each gender), we see that men almost always occupy significantly more floor time than women (Table 7). Notably, while female politicians speak less on average than male politicians, these differences are not statistically significant, suggesting that access to a formal role or position may be important to closing the gender gap in deliberation.
Length of Speeches, by Gender

Assembly Floor Time, by Gender

Agenda-Setting Power
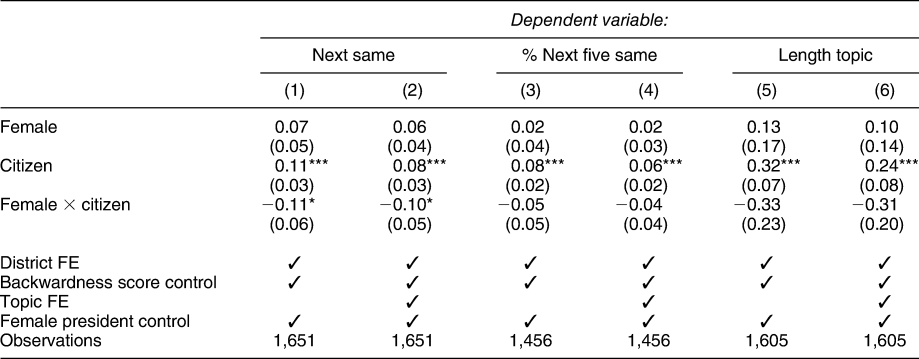
While the frequency and volume of speech are useful indicators of deliberative equality, neither provides a full picture of a speakers’ ability to influence discussion. After all, a long-winded speech may be ignored just as easily as a short one. To that end, we examine the patterns in agenda-setting power. Here, we are specifically concerned with whether there is a disparity between men and women in their ability to redirect conversation toward their own ends. For this, we examine three measures of agenda-setting power—whether a speech is followed by one on the same topic (nextSame), the share of the following five speeches that are on that same topic (prop5same), and the number of uninterrupted speeches that continue to discuss that topic (lengthTopic). The first measure is similar to other measures of topical recurrence in the literature, such as Topic Reiteration from Angus, Smith, and Wiles (Reference Angus, Smith and Wiles2012). The latter two measures are modified forms of Long-term Topic Consistency, also from Angus, Smith, and Wiles (Reference Angus, Smith and Wiles2012); while their long-term recurrence metrics focus on the entirety of the conversation, here, we bound our measures to the next five speeches to reflect the fact that significantly distant comments are unlikely to indicate the influence of a given speaker.
Tables 8–10 present the results. Strikingly, across all measures of agenda-setting power, citizens seem to have a much greater influence on the direction of conversation than do officials (Table 8). When a citizen raises a topic, the probability that the following speech will continue that topic is nearly 7% higher than when officials raise a topic; similarly, citizen speeches are likely to generate conversation for a greater share of the following speeches and for longer uninterrupted stretches. Of course, this may simply be a function of officials’ resolution power, or ability to definitely end subject on a particular matter, thus providing an open avenue for a new subject to be raised. To address this concern, we do two things: First, we include topic fixed effects to make sure that it is not the specific content that is driving the results (Table 10), and second, we limit our sample to only those speeches in which a speaker is raising a new topic, and even then, the patterns generally hold (Table 9).Footnote 20 This suggests that the gram sabha is not merely a state-dominated space, in which officials disseminate information or overtake the space. Rather, citizens are able to raise coherent issues and have others engage in a responsive manner.
Agenda Power by Position (All Speeches)

Agenda Power by Position (New Topics Only)

Agenda Setting Power, by Gender and Position

Note: *p < 0.1; **p < 0.05; ***p < 0.01. Robust Standard Errors, clustered at the district, in parenthesis. The Backwardness Score is a measure of village-level development, calculated using demographic and infrastructural variables, including the share of population belonging to the Scheduled Castes and Tribes, as well as indicators for the presence of a primary or secondary school, hospital or medical clinic, and bank.
Next, we analyze the patterns in agenda-setting power by both position and gender. In Table 10, we show that male citizens are the most likely to set the agenda; They are 10 percentage points more likely than the male politicians (the omitted category) to have the speech following theirs stay on the same topic; given that only 56% of male politician speeches drive the conversation, this is an 18% increase in the agenda-setting power of male citizens—suggesting that the common man is incredibly powerful within the gram sabha. Notably, the dominance of male citizens persists to the inclusion of topic fixed effects, suggesting it is not that men are merely raising particular issues that others care about.
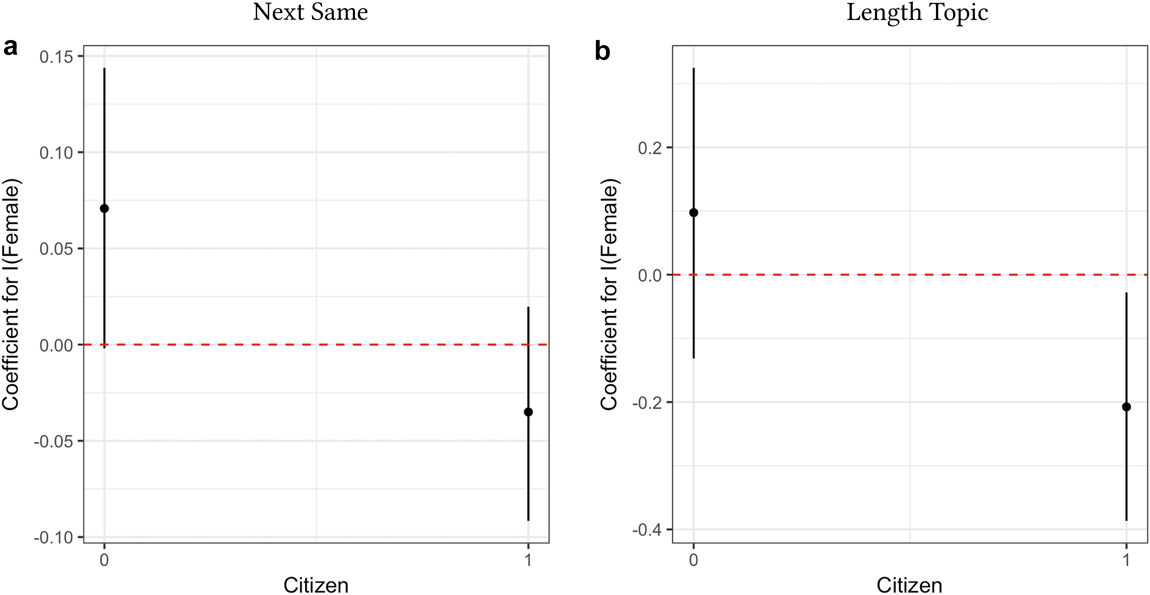
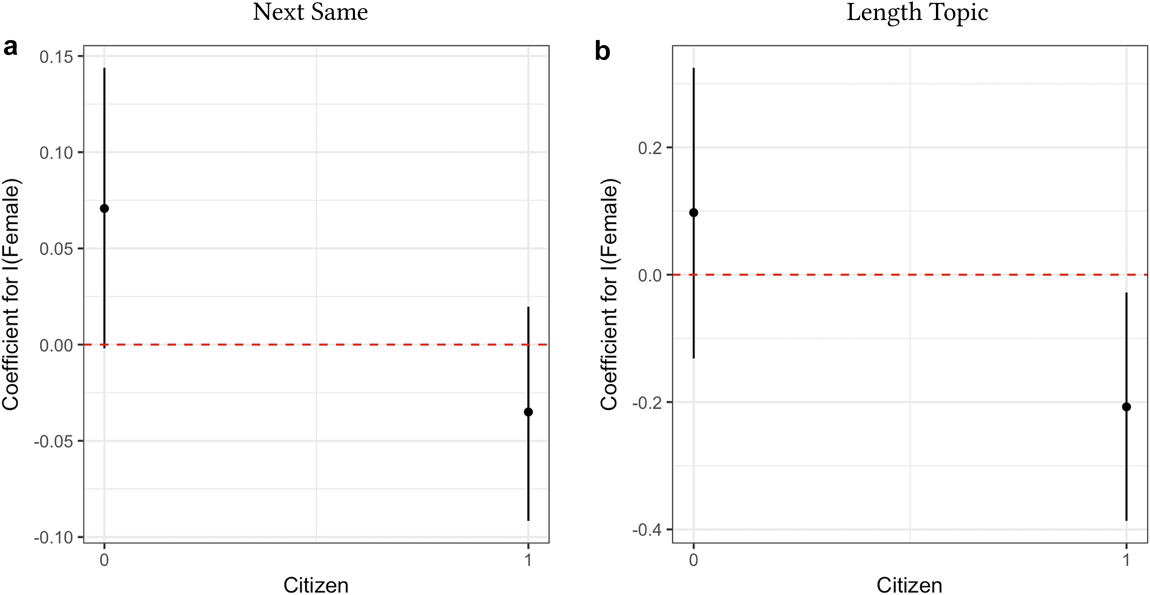
The dynamic for women, however, is markedly different. Though village citizenship confers a relative advantage on men, it tends to disadvantage women. To better understand the ways in which one’s position may condition the effect of gender, we plot the interaction between gender and position in Figure 3. Among politicians, women are slightly more likely to shape the agenda than men (Figure 3a); by contrast, among citizens, women are consistently less likely than men to drive the agenda, and for the length of the topic discussed, these differences are statistically significant at the 0.05 level (Figure 3b).
Agenda-Setting Power by Gender and Position
Note: The figures above plot the interaction between gender and position on agenda-setting power within the gram sabha. The x-axis charts whether speakers are citizens, and the y-axis graphs the coefficient for the effect of being a woman and the 95% confidence interval. The model specification includes controls for village-level demographics and infrastructure, district fixed effects, and topic fixed effects.
Finally, to ensure that these results are robust to alternative specifications of the topic model itself, we rerun the analysis with varying number of topics (K = ∈{20, 30}) and find largely consistent results (presented in Appendix 2C).
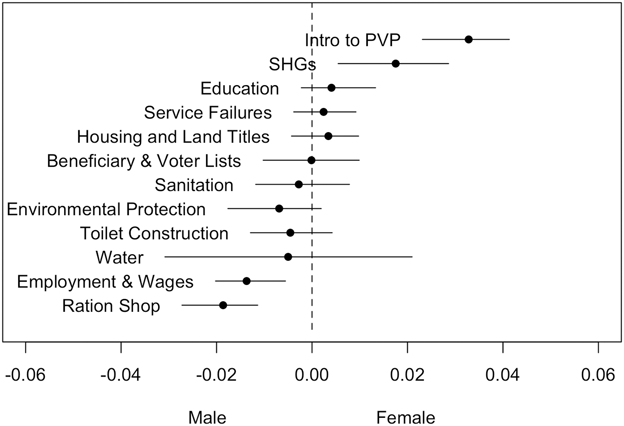
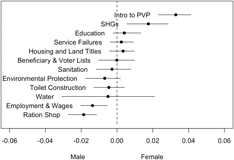
To be fair, disparities in agenda-setting power may be inconsequential from a development perspective if men and women tend to discuss the same issues; however, if there are issues that are disproportionately addressed by women, who are also more likely to get ignored, then we may be particularly worried about development outcomes. To examine whether men and women do in fact overlap or differ in the issues they discuss, we plot the expected difference in topic proportions between male and female citizens, along with the 95% confidence interval, for all nonproforma topics (Figure 4). While we see no significant differences between men and women for the bulk of issues—sanitation, employment, service failures, housing, etc.—we do see stark differences on particularly gendered issues, including self-help groups (women) and the introduction of PVP (which is a women-centered poverty alleviation project). To the extent that female citizens are more likely to be ignored in the gram sabha, then we ought to be concerned that issues that uniquely impact women will be the least likely to be resolved.
Topical Prevalence of Issues, by Gender (Citizens Only)
Note: The figure above plots the expected topic proportion and 95% confidence interval for each issue area, by the speaker’s gender. Data include only citizens speeches. Coefficients greater than zero indicate topics that are more frequently raised by women, while those less than zero indicate topics that are more frequently raised by men.
Dialogic responsiveness
While the ability to drive conversation is a meaningful indicator of one’s influence in a deliberative setting, perhaps more relevant is whether citizens are able to elicit a relevant, verbal response from state actors. That is, when citizens raise an issue to administrators or politicians, how likely are they to get an on-topic response, and does this responsiveness vary by gender?
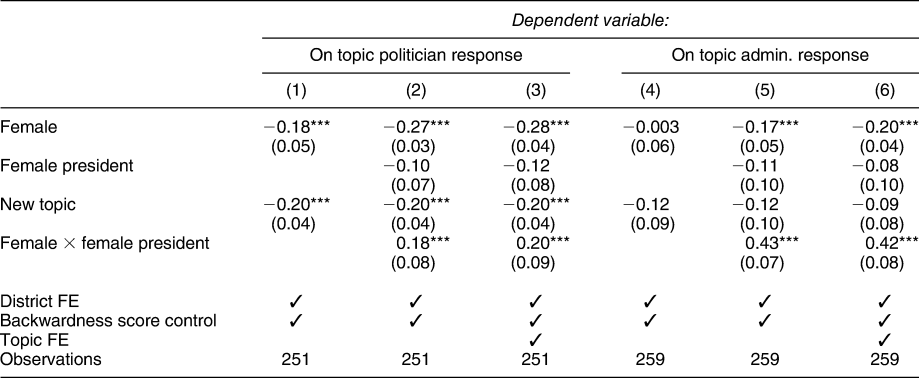
To examine dialogic responsiveness, we generate an indicator variable which takes on a value of one if a citizen’s speech is followed by an administrator or politician and addresses either the primary or secondary topic of that speech. Table 11 examines citizen speeches and presents basic differences in means across the genders both on whether an official responded and on whether that response was on topic. Results are further broken down by the official’s position: administrator or politician. While men and women are equally likely to get a response from officials, men are significantly more likely to get an on-topic response. Interestingly, this difference is driven primarily by politicians; while politicians respond in a relevant manner to male speakers 70% of the time, they only respond to women 49% of the time. By contrast, administrators respond to all citizens on topic about 60% of the time.
Likelihood of Official Response, by Gender

To be fair, these differences may be driven simply by whether the topic raised is new to the discussion—that is, if women are bringing up issues that few other people care about, politicians may be less likely to respond than if the issue were more popular. To address this, we not only control for whether a topic is “new” to the discussion (Table 12, Model 1), but also include topic fixed effects (Table 12, Model 3); unsurprisingly, new topics are 20 percentage points less likely to elicit a response from politicians; however, even when we control for this, women are 18 percentage points less likely than men to receive a response from their elected official.
Official Responsiveness, by Gender

Note: *p < 0.1; **p < 0.05; ***p < 0.01. Robust Standard Errors, clustered at the district, in parenthesis. The Backwardness Score is a measure of village-level development, calculating using demographic and infrastructural variables, including the share of population belonging to the Scheduled Castes and Tribes, as well as indicators for the presence of a primary or secondary school, hospital or medical clinic, and bank.
Effect of Mandated Representation on Deliberative Equality
These patterns suggest that women, and women citizens in particular, are at a considerable disadvantage in the gram sabha. They speak less, are less likely to drive conversation, and are less likely to get a response from government officials. And these disadvantages hold even in sabhas when we control for the issues that are raised. Indeed, it was in recognition of these deeply gendered inequalities that the Government of India proactively designed the panchayat system with quotas for women to serve on the village council and as village president. Here, we leverage the fact that the reservations process, established by the Government of Tamil Nadu (1994), is as-if-random—allowing us to interpret these effects in a causal manner. That is, we can use reservation status to evaluate the effect of a female president on the measures of deliberative equality explored above.
First, we find that the presence of a female president has no discernible impact on the likelihood that female citizens participate within the gram sabha (Table 4, Models 1 and 2), suggesting that the “role model” effects of such incumbents may not be sufficient to affect deliberative participation in the short term. Though these results might seem surprising given the optimism around female quotas, it is quite consistent with evidence from Bengal in Chattopadhyay and Duflo (Reference Chattopadhyay and Duflo2004) and South India in Ban and Rao (Reference Ban and Rao2008a), which find no effect of female reservation on the political behavior of ordinary women.
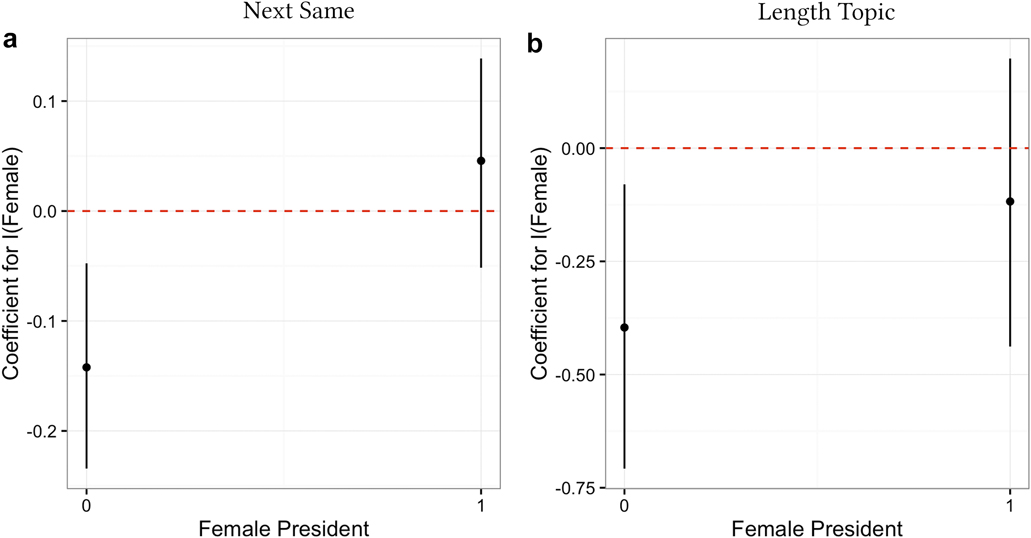
By contrast, we do find that the presence of a female president has a meaningful impact on the ability of women to be heard and responded to.Footnote 21 Focusing only on citizen speakers, we find that though women are at a considerable disadvantage relative to male speakers (roughly 14 percentage points less likely to drive the next issue discussed), this disadvantage is essentially reversed under female presidents (Appendix Table D.1). We visualize the interactions in Figure 5, which plots the coefficient estimates for the effect of being a female speaker under male and female presidents, respectively. While under male presidents, women are significantly less likely than men to set the agenda, under female presidents, differences between the genders are not only smaller in magnitude, but statistically insignificant. Moreover, while women are 18 percentage points less likely than men to receive a relevant response from elected officials—a meaningful decline given that men receive topical responses 70% of the time, female presidents can ameliorate this neglect as well (Table 12).
Agenda-Setting Power by Gender of Speaker and Gender of President
Note: The figures above plot the interaction between speaker’s gender and president’s gender on agenda-setting power within the gram sabha. The x-axis charts whether the president is a woman, and the y-axis graphs the coefficient for the effect of being a woman and the 95% confidence interval. The model specification includes controls for village level demographics and infrastructure, district fixed effects, and topic fixed effects.

DISCUSSION
This paper uses text-as-data methods to study an original corpus of transcripts from a real-world deliberative institution, the rural Indian gram sabha (village assembly), from the state of Tamil Nadu in South India. To our knowledge, it is the first attempt to use these techniques to study citizen participation in a real-world, deliberative body at the local level. We derive measures of deliberative influence—namely, equality of participation, agenda-setting power, and dialogic responsiveness—from recent work in deliberative theory, which has proposed a “minimalist” approach to deliberation that moves away from the strict presumption of equality of previous normative work.
Taken together, our results suggest that we need to pay more attention to the ways in which inequalities among citizens may affect the ability of deliberative democratic institutions to deliver on their promise—to engage citizens in the development process and produce more inclusively development outcomes. We show that these assemblies are not merely empty spaces where state officials bluster and read banal announcements; rather, they provide meaningful forums for citizens to challenge their elected officials, demand transparency, and provide information about very real local development needs—from water and sanitation issues, to wage payments and government service failures.
We also show, however, that among citizens, gender inequalities meaningfully impact citizens’ ability to be heard; across all of our measures of deliberative influence, women are at a considerable disadvantage. They are less likely to be heard, less likely to drive the agenda, and less likely to receive a relevant response from state officials. Indeed, even when we account for the particular issues raised, women still remain at a disadvantage—often ignored while their male peers receive a direct response.
Female 1: In Pattupalli village, so far, there is no fair price shop. They are keeping it in the Women’s Health Building. Women are quarreling. The village people want it built new. There is fight in the panchayat. So people are going to the neighboring village. But the patta [titled] land owners are preventing them from using their land for going to the next village, so resolution should be passed for construction of a ration shop here.
Male 1: For so many years, there is no ration shop here. Only rental shops are here. So long, it was in rented place and now it is kept in Women’s Health Association. Now, women ask for the building and want a fair price shop built. So there is a lot of problem. Please establish for us a ration shop.
Male (President): Regarding this ration shop, we should talk with MLA [Member of the Legislative Assembly] and BDO [Block Development Officer]. The request will be made…
Thiruvallur District
Minjur Block
Sengayam Panchayat
To be fair, one might think the above excerpt is not problematic insofar as the male politician eventually responded to her substantive concern about the ration shop. However, from the perspective of deliberative equality, for women to influence conversation as democratic equals, they should not have to wait for men to elevate their concerns. These patterns reiterate a need to better design deliberative institutions to elevate the voices of women. In fact, our evidence suggests that women’s voices are more likely to be amplified with female presidents—under whom women are more likely to be heard and more likely to receive a state response. In the excerpt below, for example, we see a female president specifically calling out women’s needs and using that as justification for a proposed resolution around liquor shop and ration shop concerns.
Female 1: We need a ration shop for our village. We find it difficult to go up to Devireddikuppam. We have to walk for seven days in a month. We can fit walk such a long distance keeping the rice bag in hands. You have to find a solution for this problem and, at least, arrange a part time ration shop in our village. You take action for removing the liquor shop. We can fit use the road after seven o’clock. Drunken people are giving much trouble and using vulgar words.
Female (President): Women are talking much about the ration shop and liquor shop. We will include these subjects in the resolution…
Tiruvanamalai District
Thandarampet Block
Kolamanjanur Panchayat
That the president explicitly elevates the requests of the women who are talking in her village underscores the notion that descriptive representation can improve the vertical communication between citizen and politician. However, our evidence suggests that this is no panacea for the deeper problem of women’s general silence. While women in Tamil Nadu are more likely to attend the gram sabhas than their male peers, they are significantly less likely to speak—even when a female president sits in power.
Our results are likely to be relevant for much of rural India, since the 73rd amendment to the Indian constitution mandates that gram sabhas be regularly held to serve all 840 million rural Indian residents, and most Indian states have worse measured gendered inequality than Tamil Nadu. They are also likely to be relevant to most of South Asia, which is home to almost a quarter of the world’s population, and where gender inequality is pervasive. Afghanistan, Nepal, Pakistan, and Sri Lanka have all recently enacted legislation to strengthen local governments and increase citizen participation. Our results may also have broader relevance since the gendered nature of participation has been documented in a variety of settings, both in the developed and in the developing world. This is undoubtedly driven by a combination of factors, from information and resource constraints to cultural biases against women (Dreze and Sen Reference Dreze and Sen2002; Inglehart and Norris Reference Inglehart and Norris2003; Paxton, Kunovich, and Hughes Reference Paxton, Kunovich and Hughes2007). But it also underscores a deeper challenge in deliberation—namely, that using one’s voice can be a costly exercise and that imposes it a larger burden on those who are least-advantaged.
SUPPLEMENTARY MATERIAL
To view supplementary material for this article, please visit https://doi.org/10.1017/S0003055419000182.
Replication materials can be found on Dataverse at: https://doi.org/10.7910/DVN/NFZLI3.










Comments
No Comments have been published for this article.