

I. Introduction
In California, grapes rank as the highest-value agricultural crop and the second-highest-value agricultural product after milk and cream. Wine grapes alone comprised roughly $2.1 billion, or 5.9 percent, of the total value of California's farm production in 2010 (California Department of Food and Agriculture, 2011), with a further $0.9 billion from table grapes, raisin grapes, and grapes crushed for other uses. California produced 86 percent of the volume and value of U.S. wine grapes in 2010 (National Agricultural Statistics Service, 2011). Measures of demand response to economic factors, in particular price and income elasticities, are often used in policy analysis. However, very few studies have estimated elasticities of demand for wine produced in California and, to our knowledge, no one has published estimates of elasticities of demand for California wine grapes. To address this deficiency, this article reports the results from using two complementary approaches to estimate elasticities of demand for three quality categories of California wine grapes.
The article is organized as follows. Section 2 discusses some conceptual issues and practical considerations. Section 3 discusses methods of obtaining “guesstimates” of elasticities using a combination of published estimates of related parameters, data on market shares, economic theory, and assumptions about key relationships. Section 4 reviews the theory on specification and estimation of inverse demand system models. Section 5 gives an overview of the chosen model, which nests several others that can be obtained by imposing restrictions on some of the parameters. Section 6 presents econometric results using this flexible demand system, discusses the challenges of that estimation process, and presents estimates of flexibilities and elasticities derived from the preferred set of estimates. Section 7 compares these to the “synthetic” estimates and discusses both sets of results, and Section 8 concludes the article.
II. Conceptual Issues and Practical Considerations
Several aspects of the demand for California wine grapes are pertinent when deciding how to go about estimating elasticities that will be useful for policy analysis and interpreting the results from estimation. These aspects influenced our primary modeling decisions.
First, given the recursive structure of supply and demand in the industry, it is appropriate to estimate an inverse demand model, in which price is a function of quantity demanded.
Second, the demand for California wine grapes is not final consumer demand but, rather, a derived demand for a factor of production used in winemaking. Consequently, most of the available estimates of elasticities of demand for wine cannot be compared directly to estimates of elasticities of demand for wine grapes because factor demand and consumer demand differ in some important ways.
Third, wine is a traded good and, consequently, the demand for wine made from California wine grapes (and thus the demand for California wine grapes) is effectively a residual demand, which is influenced by global supply and demand conditions, making the relevant demands much more elastic than they would be otherwise. We explicitly address this aspect of the demand both in deriving synthetic estimates of elasticities and in interpreting our econometric estimates.
Fourth, and finally, wine is a highly differentiated product, and California produces correspondingly differentiated wine grapes across a diverse range of agroecologies to supply a range of market outlets. Reflecting this diversity, the California Department of Food and Agriculture (CDFA) collects detailed data at the level of the crush district, of which California has 17. Both yield and price (as well as varieties grown, which often influence yield and price) vary markedly among California's diverse production regions. In general, in the Napa and Sonoma Valleys, vineyards produce a low number of tons per acre under carefully managed conditions. In the Central Valley, especially in the southernmost part of that region, production styles are different from Napa and Sonoma: yields are much higher, prices per ton are much lower, and much more bulk production takes place.Footnote 1 The rest of the state, which includes the Central Coast, Mendocino and Lake Counties, the Sierra Foothills, and southern California, produces a range of wine grapes that fall between these two extremes in terms of price and yield.
In models of demand systems, the number of parameters to be estimated increases quickly as the number of goods in the system increases, causing a loss of degrees of freedom and a corresponding increase in the odds of finding statistically insignificant or economically implausible estimates. For the purposes of this analysis, we aggregated the 17 crush districts into three regions that we defined as High, Medium, and Low based on their average wine grape prices. This is a small enough system to be manageable econometrically while at the same time distinguishing among the main distinct subcategories of wine grapes. The regions are defined in Table 1, which also presents regional statistics on production, acreage, price, and yield.
California Wine Grape Growing Regions: Definitions and Sample Statistics

Note: The high-price region is made up of crush districts 3 and 4; the medium-price region is made up of crush districts 1, 2, 5–11, and, 15–17; the low-price region is made up of crush districts 12–14.
III. “Synthetic” Estimation of Elasticities of Demand
Elasticities of the derived, residual demand for wine grapes can be estimated using economic theory together with published estimates of related parameters and some educated guesswork. This type of approach is commonly used to define elasticities used in calibrated simulation models and may be the only option if suitable data are not available for econometric analysis. In this section, we calculate matrices of compensated and uncompensated elasticities of demand for California wine grapes using published estimates of elasticities of demand for wine combined with data on market shares and informed assumptions about other key parameters. Later, we compare these estimates with those made using econometric methods.
Fogarty (Reference Fogarty2010) conducted a meta-analysis of the worldwide literature on demand for alcohol. He reported estimates of the own-price elasticities of demand for beer, wine, and spirits from 141 studies. These studies reported 177 estimates of own-price elasticities of demand for wine, 31 of which refer to the United States.Footnote 2 The estimates of the uncompensated own-price elasticity range from −1.86 to −0.18. However, Fogarty (Reference Fogarty2010) reported estimates of elasticities of demand for wine, a finished product, which is different from wine grapes, an input. We use estimates reported by Fogarty (Reference Fogarty2010) with other information to derive estimates of elasticities of the demand for California wine grapes.
A. “Synthetic” Estimation of the Elasticity of Demand for Wine Grapes
This initial analysis treats wine as a homogeneous product and abstracts from transport costs and trade barriers such that prices are equal everywhere (adjustments for differentiated products and incomplete price transmission are introduced subsequently). The (residual) demand for California wine (D C) is equal to the total demand for wine (D W), less the supply from the rest of the world (S R).
 $$D_C = D_W - S_R. $$
Differentiating with respect to P, and then multiplying by P/D C gives the following.
 $$\displaystyle{{\partial D_C} \over {\partial P}}\displaystyle{P \over {D_C}} = \displaystyle{{\partial D_W} \over {\partial P}}\displaystyle{P \over {D_C}} - \displaystyle{{\partial S_R} \over {\partial P}}\displaystyle{P \over {D_C}}. $$
The left-hand-side term is equal to the own-price elasticity of demand for California wine. Multiplying the first term on the right-hand side by D W/D W and the second term by S R/S R and rewriting in terms of elasticities yields
 $$\eta _C = \eta _W \left( {\displaystyle{1 \over {W_C}}} \right) - \varepsilon _R \left( {\displaystyle{1 \over {1 - w_C}}} \right).$$
In Equation (3), the own-price elasticity of demand for California wine, η C, is equal to the elasticity of demand for wine from all sources, η W, divided by the quantity (or value) share of California wine, w C, less the elasticity of supply of wine from the rest of the world, ε R, divided by 1 minus the quantity (or value) share of California wine (which, in turn, is equal to the quantity or value share of wine from the rest of the world).
The average of all the uncompensated own-price elasticities of demand for wine reported in Fogarty (Reference Fogarty2010) is −0.8, and we use this value as an estimate of η W. The quantity share of wine produced by California wineries as a proportion of total world production, averaged over the previous four years for which data were available, is 0.08 (Wine Institute, Reference Institute2010a, Reference Institute2010b). Useful estimates of the elasticity of supply for the rest of the world were not available, so the calculation was made using a range of values for this parameter that can be interpreted as encompassing a range from very short- to relatively long-run supply response: 0.0, 0.5, and 1.0. The results were not very sensitive to this parameter, so we report estimates in Table 2 using only the intermediate value of 0.5. Table 2 gives the resulting estimate of η C = − 10.5 in the first row, which is comparatively large, in part because it is based on an extreme assumption of perfect price transmission.
Elasticities of Demand for California Wine (η C) and California Wine Grapes (η G) Implied by Alternative Elasticities of Supply and Price Transmission

In reality price transmission is not complete between California and other countries and regions, reflecting the effect of transport costs, trade barriers, or other market realities, including the fact that wine is a highly differentiated product and wines from elsewhere may be imperfect substitutes for California wine. Setting aside product differentiation, certain countries might not participate in the international market for wine at all, in which case their relevant elasticity of price transmission is 0. Other countries play an important role in the market, but price changes are still not transmitted perfectly between those countries and California, so the elasticity of price transmission would be positive, but less than 1.0.Footnote 3
A generalization of Equation (3) to accommodate imperfect price transmission would allow for each country-specific supply elasticity and each country-specific demand elasticity to be weighted by its respective country-specific elasticity of price transmission with California.Footnote 4 A special case of that more-general equation applies if the demand elasticities as well as the supply elasticities are equal across countries and if the elasticities of price transmission with California are equal across all pairs of countries. In this case, the effect of allowing for imperfect price transmission is simply to scale down the elasticity of demand for California wine as follows, where E C is the elasticity of price transmission for California wine (which can be estimated as a share-weighted average of the country-specific elasticities of price transmission, if the assumption of equal elasticities of price transmission is used as an approximation).
 $$\eta _C = E_C \left( {\eta _W \left( {\displaystyle{1 \over {s_C}}} \right) - \varepsilon_{R} \left( {\displaystyle{1 \over {1 - w_C}}} \right)} \right).$$
The elasticity of demand for California wine, computed using a value of 1.0 for the elasticity of price transmission is shown in the first block of entries in Table 2 as −10.5. The second and third blocks of entries refer to estimates using elasticities of price transmission of 0.50 and 0.25. Comparing the first, fourth, and seventh rows of Table 2, reducing the elasticity of price transmission scales down the elasticity of demand in proportion, as implied by Equation (4).
The subject of this study is the demand for California wine grapes, which is derived from the demand for California wine. The demand for California wine is equal to the horizontal (algebraic) difference between the total global demand for wine from all sources and supply from the rest of the world (ROW), as shown in Equation (1). The demand for California wine grapes is derived from the demand for California wine in conjunction with technology of winemaking and the supply of winemaking inputs. The demand for wine grapes can then be further decomposed into interdependent demands for wine grapes by quality category.
We can use estimates of the elasticity of demand for California wine in the equation for elasticity of demand for a factor of production (see Muth [1964]) to derive the elasticity of demand for California wine grapes. In Equations (5) and (6), η G is the uncompensated own-price elasticity of demand for wine grapes used in winemaking, w G is the cost share of wine grapes, ε O is the elasticity of supply of other (winemaking) inputs, and σ is the elasticity of substitution between wine grapes and other inputs in winemaking (Muth [Reference Muth1964] provides a derivation of this equation).
 $$\eta _G = \displaystyle{{\eta _C \sigma - (w_O \sigma - w_G \eta _C )\varepsilon _O} \over {w_G \sigma - w_O \eta _C + \varepsilon _O}}. $$
Assuming fixed proportions between wine grapes and all other inputs in winemaking, that is, σ = 0, Equation (5) simplifies to
 $$\eta _G = \displaystyle{{w_G \eta _C \varepsilon _O} \over {\varepsilon _O - w_O \eta _C}}. $$
The cost share of wine grapes in wholesale wine (w G) was calculated using data on wine prices in the Gomberg-Fredrikson Report (1980–2011) and data on wine grape prices from California Department of Food and Agriculture Crush Reports (California Department of Food and Agriculture/National Agricultural Statistics Service, 1985–2011), assuming that 67 cases of wine can be produced per ton of grapes crushed (Smith, Reference Smith2011). The average cost share for the years examined is 0.41.Footnote 5 This estimate of w G = 0.41 was used in Equation (6), along with the estimates of the elasticity of demand for California wine (η C) in Table 2 and alternative assumed values of the elasticity of supply of other winemaking inputs ε O = 1.0 or ∞, to compute the corresponding elasticities of demand for California wine grapes that are reported in Table 2. The consequent estimates of the own-price elasticity of demand for California wine grapes range from −0.4 (representing a very short-run elasticity with a fixed ROW supply, 25 percent price transmission, and an elasticity of supply of other winemaking inputs of 1.0) to −4.5 (a relatively long-run elasticity based on a fairly elastic ROW supply, 100 percent price transmission, and a perfectly elastic supply of other winemaking inputs).
B. Elasticity of Demand for Quality-Differentiated Wine Grapes
We can derive elasticities of demand for specific wine grape categories by using a variant of the Slutsky equation, written to allow for imperfect substitution among wine grapes from different regions—High, Medium, and Low quality, as defined in Table 1—within the total market for California wine grapes. Equations (7) and (8) represent the Marshallian (or uncompensated) measures of the own-price elasticity of demand for grapes from region i (η ii) and the cross-price elasticity of demand for grapes from region i with respect to price of grapes from region j (η ij). Equations (9) and (10) represent their Hicksian (or compensated) counterparts.Footnote 6
 $$\eta _{ii} = - (1 - w_i )\sigma _{ij} + w_i \eta _G $$
 $$\eta _{ij} = w_j (\sigma _{ij} + \eta _G ) \ {\rm for} \ j \ne I$$
 $$\eta _{ii}^{*} = - (1 - w_i )\sigma _{ij} $$
 $$\eta _{ij}^{*} = w_j \sigma _{ij} \ {\rm for} \ j \ne i$$
Here σ ij is the elasticity of substitution in winemaking between grapes from different regions-cum-quality categories, which is assumed to be constant across all pairs, for which three alternative values are tried: 3, 5, and 10.Footnote 7 The expenditure share from region i (w i) was calculated by computing the five-year average (2006–2010) of the total wine grape revenue of the region and then dividing by the five-year average of the revenue summed across regions.
Table 3 reports the calculated elasticities of demand for wine grapes by quality-region using the formulas in Equation (7) (the Marshallian own-price elasticity of demand for wine grapes from region i) and Equation (8) (the Marshallian cross-price elasticity of demand for wine grapes from region j with respect to the price of wine grapes from region i). Using an elasticity of substitution between wine grape categories (σ ij) of 5.0 and an elasticity of demand for aggregated wine grapes (η G) of −2.2 (consistent with E C=ε R = 0.5), the own-price elasticities of demand for Low-, Medium-, and High-price wine grapes are −4.5, −3.8, and −3.9, respectively. The results, as would be expected, are fairly sensitive to the value of σ ij, as can be seen by comparing estimates across columns in Table 3. The results are less sensitive to changes in the estimated elasticity of demand for wine grapes, η G, as can be seen by comparing estimates within a column of Table 3.
“Synthetic” Uncompensated Elasticities of Demand for Low-, Medium-, and High-Price Wine Grapes based on Alternative Values of the Aggregate Elasticity of Demand (η G)

IV. Theory and Structural Models
We chose to estimate an inverse demand system, for reasons discussed at the beginning of the article. Many commonly used direct demand models, such as the Almost Ideal Demand System (AIDS), Rotterdam, Rotterdam-AIDS (RAIDS), and (Netherlands) Central Bureau of Statistics (CBS), have been reworked as inverse models, with varying degrees of success. In developing our model, we drew on several papers published in the late 1970s and early 1980s that address the estimation of inverse demand systems, especially Anderson (Reference Anderson1980) and Deaton (Reference Deaton1979).
To arrive at a reduced-form model, we follow Brown, Lee, and Seale (Reference Brown, Lee and Seale1995) by first assuming weak separability and then using a primal approach and consumer utility theory to derive an inverse system of Marshallian demands. Wine grapes are rarely purchased directly by consumers, but, while interpretations of consumer and producer theory differ, the theory for deriving and estimating demand systems for both inputs and final products is the same (Brown et al., Reference Brown, Lee and Seale1995; Theil, Reference Theil1980). Thus we can usefully begin by discussing the derivation of an inverse demand system for consumer demand, which has been developed elsewhere and is more familiar than the producer demand for factors of production.
A. Consumer Theory
If p i and q i represent, respectively, the price and quantity for good i, and x represents the budget, the consumer's utility maximization problem can be written as follows.
 $${\rm max} \ u(q_1, q_2, \ldots, q_N ),{\rm subject \ to} \sum\limits_{i = 1}^N {\,p_i q_i = x.} $$
The first-order conditions for this maximization problem are the budget constraint and
 $$\displaystyle{{\partial u} \over {\partial q_i}} = \lambda p_i, $$
where λ is the marginal utility of income, ∂u/∂x. The uncompensated inverse demand equations can then be derived using the Hotelling-Wold identity.
 $$\pi _i = {{\displaystyle{{\partial u} \over {\partial q_i}}} \left / \vskip 8pt\right . {\sum\limits_j {\left( {\displaystyle{{\partial u} \over {\partial q_j}}} \right)} q_j,}} $$
where π i is price normalized by total expenditure, x.
A distance function can be used to obtain compensated demands. This function, D(u,q), defined for utility u, and quantity vector q, is presented in Deaton (Reference Deaton1979) and defines the amount by which q must be scaled to bring it to the u indifference curve. Therefore, by differentiating this function, the (price-dependent) demand equation can be defined with price as a function of quantity and utility (Deaton, Reference Deaton1979; Eales and Unnevehr, Reference Eales and Unneveher1994).
 $$\displaystyle{{\partial D(u,q)} \over {\partial q_i}} = \pi _i (u,q).$
Anderson (1980) shows several results that must hold for inverse demands, in which f ij and f ij* are the uncompensated (or Marshallian) and compensated (or Hicksian) flexibilities, respectively, and f ijQ is the scale flexibility. First, compensated flexibilities must sum to 0 within an equation.
 $$\sum\limits_j {\,f_{ij} ^* = 0.} $$
Second, the matrix of compensated flexibilities (also known as the Antonelli matrix, the analog to the Slutsky matrix of a direct demand system) must be negative semidefinite.Footnote 8 Third, the scale flexibility for each good must be equal to the sum of the uncompensated flexibilities in its equation (this is the homogeneity condition).
 $$\sum\limits_j {\,f_{ij} = f_i ^Q.} $$
Fourth, the sum of the uncompensated cross-quantity flexibilities for good i with respect to good j multiplied by the corresponding shares should be equal to the negative of the share of good j (this is the analog to Cournot aggregation of direct demand).
 $$\sum\limits_i {\,f_{ij} w_i = - w_j.} $$
We also add to Anderson's list the restriction that the share-weighted scale flexibilities must sum to 1, which is derived as a linear combination of the third and fourth conditions, above.
 $$\sum\limits_i {w_i f_i ^Q = 1.} $$
V. Functional Form of the Econometric Model
The model we have chosen for econometric application follows that of Barten (Reference Barten1993), who designed a flexible demand system that nests (by alternative sets of parametric restrictions) the Inverse Almost Ideal Demand System (IAIDS), the Inverse Rotterdam, and systems with elements of both the Inverse Rotterdam and the IAIDS; these two hybrid systems are known as the Inverse RAIDS or IRAIDS (attributed to Neves [Reference Neves1987] and also known as the Inverse NBER where NBER stands for National Bureau of Economic Research), and the Inverse CBS (attributed to Keller and Van Driel [Reference Keller and Van Driel1985] and also known as the Laitenen-Theil). The unrestricted form of the model includes all of the above as special cases and thus contains elements of all of them. Of note is the differential form of this model, which addresses many issues inherent in time-series data analysis, such as nonstationarity.
Brown, Lee, and Seale (Reference Brown, Lee and Seale1995) and Eales, Wessells, and Durham (Reference Eales, Durham and Wessells1997) presented versions of flexible models of inverse demand and the associated theory and used these models to estimate systems of demand for wholesale oranges and fish, respectively. We will not go into the detail that is provided in these papers, showing how the models are built and how the restrictions function. Instead, what follows is a brief overview, starting with the typical equation to be estimated (see Appendix B for technical notes). For the purposes of this article, we use notation from Brown, Lee, and Seale (Reference Brown, Lee and Seale1995), but note that Eales, Wessells, and Durham (Reference Eales, Durham and Wessells1997) used an equivalent (transformed) specification.Footnote 9 Following Brown, Lee, and Seale (Reference Brown, Lee and Seale1995), we refer to this model as the BLS model.
The typical equation of the model estimated is:
 $$w_i d\ln \pi _i = (e_i - r_1 w_i )d\ln Q + \sum\limits_j {(e_{ij} - r_2 w_i (\delta _{ij} - w_j ))} d\ln q_j, $$
where w i is the budget share of good i, 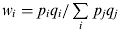 $w_i = p_i q_i /\sum\limits_i {\,p_j q_j} $, Q is Stone's quantity index,
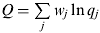 $Q = \sum\limits_j {w_j \ln q_j} $, δ ij is the Kronecker delta (if i = j, δij = 1, and if i ≠j, δij = 0) and r 1 and r 2 are parameters that can be restricted to define the nested special cases. Specifically: r 1=r 2 = 0 yields the Inverse Rotterdam model; r 1=r 2 = 1 yields the IAIDS model; r 1 = 1, r 2 = 0 yields the Inverse CBS model; r 1 = 0, r 2 = 1 yields the Inverse NBER model.Footnote 10 Note that the “unrestricted” model in fact restricts r 1 and r 2, respectively, to be equal across equations, but they can take any value so long as that condition is met.
Within models the following restrictions implied by economic theory can be imposed or tested (Brown et al., Reference Brown, Lee and Seale1995).
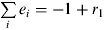
• Adding-up requires that
 $\sum\limits_i {e_i = - 1 + r_1} $ and $\sum\limits_i {e_{ij} = 0.} $
• Homogeneity requires that
$\sum\limits_j {e_{ij}} = 0,$• Symmetry implies that
$e_{ij} = e_{\,ji}. $


Scale flexibilities, introduced explicitly by Anderson and Wilkinson (Reference Anderson and Wilkinson1979) but used implicitly by Laitenen and Theil (Reference Laitinen and Theil1979) and Salvas-Bronsard, Leblanc, and Bronsard (Reference Salvas-Bronsard, Leblanc and Bronsard1977), measure how prices change in response to changes in total quantity consumed, represented as a (geometric) share-weighted average of quantities of individual goods involved in the model (we use Stone's quantity index here). Equation (20) can be used to compute the scale flexibilities while Equation (21) can be used to compute the compensated price flexibilities corresponding to the model in Equation (19).
 $$\displaystyle{{\partial \ln \pi _i} \over {\partial \ln Q}} = f_i ^Q = \displaystyle{{e_i} \over {w_i}} - r_1 $$
 $$\displaystyle{{\partial \ln \pi_{i}} \over {\partial \ln q_j}} = f_{ij}^{*} = \displaystyle{{e_{ij}} \over {w_i}} - r_2 (\delta _{ij} - w_j )$$
Uncompensated price flexibilities can be computed using Equation (22), which is attributed to Anderson (Reference Anderson1980), as a linear combination of the corresponding scale and compensated price flexibilities.
 $$f_{ij} = f_{ij}^{ *} + w_j f_i ^Q. $$
VI. Econometric Estimation
In moving from the theoretical model to empirical estimation, we incorporate an error term, u, in the typical equation, and we assume that its distribution has the usual desired statistical properties. In addition, because our data are discrete annual observations, we replace the continuous differentials in Equation (19) with their discrete counterparts.
 $$\bar w_i \Delta \ln \pi _i = (e_i - r_1 \bar w_i )\Delta \ln Q + \sum\limits_j {\left( {e_{ij} - r_2 \bar w_i \left( {\delta _{ij} - \bar w_j} \right)} \right)} \Delta \ln q_j + u,$$
where Δ is the first-difference operator. Note also that the shares, w i, are replaced with the moving average of the shares in the current and previous year.
Inverse demand system models of the form of Equation (23) were estimated for three quality-cum-regional categories of wine grapes defined in Table 1. The models were estimated using annual data on prices and quantities of California wine grapes taken from the annual NASS/CDFA Crush Reports (National Agricultural Statistics Service/California Department of Food and Agriculture) for the years 1985–2009. Table 1 shows summary statistics (see Appendix A for the full data set).
The unrestricted model was estimated using iterated seemingly unrelated regressions (ITSUR) in STATA, first dropping the “Medium” equation and then the “Low” equation, both as a check on the results and also as an easier way to obtain estimates of standard errors.Footnote 11 Homogeneity of degree zero in individual quantities was imposed in each equation, and Slutsky symmetry was imposed across equations. The Wald test failed to reject the restrictions for the Inverse AIDS and Inverse CBS/Laitenen-Theil models. However, the unrestricted model provides the most sensible estimates of elasticities (some of the restricted model forms implied positive own-price elasticities) so the results from the unrestricted model are preferred and are emphasized in the discussion that follows.
Results
Table 4 shows the regression results for the unrestricted model. In such a model, the point estimates of the individual coefficients are not straightforward to interpret. Table 5 shows uncompensated flexibilities, computed using the sample means of shares, w i, along with estimated coefficients from the fully synthetic (unrestricted) model. Table 5 also presents the corresponding standard errors, computed using linear combinations of elements of the covariance matrix of the estimated parameters. We also computed standard errors by bootstrapping, using 1,000 replications. Both sets of standard errors are included in Table 5.
Regression Results for Unrestricted Model, Annual Data, 1985–2009

Notes: ***, **, * Significant at the 1%, 5%, and 10% levels. Standard errors in parentheses.
Econometrically Estimated Marshallian Quantity and Scale Flexibilities from Unrestricted Model, Annual Data, 1985–2009

Notes: This table reports flexibilities of demand for wine grapes from region i (in row) with respect to price of wine grapes from region j or the total quantity of wine grapes (in column). ***, **, * Significant at the 1%, 5%, and 10% levels, respectively, using bootstrapped standard errors. Standard errors computed using linear combinations of estimates are in parentheses. Standard errors computed by bootstrap using 1,000 replications are in square brackets.
The uncompensated flexibilities implied by this preferred model are all substantially less than one, suggesting that demand for wine grapes is generally fairly inflexible. For example, the estimates indicate that a 1 percent increase in the quantity of “high-price” wine grapes would bring about a 0.36 percent decrease in the price of the same category of wine grapes. The own-quantity flexibilities of demand for medium- and low-price wine grapes are both greater in magnitude than those of the high-price grapes, at −0.51 and −0.57, respectively. These results imply that the demands are all fairly elastic, but that the demand for high-price grapes is more elastic than the demands for Medium- and Low-price grapes.Footnote 12
The scale flexibilities are all near −1, being of greater magnitude for the “Low” category than the other categories, suggesting that demand for low-price wine grapes is less responsive (i.e., prices are more flexible), in response to the scale of consumption compared with high- and medium-price wine grapes. For example, the estimates imply that a 1 percent increase in the total quantity of wine grapes would bring about decreases in price of 0.90 percent for High-quality wine grapes and 1.24 percent for Low-quality wine grapes. The corresponding compensated flexibilities are small and, in all cases, statistically insignificant using either standard errors computed by linear combination or bootstrapped estimates.
Anderson (Reference Anderson1980) shows that the matrix of uncompensated flexibilities can be inverted to provide estimates of uncompensated elasticities. Table 6 shows the uncompensated elasticities estimated using this method. The demands for all three categories are fairly elastic. The own-price elasticity of demand for High-quality wine grapes (i.e., grapes from Napa and Sonoma) is fairly high, at −9.5. The demands for medium- or low-quality wine grapes are less elastic, with own-price elasticities of −5.2 percent and −2.6, respectively.Footnote 13
Econometrically Estimated Marshallian Price and Expenditure Elasticities from Unrestricted Model, Annual Data, 1985–2009

Notes: This table reports elasticities of demand for wine grapes from region i (in row) with respect to price of wine grapes from region j or the total quantity of wine grapes (in column). Uncompensated elasticity estimates were computed by inverting uncompensated flexibility estimates given in Table 5.
“Expenditure” elasticities (i.e., elasticities of demand for wine grapes from a particular region with respect to total expenditure on California wine grapes) were computed using Wold and Juréen's (Reference Wold and Juréen1955) result: the sum of the own- and cross-price elasticities for a given category must be equal to the negative of the expenditure elasticity. These elasticities are included along with the uncompensated price elasticities in Table 6. The expenditure elasticity is much greater for high-quality than for low-quality wine grapes. For example, the estimates imply that a 1 percent <or one-percentage-point?> increase in expenditure on California wine grapes would yield a 2.0 percent <or two-percentage-point? > increase in the quantity of high-quality wine grapes purchased. For that same 1 percent <or one-percentage-point?> increase, the estimates imply increases of 0.7 percent < age-point?> in the quantity of medium-quality wine grapes and 0.1 percent < age-point?> in the quantity of low-quality wine grapes.
Compensated elasticities and elasticities of substitution can also be derived from the econometric results, using the elasticity form of the Slutsky equation.
 $$\eta _{ij}^{*} = \eta _{ij} + w_j \eta _{iX}, $$
where η ij is the uncompensated price elasticity of demand, η ij* is the compensated price elasticity of demand, w j is the expenditure share for good j averaged annually over 1985–2009, and η iX is the elasticity of demand for wine grapes of type i with respect to total expenditure on wine grapes. Likewise, elasticities of substitution can be computed using
 $$\sigma _{ij} = \eta _{ij} ^{*}/w_j. $$
VII. Comparisons to “Synthetic” Estimation Approach
Table 7 compares the synthetic and econometric estimates of the uncompensated price elasticities, the compensated price elasticities, and the elasticities of substitution. Columns (1), (2), and (3) present the synthetic estimates of the Marshallian elasticities computed using elasticities of substitution of σ ij = 3, 5, or 10 and an elasticity of aggregate demand for California wine grapes of η G = –2.2, taken from Table 3.Footnote 14 Column (4) presents the econometric estimates of the Marshallian elasticities, taken from Table 6, and the corresponding elasticities of substitution computed using Equation (25) are presented in column (5).
Econometric and “Synthetic” Estimates of Elasticities of Demand for Wine Grapes

Notes: L = low-price wine grapes; M = medium-price wine grapes; and H = high-price wine grapes. Expenditure shares, w i, are averaged over all years in the sample, 1985–2009, and are approximately 0.3, 0.4, and 0.3 for Low, Medium, and High, respectively. Synthetic estimates were computed using η G = − 2.2.
Several points are clear from the comparison. First, reflecting our assumptions, the synthetic estimates of cross-price elasticities are all positive numbers whereas some of the econometric estimates are negative numbers, indicating complementary relationships—though small values relative to the negative own-price and positive cross-price effects. Although cross-price elasticities are of some interest, analysts are typically more concerned with own-price elasticities, and for this comparison we place greater weight on own-price elasticities while giving some weight to cross-price elasticities. Second, and somewhat related, the econometric estimates imply unequal elasticities of substitution between wine grapes from different regions, in contrast to the assumptions underpinning the synthetic estimates. Consequently, the correspondence between the econometrically estimated demand elasticities and their synthetic counterparts varies among wine grape categories, depending on the assumed value of the elasticity of substitution. Although it is not surprising that estimates of the own-price elasticity of demand for a given product vary across estimation methods, it is reassuring that the estimates are reasonably comparable across a wide range of assumed values of the elasticity of substitution and quite close for each category for particular values of the elasticity of substitution within that range.
VIII. Conclusion
This article presents estimates of the elasticities of demand for wine grapes from different regions in California, differentiated on the basis of average prices as an indicator of quality. It adds to the wine economics literature by estimating the demand for the most important input in winemaking: wine grapes.
“Synthetic” estimates of elasticities of demand for wine and wine grapes were calculated using readily available information along with careful guesswork and sensitivity analyses where data were not available. These calculations show that basic estimates of demand elasticities can be made without econometric estimation but that the results can be sensitive to assumptions and thus are conditional and uncertain.
The econometric estimates, based on 25 years of data, are plausible and suggest that the demand for every category of California wine grapes is very elastic. The demand for high-price wine grapes, such as those being produced in Napa and Sonoma counties in California, is the most elastic (with an own-price elasticity of −9.5), the demand for low-price wine grapes, mostly from areas in the southern San Joaquin Valley, is the least elastic (with an own-price elasticity of −2.6).
The preferred synthetic estimates, displayed in the boxed area of Table 3, fall in between the high and low econometric estimates. These estimates are preferred both because of the corroboration from the econometric analysis and because they are based on parameter choices that we found the most reasonable. Thus the two approaches are complementary, each providing reinforcement to the other and strengthening our confidence in the results. The main difference between the two sets of estimates relates to the elasticity of substitution between pairs of wine grape categories. The econometric results are not consistent with assumption of a constant elasticity of substitution across all pairs, on which the synthetic estimates were based.
Appendix A:
Data Used for Econometric Estimation

Appendix B: Technical Notes
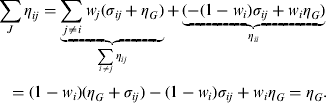
1. The uncompensated own-price elasticity can also be calculated from the fact that sum of the cross- and own-price elasticities of demand for each region, j, is equal to the elasticity of demand for California wine grapes (if σ ij is constant across pairs):
$$\sum\limits_j {\eta _{ij} = \eta _G.} $$This can be shown by summing the cross-price elasticities and the own-price elasticity of demand for wine grapes:
We use this as a check on the results. It then follows that in these calculations for which σ ij is constant over all pairs, η G is the same as the negative of the expenditure elasticity of demand for wine grapes since by homogeneity of degree zero,$$\sum\limits_J {\eta _{ij} = \underbrace {\sum\limits_{\,j \ne i} {w_j (\sigma _{ij} + \eta _G )}} _{\sum\limits_{i \ne j} {\eta _{ij}}} + \underbrace {( - (1 - w_i )\sigma _{ij} + w_i \eta _G )}_{\eta _{ii}}} = (1 - w_i )(\eta _G + \sigma _{ij} ) - (1 - w_i )\sigma _{ij} + w_i \eta _G = \eta _G. $$$\sum\limits_j {\eta _{ij} = - \eta _{iX}} $ and $\sum\limits_j {\eta _{ij} = \eta _G} $, as shown above.2. Estimates of Hicksian elasticities of demand can be calculated using Equations (9) and (10) with the alternative values for σ ij. Another positive check on the results can be applied using the fact that
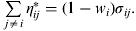
$\sum\limits_{i \ne j} {\eta _{ij}^{ *}} = - \eta _{ii} ^{*}$, since $\sum\limits_{\,j \ne i} {\eta _{ij} ^{*} = (1 - w_i )} \sigma _{ij}. $3. Equation (18) can be derived shown by summing both sides of (17) over j, substituting (16) into the left-hand side and noting that right-hand side is equal to 1 because the shares sum to 1:
$\sum\limits_j {w_j = 1.} $