1 Introduction
Financial literacy has become increasingly important in Japan for at least two reasons. The first reason relates to the vulnerability of pay-as-you-go pension systems. Before the 2004 reform of Japan's public pension system, pension benefits were fixed by law, which implied that as the population continued to age, the burden on working people would increase.Footnote 1 To avoid this situation, the 2004 reform decided first to fix contribution rates and then to adjust benefit levels, implying a decrease in pension benefits with an aging population, meaning that individuals would need to take on more responsibility for their financial well-being after retirement. The second reason is the rapid development of financial markets with complex financial products. Through the financial liberalization of the mid-1990s, for example, it became possible for banks and insurance companies to sell mutual funds, and defined-contribution pension plans were introduced in 2001. The result is that individuals are able to purchase risky assets that they may not adequately understand, due to lack of financial knowledge and information.
The objective of my study is threefold. First, to provide an overview of the level of financial literacy in Japan using the Survey of Living Preferences and SatisfactionFootnote 2 (SLPS), to which questions have been added that assess respondents’ level of financial literacy. Second, to consider which groups within the Japanese population have low financial literacy. Third, to link financial literacy to retirement planning in Japan.Footnote 3
My paper makes two unique contributions to cross-country comparisons on financial literacy and planning. First, I examine the effect that savings promotion activities in schools (referred to as ‘children's banks’) have on financial literacy and retirement planning. Although children's banks are considered to be the earliest financial education formally offered in Japan, as far as I know, an analysis on children's banks has never been done. Children's banks allow students to deposit and withdraw money to/from financial institutions through schools, and the interest income on the money deposited through the banks is tax exempt. One could posit that access to children's banks might improve financial literacy levels as it would offer experience with interest calculations and understanding of the value of money. In addition, since students attending schools with a children's bank are encouraged to save money regularly, one could expect that this experience would lead to development of strong savings habits. Second, to address the problem of causality between financial literacy and retirement planning, I use level of Japanese language ability as instruments for financial literacy; respondents with stronger language ability are more likely to comprehend the financial literacy questions than those with lesser language ability and it is unlikely that language ability would affect the likelihood of developing a retirement plan.
The remainder of this paper is structured as follows. Section 2 describes the SLPS data. Section 3 presents the empirical results and attempts to answer the following questions: How financially literate are individuals in Japan (Section 3.1)? Who knows the least (Section 3.2)? and Does financial literacy matter (Section 3.3)? Section 4 provides concluding remarks.
2 SLPS
SLPS is a panel survey that has been conducted annually since 2003.Footnote 4 It is a nationally representative sample of males and females aged 20–69 selected by a two-stage stratified random sampling from household registers. This paper employs data from the January–February 2010 wave (the eighth wave of the survey) because it is the first to include the questions designed to measure respondents’ level of financial literacy. There were 5,386 respondents in SLPS 2010, and the response rate was 88%.Footnote 5 The sample selection in the empirical analysis is explained in Section 3.
3 Empirical evidence
3.1 How financially literate are individuals in Japan?
3.1.1 Measuring financial literacy
The three questions used in this study were modeled on the financial literacy questions that were included in the 2004 U.S. Health and Retirement Study (HRS).Footnote 6 The wording of these questions is as follows:
1. Understanding of Interest Rate. Suppose you had 10,000 yenFootnote 7 in a savings account and the interest rate was 2% per year. After 5 years, how much do you think you would have in the account if you left the money to grow? (i) More than 10,200 yen; (ii) Exactly 10,200 yen; (iii) Less than 10,200 yen; (iv) Do not know; (v) Refuse to answer.
2. Understanding of Inflation. Suppose that the interest rate on your savings account was 1% per year and inflation was 2% per year. After 1 year, would you be able to buy with the money in this account? (i) More than today; (ii) Exactly the same; (iii) Less than today; (iv) Do not know; (v) Refuse to answer.
3. Understanding of Risk Diversification. Do you think that the following statement is true? Buying a single company stock usually provides a safer return than a stock mutual fund. (i) True; (ii) False; (iii) Do not know; (iv) Refuse to answer.
3.1.2 Results
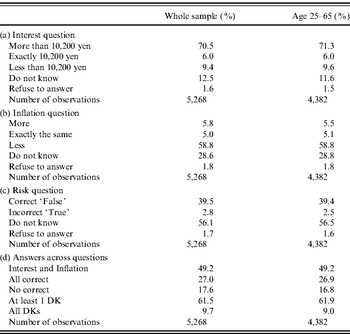
Respondents’ answers to the Interest, Inflation and Risk questions are reported in Table 1(a)–Table 1(c), and overall performance is shown in Table 1(d). I drop observations for which one or more of the answers to the financial literacy questions are missing. The percentage of non-responses is between 1.4% and 1.7% of the total sample for each of the three questions. Moreover, for this international comparison of financial literacy, I present results obtained both from the ‘whole sample’ (all observations) and observations from respondents aged 25–65.
Answers to the financial literacy questions
(a–c) Report the proportion of responses to each of the financial literacy questions. (d) Reports proportion of respondents who (1) were able to give correct answers to both the Interest and the Inflation questions, (2) were able to give correct answers to all three questions, (3) were unable to give correct answers to any of the questions, (4) gave at least one ‘do not know’ response and (5) gave ‘do not know’ responses to all three questions. ‘Whole sample’ shows responses for the full sample; ‘Age 25–65’ shows responses for that age group alone.

Note: Author's calculation on the basis of the SLPS 2010. Data are unweighted.
The responses to the first question (Interest) are displayed in Table 1(a). Around 71% of all respondents correctly answered that there would be more than 10,200 yen in the account. Around 15% gave incorrect answers; many of these respondents expected there would be less than 10,200 yen in the account. About 13% said that they did not know the answer, and about 2% refused to answer. The first question is very basic and appears to be simple to answer for most of the respondents. The responses to the second question (Inflation) are shown in Table 1(b). Only 59% of respondents correctly answered that the purchasing power of their savings will decrease because of inflation. The proportion of respondents who did not know the answer to this question is about 29%, more than twice the proportion of respondents who did not know the answer to the Interest question (14%). Considering trends over time in the consumption price index, one can see that Japan has not experienced inflation since the second oil shock in 1979. The inflation rate has had a downward trend since 1981, and it is widely known that Japan has experienced deflation during the 2000s. This might be the reason why many do not correctly answer the question on inflation. In addition, terms such as ‘deflation’, ‘inflation’ and ‘price fluctuations’ do not appear in Japanese school curricula, possibly an additional contributor to the fact that about 41% of all respondents were unable to answer the Inflation question correctly. Table 1(c) presents the responses to the third question (Risk). Only about 40% of respondents answered this question correctly. About 3% answered incorrectly. More than half of the respondents indicated that they did not know the answer. Risk diversification is not a part of Japan's school curricula. Thus, individuals have to have either some economic or financial education or some experience with investments to understand risk diversification. According to the Survey of Future Life,Footnote 8 just 2.4% of the Japanese population aged 18–69 in 2001 have learned about investments strategies.Footnote 9 Moreover, according to SLPS 2010, just 19% (27%) of respondents hold stocks (mutual funds).Footnote 10
The overall performance of respondents is summarized in Table 1(d). The Interest and Inflation questions were answered correctly by only half of the respondents (49%). Slightly more than a quarter (27%) were able to give correct answers to all three questions. Moreover, we see that about 18% of respondents could not give correct answers to any of the questions. The proportion of respondents who answered ‘do not know’ to at least one question is very high (62%). Furthermore, about 10% of respondents indicated that they did not know the answer to all three questions.
In summary, the level of financial literacy in Japan is not high. Although the majority of respondents were able to correctly answer the Interest question, more than half were not able to correctly answer the Risk question. The remarkable feature of Japanese respondents is that many did not give answers, responding instead that they ‘do not know’ the answer. Specifically, 13%, 29%, and 56% of respondents indicated that they did not know the answer to the Interest, the Inflation and the Risk questions, respectively. These results might indicate that Japanese are very cautious and tend not to answer unless they are confident in their response.
3.2 Who knows the least?
In this section, I concentrate on respondents who display lower levels of financial literacy. In Section 3.2.1, I show the relationship between financial literacy and certain demographic characteristics. In Section 3.2.2, I consider how the level of financial literacy varies across two characteristics specific to Japan.
3.2.1 Financial literacy, age, gender, education and work
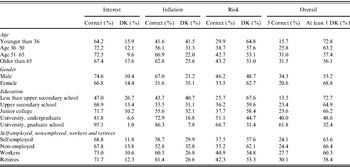
Table 2 shows the answers to the financial literacy questions across different socioeconomic characteristics.Footnote 11 Correct answers to the Interest and Inflation questions show a hump-shaped pattern across age.Footnote 12 The percentages of respondents with correct answers to the two questions increase with age, generally, but decrease in the oldest age group.Footnote 13 However, the patterns of correct answers to the Risk question reveal a different picture from that seen with the Interest and Inflation questions. The percentage of respondents with correct answers to the Risk question continues to increase with age until the age of 51–65, but there is no statistically significant difference between respondents aged 51–65 and those older than 65.Footnote 14 Women perform significantly worse than men:Footnote 15 the percentage of female respondents giving correct answers is lower than the percentage of male respondents for all questions. In addition, financial literacy is highly correlated with education, and the gradient is steep. As the level of education increases, the percentage of respondents with correct answers to individual questions and with all three correct answers is higher.Footnote 16 Finally, non-employed groups perform worst and retirees perform best in most cases.
Distribution of financial literacy across demographics
This table shows financial literacy across different socioeconomic variables. The first six columns show the percentage of correct answers (Correct) and the percentage of ‘do not know’ answers (DK) to each financial literacy question (Interest, Inflation and Risk). The last two columns display the percentage of respondents with three correct answers and the percentage of respondents with at least one ‘do not know’.

Note: Author's calculation on the basis of the SLPS 2010. Data are unweighted.
3.2.2 Financial literacy, self-assessed financial knowledge and children's banks
In Section 3.1.2, I showed that the level of financial literacy is not high in Japan. In this section, I look at how Japanese assess their level of financial literacy and consider the relationship between self-assessed financial literacy and observed financial literacy. In addition, I focus on the relationship between children's banks and financial literacy. Children's banks are specific savings promotion activities in Japanese schools.Footnote 17 Because students are recommended to save money regularly (e.g., twice a month), children's banks might improve the level of financial literacy, for example, by inducing children's interest in calculating interest rates and thinking about the value of money.
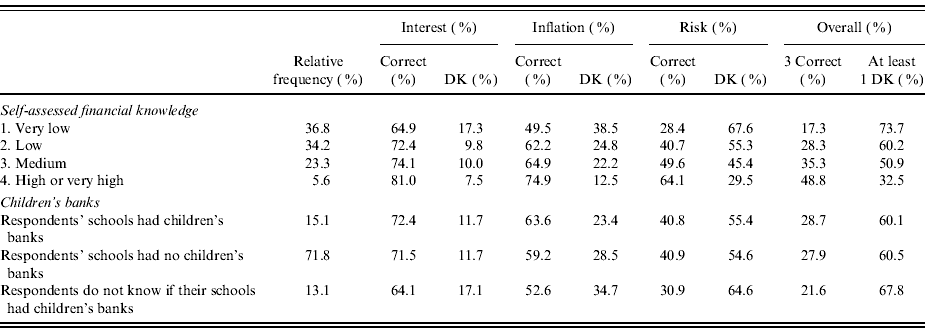
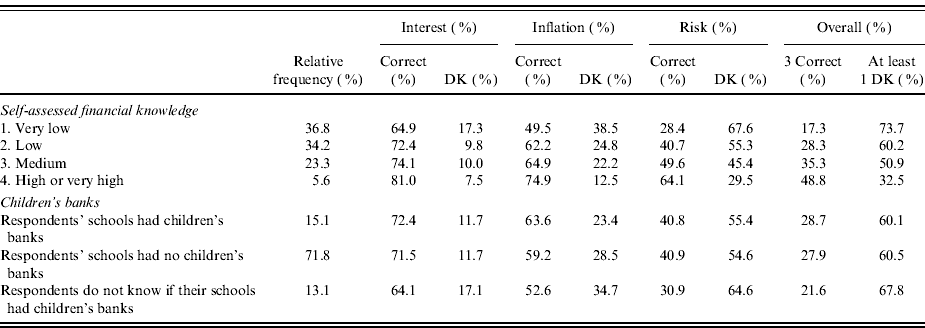
Self-assessed literacy. In the survey, respondents were asked whether they think that they know a lot about finance and to give their answer on a 1–5 scale.Footnote 18 For example, the answer ‘1’ (‘5’) indicates that respondents think that they do not (do) know a lot about finance. Table 3 shows that the proportion of respondents who think that their level of financial literacy is ‘very low’ or ‘low’ is more than 70% (=36.8%+34.2%) of total observations and the proportion of respondents who chose ‘high’ or ‘very high’ is only 5.6% (=4.9%+0.7%). Thus, many Japanese report not being confident about their financial literacy.Footnote 19 Comparing the objective measures of financial literacy, as measured by the responses to the three financial literacy questions, with respondents’ self-assessed financial literacy, we see that as self-assessed financial literacy increases, the percentage of correct answers to all three questions also increases.Footnote 20 However, even among respondents who think that their level of financial literacy is high or very high, the percentage of respondents with correct answers to all three questions is only 48.8%.
Distribution of financial literacy across self-assessed financial knowledge and children's banks
This table shows how the level of financial literacy differs with level of self-assessed financial knowledge and whether or not there was a children's bank in the elementary school that respondent attended. For each question (Interest, Inflation and Risk), ‘Correct’ refers to the percentage of respondents with a correct answer and ‘DK’ refers to the percentage of respondents who said they did not know the answer. Overall, ‘3 correct’ refers to the percentage of respondents who correctly answered all three questions, and ‘At least 1 DK’ refers to the percentage of respondents who said that they did not know the answer to at least one question. I used all observations in which respondents answered all three financial literacy questions and the questions on the relevant demographics. The number of observations is 5,260 for self-assessed financial knowledge and 5,198 for children's banks.
Note: Author's calculation on the basis of the SLPS 2010. Data are unweighted.
Children's banks. The question in the survey about children's banks is as follows:
Was there a children's bank (the system through which students can deposit and withdraw money via their school) in the elementary school you attended? (i) Yes; (ii) No; (iii) Do not know.
The results in Table 3 show that children's banks do not affect financial literacy. Specifically, the percentage of respondents with correct answers are not significantly different between respondents who attended schools with a children's bank and those who attended schools without a children's bank for any question except for the Inflation question.Footnote 21 In Sections 3.3.1 and 3.3.2, I assess the effect of children's banks on the level of financial literacy and the propensity to develop a plan for retirement using a multivariate analysis approach.
3.3 Does financial literacy matter?
3.3.1 Retirement planning
In this section, I turn to the question of whether financial literacy matters for retirement planning. I measure retirement planning using the following question:
Do you have a savings plan for after the household head retires? (If the household head has already retired, do you have a savings plan for the future?) (i) I have a specific plan (5%). (ii) I have a rough plan (35%). (iii) I do not have a plan now, but I am going to make a plan in the future (47%). (iv) I do not have a plan now, and I am not going to make a plan in the future (14%).
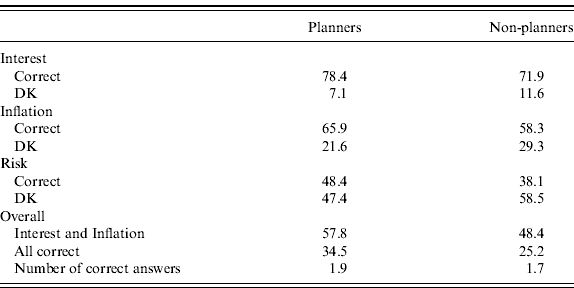
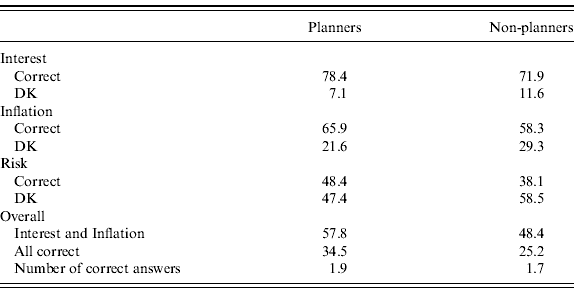
While 40% of respondents have a specific or a rough plan, more than half do not have a plan. Moreover, 14% of respondents do not intend to make a plan. Table 4 compares the level of financial literacy between planners (respondents who chose i or ii) and non-planners (respondents who chose iii or iv). The differences between planners and non-planners are statistically significant at the 1% level in all cases. More specifically, the percentage of respondents with correct answers to individual questions (DK) is higher (lower) for planners than for non-planners. In addition, among planners, the percentage of correct answers to both the Interest and the Inflation questions, percentage of all three correct answers, and the overall number of correct answers is higher than among non-planners.
Retirement planning and financial literacy
This table shows the levels of financial literacy for planners and non-planners. Planners are respondents who indicate having a savings plan for after the household head retires (if the household head has already retired, they have a savings plan for the future), and Non-planners are respondents who indicate not having a savings plan. ‘Correct’ refers to the percentage of respondents with a correct answer to the question indicated, ‘DK’ refers to the percentage of respondents who said that they did not know the answer to the question indicated, and ‘Interest and Inflation’ refers to the percentage of respondents with correct answers to both the Interest and the Inflation questions. I dropped observations that had missing values for the variables included in the regression and kept the observations on non-retired respondents who are aged 25–65. The number of observation is 2,855.
Source: Author's calculation on the basis of the SLPS 2010. Data are unweighted.
3.3.2 Retirement planning and financial literacy (ordinary least squares (OLS) results)
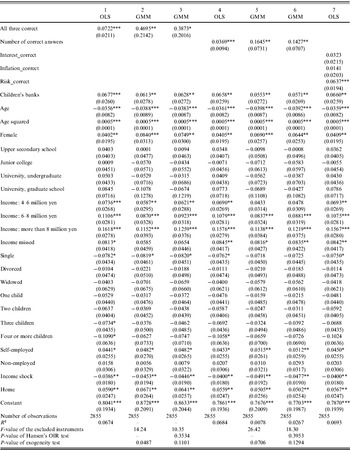
In order to examine the relationship among retirement planning, financial literacy and socioeconomic characteristics, I conduct a multivariate analysis. First, I estimate a simple linear probability model regression. As in Table 4, I use Planners as dependent variables, which is a dummy variable equal to one if respondents state they have a savings plan for their retirement. Financial literacy is measured in three ways. The first measure is a dummy variable that equals one if respondents were able to answer all three financial literacy questions correctly. The second measure is the number of correct answers to the financial literacy questions. The third measure is a set of three dummy variables indicating the correct answers to the Interest question, Inflation question and Risk question, respectively. In addition, I control for having had children's banks in school, age, gender, education level, household income, marital status, number of children in the household, self-employment, non-employment, occurrence of income shock, homeownership and seven regional dummies. To select the final sample, I dropped observations that had missing values for the variables included in the regression. Moreover, I restricted the empirical analysis to the non-retired respondents aged 25–65, because developing a savings plan is more important for non-retirees than for retirees and because restricting the sample to age 25–65 makes it possible to do an international comparison of the empirical results.
The OLS results are displayed in columns 1, 4 and 7 of Table 5. Even accounting for many demographic and economic characteristics, financial literacy has a positive effect on retirement planning, and the coefficients are statistically significant. More specifically, the ability to answer three questions correctly increases the probability of having a savings plan for retirement by about 7 percentage points, and one extra correct answer increases the probability of having a savings plan by about 4 percentage points. Looking at the estimates in column 7, although all the coefficients of three dummy variables are positive, only the coefficient of risk diversification is significant at the 1% level; thus, of the three concepts measured, an understanding of risk diversification – perhaps a measure of sophisticated knowledge – is the most important factor for developing a savings plan. Experience with children's banks also has a positive effect on retirement planning. Ceteris paribus, attending schools with a children's bank increases the probability of having a savings plan by 7 percentage points compared with those who attended schools without a children's bank or those who do not know whether there was a children's bank in their school. With respect to demographic variables, I find that older respondents, single respondents, respondents with many children, and respondents whose income decreased compared to 2008 are less likely to have a savings plan for retirement. On the other hand, I find that female respondents, higher income respondents, self-employed respondents and home owning respondents are more likely to have a savings plan for retirement.Footnote 22
Multivariate analysis of retirement planning (OLS and GMM estimates)
This table reports OLS and GMM estimates of the effect of financial literacy and several control variables on retirement planning. The dependent variable is a dummy variable that equals one if respondents have a savings plan for their retirement. ‘All three correct’ is a dummy variable that equals one if respondents correctly answered all three financial literacy questions. ‘Number of correct answers’ means the total number of correct answers to the three financial literacy questions. ‘Interest_correct’, ‘Inflation_correct’ and ‘Risk_correct’ are dummy variables indicating the correct answers to the Interest question, Inflation question and Risk question, respectively. I also included seven regional dummies, but their coefficients are not shown. Standard errors are White's heteroskedasticity-robust standard errors. *, ** and *** indicate significance at the 10%, 5% and 1% levels, respectively.

Source: Author's calculation on the basis of the SLPS 2010. Data are unweighted.
3.3.3 Retirement planning and financial literacy (Generalized Method of Moments (GMM) results)
There is a potential problem in relying on OLS estimates because of the possibility that individuals may improve their financial knowledge via their development of a savings plan. In order to take account of this reverse causality between financial literacy and retirement planning, I turn to Instrumental Variables (IV) estimation. I use the level of Japanese language ability as an instrument for financial literacy.Footnote 23 Respondents must know the meaning of words and be able to comprehend the sentences in the financial literacy questions. Moreover, it is unlikely that Japanese language skills are directly related to developing a savings plan.Footnote 24
I use two types of instrumental variables. The first is the respondents’ Japanese language skill as measured by the following question:
When you were 15 years old, where did your grades in Japanese rank among others in your grade? (i) In lower rank; (ii) in rather lower rank; (iii) in the middle; (iv) in rather higher rank; and (v) in higher rank.
I define two dummy variables that equal one if respondents chose (iv) and (v), respectively. The second instrumental variable for financial literacy is the average Japanese language ability in the prefecture where the respondents live.Footnote 25 The hypothesis for this instrument is that if respondents are surrounded by people with high Japanese language skills, respondents are more likely to learn from them and to become more financially literate as well. Several studies have emphasized the importance of peers for financial knowledge and behavior (van Rooij et al., Reference Van Rooij, Lusardi and Alessie2011).
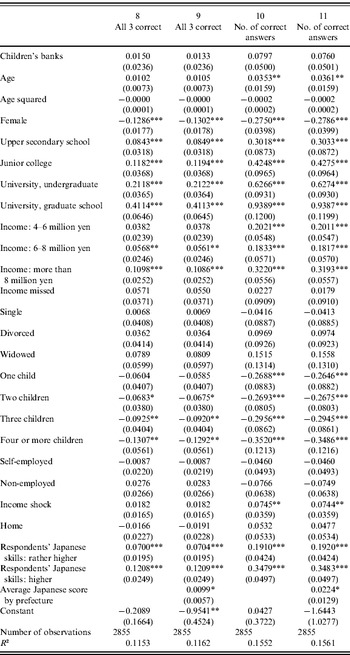
The results for the first stage regression are reported in Table 6. The dependent variables in columns 8 and 9 (all three correct) are a dummy variable that equals 1 if all three financial literacy questions are answered correctly, and those in columns 10 and 11 (no. of correct answers) are the number of correct answers to the three financial literacy questions. With respect to columns 8 and 10 of Table 6, instrumental variables are a dummy variable that equals one if respondents’ grades in Japanese rank in ‘rather higher rank’ in their grade and a dummy variable that equals one if respondents’ grades in Japanese rank in ‘higher rank’ in their grade. With respect to columns 9 and 11, instrumental variables are the two dummy variables used in columns 8 and 10 and the average language score by prefecture.
First-stage regressions
This table reports the first stage regressions of the GMM estimation shown in Table 5. ‘All three correct’ is a dummy variable that equals one if respondents correctly answered all three financial literacy questions. ‘Number of correct answers’ means the total number of correct answers to the three financial literacy questions. I also included seven regional dummies, but their coefficients are not shown. Standard errors are White's heteroskedasticity-robust standard errors. *, ** and *** indicate significance at the 10%, 5%, and 1% levels, respectively.

Note: Author's calculation on the basis of the SLPS 2010. Data are unweighted.
Looking at the results in Table 6, all the coefficients of the two types of instruments are statistically significant, and of the expected positive sign. While age does not have a significant effect on the ability to answer all three financial literacy questions correctly, it does have a significant and positive effect on the number of correct answers. Moreover, consistent with the results obtained in other studies, women, individuals with lower educational attainment and lower-income individuals in Japan are least likely to be financially literate. The GMM results are reported in columns 2, 3, 5 and 6 of Table 5.Footnote 26 I found that financial literacy has a positive and significant effect on planning for retirement. Moreover, the coefficients of financial literacy in the GMM estimation are larger in value than the coefficients of the OLS estimates. For example, the ability to answer three questions correctly increases the probability of having a savings plan for retirement by 47 percentage points (column 2 of Table 5) and an increase in the number of correct answers increases the probability of having a savings plan by 16 percentage points (column 5 of Table 5). With respect to the other explanatory variables, the OLS and GMM results are not different in most cases.Footnote 27
4 Conclusions
Overall, the level of financial literacy is not high in Japan. Only 49% of Japanese respondents were able to answer two simple questions on interest rates and inflation. Sixty percent were not able to correctly answer a question on risk diversification. Surprisingly, 62% of Japanese respondents indicated that they did not know the answer to at least one question. With respect to the level of financial literacy, I found that women, the young and individuals with lower incomes and lower educational attainment are less likely to give correct answers to the questions on financial literacy, which is consistent with results obtained in other studies. With respect to the relationship between financial literacy and retirement planning, I found that financial literacy increases the probability of having a savings plan for retirement. Finally, I found that if people save regularly when they are children, they are more likely to develop a plan for retirement when they become adults.
Appendix: Descriptive statistics
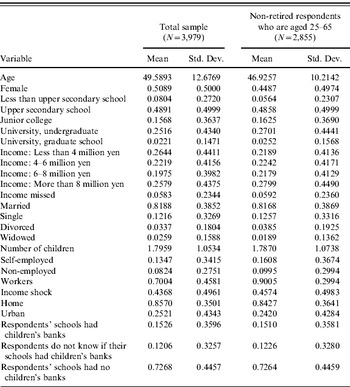
The average age of respondents to this survey is 50. Fifty-one percent of respondents are female. Eighty-two percent of respondents are married. Eight percent of respondents have education less than upper secondary school, 49% of respondents completed upper secondary school education, and 43% of respondents have higher education degrees. Eighty-six percent of respondents own their homes. Looking at the Population Census in 2005 and the Employment Status Survey in 2007, I find that the average age and percentage of females in the SLPS are consistent with those in the macro data, but unfortunately, marriage rate, educational level and home ownership rate are higher in the SLPS than in the macro data.Footnote 28
Summary statistics