


1. Introduction
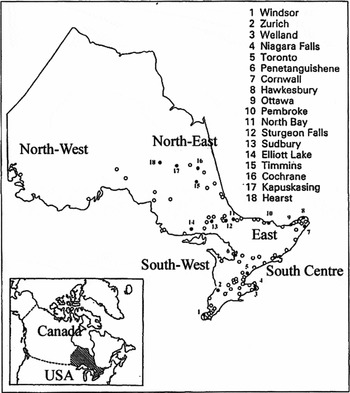
French is the mother tongue of approximately 5% of the population of the Canadian province of Ontario, but the demographic concentration of francophones varies considerably from one locality to another. For example, it is as high as 85 to 90% in Hearst and Hawkesbury and as low as 2 to 3% in Toronto and Windsor (Figure 1). So, in some places, French is the majority language, but everywhere else in the province, it is a minority language that is spoken in intense contact with English. This situation could lead to transfer from the majority language and affect French grammar and usage. In undertaking this analysis of rhythm, our first goal is to describe variation in the rhythm of Ontario French (OF), taking into account the minority vs. majority status dimension. Our secondary objective is to examine trends in rhythm according to the demographic factors of age and sex. More specifically, we are interested in determining whether French displays a more English-like rhythm in a minority situation than in a majority situation and if social factors, such as age and sex, pattern similarly in the two situations.
Main francophone communities in Ontario (adapted from Mougeon 2004: 159).

OF is considered to be a variety of Laurentian French (Côté, Reference Côté, LeBlanc, Martineau and Frenette2010), sharing with its Quebec parent a common grammar as well as certain vernacular features. However, due to its minority status and contact with English, it diverges on a number of points. According to Mougeon et al. (Reference Mougeon, Nadasdi and Rehner2005), some of these divergences can be considered examples of internal restructuring due to the reduced frequency of the use of French, while others can be attributed to a convergence with or a transfer from English. For example, on the lexical and morphosyntactic levels, we find borrowings, code switching and calques (Poplack, Reference Poplack, Mougeon and Beniak1989; Mougeon and Beniak, Reference Mougeon and Beniak1991; Mougeon, Reference Mougeon, Coveney, Hintze and Sanders2004; Nadasdi, Reference Nadasdi, Valdman, Auger and Piston-Hatlen2005). In terms of segmental phonology, in comparison to Quebec French, minority French in Ontario exhibits differences in the realization of glides (Poiré et al., Reference Poiré, Gurski, Kelly, Detey and Nouveau2007) and nasal vowels (Poiré et al., Reference Poiré, Kelly and Williams2006), as well as in omission of schwa and realization of liaison (Poiré et al., Reference Poiré, Kaminskaïa and Tremblay2010).Footnote 1 In terms of intonation, previous studies note similarities with English in fundamental frequency (F0) declination (Cichocki and Lepetit, Reference Cichocki, Lepetit and Sankoff1986), tonal inventory (Tremblay, Reference Tremblay2007), and the frequency of falling contours (Kaminskaïa, Reference Kaminskaïa2013). At the same time, this latter author observed differences in the realization of the same intonation pattern between older and younger speakers. They were attributed to the effect of schooling, younger speakers (see footnote 1) imitating a standard French pattern. With respect to rhythm, in a pilot study examining rhythm in the speech of young francophones in majority and minority settings, as well as anglophone L2 learners of French, Tennant (Reference Tennant, Marnieau and Nadasdi2011) did not observe differences that would suggest an influence of English on French rhythm in the latter two groups. A rhythmic pattern diverging from typical French syllable timing was observed by Kaminskaïa (Reference Kaminskaïa2014) in her study based on text readings by speakers of OF in a minority setting, with a more syllable-timed pattern observed in female speakers in comparison with males. Both minority and majority OF varieties were considered in our pilot study (Kaminskaïa et al., 2103), which did not reveal a significant difference in rhythm patterns between the majority and the minority settings but did identify differences pertaining to social factors of age and sex. The results indicated that men and young speakers showed a less syllable-timed rhythm than women and older speakers. While this apparent age effect may be attributable to the greater influence of English on the prosody of younger speakers’ French than on of that of older speakers, as a result of more intense contact with English in the younger generation (see section 2), the sex effect is more difficult to explain. Later in this paper, we examine these social factor effects on rhythm in more detail, and consider an explanation in terms of trends noted in previous studies on the Windsor corpus showing differing rates of application between women and men of certain phonological processes (see section 5).
The more comprehensive investigation reported on here is based on a larger corpus and uses a wider array of methods than our initial study in order to determine whether OF in a minority setting shows differences in rhythm when compared to OF in a majority setting, assuming that such differences may be attributable to the influence of English rhythm. With regard to demographic groups, based on observations made in our preliminary analysis (Kaminskaïa et al., Reference Kaminskaïa, Tennant, Russell, Barysevich, D'Arcy and Heap2013) and in Kaminskaïa (Reference Kaminskaïa2014), we start from a hypothesis according to which older speakers and women would have a more syllable-timed rhythm than younger and male speakers.
To conduct this study, we use recordings of spontaneous speech samples from native speakers of OF from Hearst and Windsor Phonologie du français contemporain (PFC) corpora (Durand et al., Reference Durand, Laks, Lyche, Durand, Laks and Lyche2002, Reference Durand, Laks, Lyche, Durand, Laks and Lyche2009). The first dataset represents OF in a majority setting, while the second illustrates OF in a minority setting where it is in intense contact with English. Both corpora have equal numbers of male and female speakers, and they have equal numbers of speakers above and under age 45, which was used as a threshold for the distribution of the speakers into age groups. The total number of participants is 24.
The current analysis focuses on phonetic rhythm, or timing (Arvaniti, Reference Arvaniti2009). It is based on rhythm metrics, which allow comparisons of the rhythm of different languages and language varieties by placing them on a continuum ranging from stress-timed rhythm at one end to syllable-timed rhythm at the other. On this continuum, English tends toward stress timing, while French has a tendency for syllable timing. Placing our datasets on such a continuum allows us to evaluate the possible effect of English on the rhythm of French spoken in the minority setting of Windsor, as transfer from English is expected to be reflected in higher values of certain metrics and lower values of other metrics (see below) in comparison with French spoken in the majority setting of Hearst. The statistical significance of patterns observed for independent variable effects – minority/majority setting, age and sex – will be evaluated using ANOVA tests.
2. Rhythm studies
The traditional classification of languages according to rhythm type (Pike, Reference Pike1945; Abercrombie, Reference Abercrombie1967) distinguishes languages with relatively regular stress intervals (e.g., English, German, Dutch, among others) from languages with regular syllabic intervals (e.g., French, Spanish, Mandarin, among others).Footnote 2 Since this initial classification, numerous studies of world languages have focused on distributing them into one or the other rhythmic category. However, most studies could not confirm empirically that regular intervals actually exist in natural languages, so the very principle of the classification is called into question (Dauer, Reference Dauer1983; Nolan and Asu, Reference Nolan and Asu2009). In French, for example, Pasdeloup (Reference Pasdeloup1991) observed that the duration of unstressed syllables progressively increases. In another study, Wenk and Wioland (Reference Wenk and Wioland1983) did not find evidence that syllables in French have similar durations and so the language should not be considered to be syllable timed. Rather, according to the authors, French rhythm, with its structure in rhythmic groups bounded to the right by a lengthened final syllable, can more accurately be termed trailer timed.
Given the lack of evidence supporting the binary two-category approach, rhythmic classification of languages was reconsidered in terms of a continuum. A more or less syllable-timed or stress-timed rhythmic pattern is determined by a set of phonological properties of the language (Dauer, Reference Dauer1987), among which syllable structure and vowel reduction are the main contributors (Dauer, Reference Dauer1983; but see also Prieto et al., Reference Prieto, del Mar Vanrell, Astruc, Payne and Post2012; White, Reference White2014). Thus, stress-timed languages, such as English, are characterized by a qualitative and a quantitative vowel reduction and by a rich typology of syllabic structures where one regularly finds both complex onsets and complex codas. In syllable-timed languages such as French, on the other hand, the preferred syllable structure is CV, while vowel reduction is absent.Footnote 3 These characteristics contribute to a greater or a lesser degree of variability to the vocalic and consonantal intervals that can be measured and compared between languages and dialects to allow evaluation of their rhythmic patterns.
Ramus et al. (Reference Ramus, Nespor and Mehler1999) demonstrated that a greater variability of vocalic (ΔV) and consonantal intervals (ΔC), as well as a smaller proportion of vocalic intervals (%V) in comparison with consonantal ones are common to languages such as English and Dutch. On the other hand, a higher proportion of vocalic intervals and a lesser durational variability of the intervals are common to French, Spanish and Italian.
Because rate affects the duration of intervals and, therefore, their variability, rate normalized metrics were introduced. First, Dellwo (Reference Dellwo, Karnowski and Szigeti2006) introduced VarcoC, or the variation coefficient for consonantal intervals where ΔC is divided by the average duration of consonantal intervals and multiplied by 100, to show that in comparison with other methods it more successfully discriminates between French, on one end, and English and German, on the other. Later, for a comparison of Dutch and English with French and Spanish, White and Mattys (Reference White and Mattys2007a; Reference White, Mattys, Prieto, Mascaro and Solé2007b) proposed VarcoV (ΔV/MoyVx100).
In addition to the aforementioned interval metrics, the Pairwise Variability Index (PVI, Low and Grabe, Reference Low, Grabe, Kjell and Branderud1995; Low, Reference Low1998) became widely used, showing a high discriminatory power. This index is based on sequential measurements of vocalic (PVI-V) or consonantal (PVI-C) intervals, and it can be normalized (nPVI) to neutralize the effect of speech rate. Higher PVI values reflect a higher variability of the intervals, a property of stress-timed languages, while lower PVI values correspond to lower interval variability and characterize syllable-timed languages. Rate-normalized PVI calculated on vocalic intervals (nPVI-V, Grabe and Low, Reference Grabe, Low, Warner and Gussenhoven2002) helped researchers to rank a number of languages on a continuum, ranging from Mandarin (nPVI-V = 27.7) to Thai (nPVI-V = 65.8). French is situated closer to the syllable-timed end of this continuum (nPVI-V = 43.5), while English is closer to the stress-timed end (nPVI-V = 57.2).
These methods, in their different combinations, were used to examine rhythm in first and second languages, dialects, and languages in contact. However, their stability and power to discriminate between datasets appeared to vary. For instance, in Ramus et al. (Reference Ramus, Nespor and Mehler1999) and Dellwo and Wagner (Reference Dellwo and Wagner2003), the metrics that were shown to be most sensitive to rhythmic differences between languages were ΔC and %V, while White and Mattys (Reference White and Mattys2007a) concluded that VarcoV, %V and nPVI-V had the greatest discriminatory power. Knight (Reference Knight2011), on the other hand, concluded that %V was most stable and reliable in yielding consistent results for speakers on successive tasks.
The application of rhythm metrics to study languages in contact has also seen a certain degree of success. For example, the application of nPVI-V to Singapore English data (Low et al., Reference Low, Grabe and Nolan2000) led researchers to conclude that in comparison with monolingual speakers, bilingual speakers exhibited a more syllable-timed rhythm due to the effect of the syllabic rhythmicity of the Chinese language also spoken by the participants. In another example, Carter (Reference Carter, Gess and Rubin2005) examined Spanish rhythm in monolingual and English-Spanish bilingual speakers and observed higher nPVI-V values in the latter group, which suggested a convergence with English. In yet another application, the diachronic comparison of African-American English by Thomas and Carter (Reference Thomas and Carter2006) using nPVI-V showed a convergence of this variety with the stress-timed pattern of Euro-American English. Finally, varieties of French in contact with European and African languages were explored by Cumming (Reference Cumming2011), Obin et al. (Reference Obin, Avanzi, Bordal, Bardiaux, Ma, Ding and Hirst2012), and Avanzi et al. (Reference Avanzi, Obin, Bordal, Bardiaux, Quiuwu, Ding and Hirst2012).
There have been numerous studies of rhythm in different varieties of French based on these metrics in the past few years. Fagyal (Reference Fagyal, Preston and Niedzielski2011) applied %V, ΔC and ΔV along with the analysis of syllabic structure to data from French monolingual and French-Arabic bilingual speakers. While her analysis did not reveal significant differences between the two groups of speakers in terms of central tendencies for rhythm metrics, closer examination of acoustic properties of segments did show differences between the two groups. Cumming (Reference Cumming2011) compared, among other data, Swiss French with standard European French using an nPVI-V metric based on a combination of vowel durations and F0 but did not observe a significant difference between the varieties. This analysis not only took into consideration a proportional contribution of acoustic correlates to rhythm perception, but it also utilized a phonological approach by calculating nPVI-Vs based on syllable durations. nPVIs calculated from stress group durations were used, among other measurements, on varieties of European and African French (including those in a contact situation) by Obin et al. (Reference Obin, Avanzi, Bordal, Bardiaux, Ma, Ding and Hirst2012) to reveal their superior discriminatory power when combined with rate. Avanzi et al. (Reference Avanzi, Obin, Bordal, Bardiaux, Quiuwu, Ding and Hirst2012) examined varieties of French spoken in France, Belgium and Switzerland and found that regional variation was better accounted for by ΔC and rate. Both European and Canadian French, represented by one speaker each, appeared among 21 languages in a comparative analysis by Mairano and Romano (Reference Mairano, Romano, Lee and Zee2011) and showed no rhythmic difference between the varieties. The rhythm of OF varieties was considered by Tennant (Reference Tennant, Marnieau and Nadasdi2011), who applied nPVI-V to speech samples of Franco-Ontarian adolescents from a minority and a majority setting with speech samples from speakers of French L2. He did not find a significant effect of English on rhythmic patterns of the learners of French or of the speakers of French in a minority setting. In a study of minority OF by Kaminskaïa (Reference Kaminskaïa2014), an array of methods was applied to text readings, with the results indicating an intermediate stress pattern. Furthermore, the comparative analysis of minority OF with Quebec French reported in Kaminskaïa (forthcoming) suggested that rate played a key role in the discrimination of the datasets, an argument that aligns with Obin et al. (Reference Obin, Avanzi, Bordal, Bardiaux, Ma, Ding and Hirst2012) and Avanzi et al. (Reference Avanzi, Obin, Bordal, Bardiaux, Quiuwu, Ding and Hirst2012). Finally, our preliminary analysis of rhythm based on the data from Hearst and Windsor (Kaminskaïa et al., Reference Kaminskaïa, Tennant, Russell, Barysevich, D'Arcy and Heap2013) used ΔC, %V and nPVI-V metrics and suggested that the Windsor dataset had a less syllable-timed pattern and that social factors had an effect on the observed patterns as younger speakers and men showed a more stress-timed pattern than did older participants and women.
It is noted that, while they have been successfully applied in studies such as those we have just reviewed, rhythm metrics have also been shown to have stability and reliability issues (Arvaniti, Reference Arvaniti2009, Reference Arvaniti2012a; Arvaniti and Ross, Reference Arvaniti and Ross2010) as they appear to be dependent on sentence composition and speech production style and sometimes appear to reveal contradictory tendencies. Conversely, the analysis by Prieto et al. (Reference Prieto, del Mar Vanrell, Astruc, Payne and Post2012) suggested that different rhythm metrics depend on different factors and, therefore, inform about different aspects of rhythm. For example, ΔC and VarcoC are sensitive to syllable structure, while nPVI-V and VarcoV are affected by prosodic factors, and %V and ΔV show sensitivity to both. These conclusions are based on the analysis of data concerning different languages and representing different speaking styles and phonotactic structures. This allowed the authors to engage in dialogue about the representativeness of the corpora considered for the analysis of rhythm. It appears that the most representative type of data that can be used for the analysis of rhythm is spontaneous speech as it naturally combines different syllable structures and prosodic units of various levels by including different syntactic structures.
The current analysis of rhythm in OF in a minority and a majority setting used spontaneous speech samples in order to determine 1) if rhythm in a minority French variety has a less syllable-timed pattern than rhythm in a majority French variety, 2) if there are groups of speakers whose rhythm shows a less syllable-timed and more stress-timed pattern, and 3) if rhythm metrics deliver coherent results that complement each other and provide details that contribute to a better understanding of the rhythmic patterns observed. We hypothesize that in comparison with the majority corpus, the minority French dataset will show a more stress-timed rhythm reflected in higher values of ΔV, ΔC, VarcoV and nPVI-V, and lower %V values, especially in the samples from the younger participants as they experience a more extensive influence from English, not only due to growing up with more English spoken with family and friends than was the case for older speakers, but also due to their higher social and geographic mobility as well as the increasing role of English-language media and social media in their lives.Footnote 4 We also expect that tendencies observed between social groups in our preliminary analysis (Kaminskaïa et al., Reference Kaminskaïa, Tennant, Russell, Barysevich, D'Arcy and Heap2013) will be confirmed and that women and older speakers will adhere to a more syllable-timed pattern.
As rate has been found to interact with rhythm metrics and to contribute to discrimination between rhythmic patterns in different varieties of French (Avanzi et al., Reference Avanzi, Obin, Bordal, Bardiaux, Quiuwu, Ding and Hirst2012; Obin et al., Reference Obin, Avanzi, Bordal, Bardiaux, Ma, Ding and Hirst2012), we also included articulation rate in our analysis.
3. Method
3.1 Data and participants
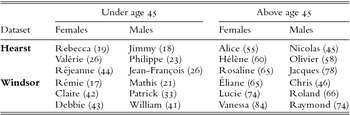
The datasets investigated here are based on speech samples gathered using the PFC protocol (see the Introduction). We analyzed recorded conversations of 24 native Franco-Ontarians – 12 from the Hearst region (majority setting) and 12 from the Windsor region (minority setting), with equal numbers of males and females and equal numbers of speakers under and over age 45 (Table 1).Footnote 5
Speakers identified by their pseudonym (and age).

3.2. Analyses
The analyzed speech samples represent conversations between two to four people exchanging their opinions, giving descriptions and telling stories. For each speaker, a sample varying in duration from two to ten minutes was selected in such a way as to satisfy the methodological constraint of obtaining a minimum of 200 nPVI-V quotients for each participant, following Thomas and Carter (Reference Thomas and Carter2006).
The recordings were first segmented in Praat (Boersma and Weenink, Reference Boersma and Weenink2011) using EasyAlign (Goldman, Reference Goldman2011), followed by a manual verification of segmental boundaries based on acoustic properties of segments described by Peterson and Lehiste (Reference Peterson and Lehiste1960). We then identified vocalic and consonantal segments and intervals – single vowels or consonants, or sequences of vocalic or consonantal segments. Silent pauses, hesitations, false starts, truncated utterances, and code switching were excluded from the analysis. Glides, occasional aspiration of voiceless stops, as well as voiceless vowels that did not display formants were considered consonantal. Glottal stops produced in the context of liaison or enchaînement or at the beginning of a prosodic unit after a pause were also considered non-vocalic elements. All phonetic variants of /ʀ/Footnote 6 were treated as consonantal segments. Finally, affricated dental stopsFootnote 7 were treated as one segment.
For each speaker, we calculated the articulation rate (in syllables per second) by dividing the number of syllables by the total duration of the analyzed segments.Footnote 8 We also extracted information about the intervals and their duration to calculate rhythm metrics:
• %V: proportion of vocalic intervals
• ΔV: standard deviation of the duration of vocalic intervals
• ΔC: standard deviation of the duration of consonantal intervals
• VarcoV: ΔV divided by the average duration of vocalic intervals multiplied by 100
• VarcoC: ΔC divided by the average duration of consonantal intervals multiplied by 100
• nPVI-V: calculated for between-pause speech passages following Thomas and Carter (Reference Thomas and Carter2006) according to the following formula (Grabe and Low, Reference Grabe, Low, Warner and Gussenhoven2002):
(1) \begin{equation}\left( {\begin{array}{*{20}{l}} {\begin{array}{*{20}{l}} {{\rm{m}} - 1}\\ \sum \\ {{\rm{n}} = 1} \end{array}}&{\left| {\frac{{{{\rm{d}}_{\rm{n}}} - {{\rm{d}}_{{\rm{n}} + 1}}}}{{({{\rm{d}}_{\rm{n}}} + {d_{n + 1}})/2}}} \right|}&{/({\rm{m}} - 1)} \end{array}} \right) \times 100\end{equation}

where d = duration of the nth vowel
m= number of vowels in a sequence
In other words, the absolute value of the difference between two consecutive vocalic intervals was divided by the average duration of the intervals. The results of all such calculations were added, and the sum was divided by the number of differences and multiplied by 100. These calculations were performed for each inter-pause interval.
The higher the nPVI-V value, the greater the durational variability between the intervals, thus suggesting a trend toward stress timing. On the other hand, lower nPVI-V values suggest a trend toward syllable timing. Following Thomas and Carter (Reference Thomas and Carter2006), for each speaker, we calculated the median nPVI-V value (rather than the averages for each sentence), because in spontaneous data, syntactic boundaries are often difficult to identify with certainty.Footnote 9
To evaluate the statistical significance of potential differences between datasets and social groups, we applied a series of ANOVA tests (2x2x2 ANOVAs) and tested the effect of three external factors (minority/majority setting, age and sex), each being two-layered (Hearst-Windsor; younger-older; and male-female). To evaluate the interaction between rhythm metrics and rate, we applied Pearson correlations.Footnote 10
4. Results
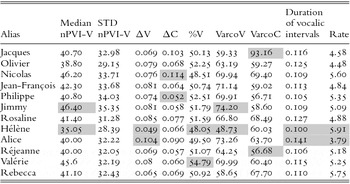
Table 2 presents individual results for the Hearst dataset. Here, minimum and maximum values of the metrics vary as follows: nPVI-V values vary between 35.05 (Hélène) and 46.40 (Jimmy); ΔV values vary between 0.049 (Hélène) and 0.104 (Alice); ΔC values vary between 0.052 (Philippe) and 0.114 (Nicolas); VarcoV values vary between 48.73 (Hélène) and 74.20 (Jimmy); %V values vary between 48.05% (Hélène) and 54.79% (Valérie); and VarcoC, values vary between 56.68 (Réjeanne) and 93.16 (Jacques). The average duration of vocalic intervals from which the metrics are calculated varies between 0.100 sec (Hélène) and 0.141 (Alice). In addition, the slowest articulation rate is observed in Alice's recordings (3.79 syll/sec), whereas Hélène speaks the fastest (5.91 syll/sec).
Individual results of the Hearst dataset.

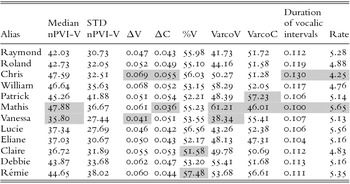
In the Windsor dataset (Table 3), nPVI-V values vary between 35.80 (Vanessa) and 47.88 (Mathis); ΔV values vary between 0.041 (Vanessa) and 0.069 (Chris); ΔC values vary between 0.036 (Mathis) and 0.055 (Chris); %V values vary between 51.58% (Claire) and 57.48% (Rémie); VarcoV values vary between 38.34 (Vanessa) and 61.21 (Mathis); and VarcoC values vary between 46.01 (Mathis) and 57.23 (Patrick). Chris shows the slowest rate (4.25 syll/sec), while Mathis speaks the fastest (5.65 syll/sec). Finally, the average duration of vocalic intervals varies from 0.100 sec (Mathis) to 0.130 sec (Chris).
Individual results of the Windsor dataset.

4.1. Effect of minority/majority factor
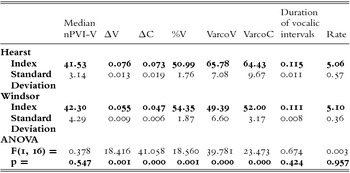
According to the averages (Table 4), the participants in the two datasets articulated at a similar rate: 5.06 syll/sec (Hearst) and 5.10 syll/sec (Windsor), the small difference between the values being a corollary of a shorter average vocalic interval in Windsor (0.111 sec) compared to Hearst (0.115 sec). In addition, ΔV, ΔC, VarcoV and VarcoC values are lower in Windsor than in Hearst (respectively, 0.055 vs. 0.076; 0.047 vs. 0.073; 49.39 vs. 65.78; 52.00 vs. 64.43). In contrast, nPVI-V and %V are greater in Windsor (42.30 and 54.35%, respectively) than in Hearst (41.53 and 50.99%, respectively).
Average values of the measurements by locality.

A greater nPVI-V value suggests a less syllable-timed rhythm in Windsor, whereas lower VarcoV, ΔC and VarcoC values together with higher %V correspond to a trend towards a more syllable-timed rhythm. In other words, all metrics except nPVI-V point to a lesser variability in the duration of intervals in Windsor and a higher proportion of vocalic intervals and, thus, syllable-timed rhythm. This does not support our hypothesis regarding a convergence of a minority French variety with English rhythm.
The differences observed between the varieties were tested together with the effect of age and gender factors to weigh the input of all factors and avoid type I error (i.e., identifying false significant differences). We observe only one significant interaction – minority/majority setting and age factors appear to interact in the ΔC metric. Therefore, with only one exception, there is no particular group that shows a particular behaviour within any of the datasets.Footnote 11 This allows us to present results of statistical tests as we present the results for each extra-linguistic variable – minority/majority setting, age, and sex.
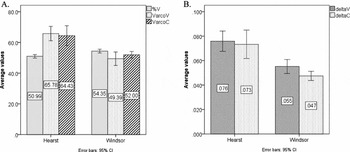
Thus, the differences between the varieties that are presented here are not significant for nPVI-V, transformed rate or interval durations (F(1, 16) ≤ 0.647; p ≥ 0.378). However, with respect to ΔV, ΔC, VarcoV, %V and transformed VarcoC, the differences show statistical significance (F (1, 16) ≥ 18.416; p ≤ 0.001), thus confirming, contrary to our hypothesis, a more syllable-timed pattern in the minority setting of Windsor than in the majority setting of Hearst (Figure 2).
Values of the metrics showing significant differences between the majority (Hearst) and minority (Windsor) settings. For all metrics, original (non transformed) values were used to build the diagrams.

4.2. Effect of age factor
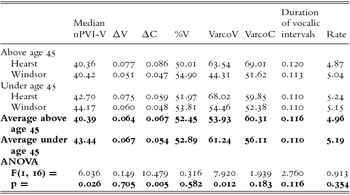
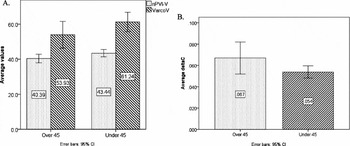
After examining the tendencies between age groups, we noted the following (Table 5). In both datasets, results for ΔC and VarcoC show that younger participants exhibit less variability than those over age 45 (0.054 vs. 0.067 and 56.11 vs. 60.31, respectively, for metrics and age groups). However, when we examine the values of other metrics, we find a trend in the opposite direction as the younger speakers demonstrate greater variability of intervals than do those in the over 45 group: 43.44 vs. 40.39 (nPVI-V), 0.067 vs. 0.064 (ΔV), 61.24 vs. 53.93 (VarcoV). Thus, the reported results suggest contradictory trends in terms of differences between age groups. At the same time, the proportion of vocalic intervals is similar for both age groups (52.89% and 52.45%, respectively). Finally, as might be expected, younger participants exhibit a faster rate (5.19 syll/sec) than do the over age 45 speakers (4.96 syll/sec), which is consistent with a shorter average duration of vocalic intervals: 0.110 sec vs. 0.116 sec, respectively. It should be noted that these latter differences are not statistically significant (Table 5). However, the correlation with age is significant for nPVI-V, ΔC and VarcoV variables (F (1, 16) ≥ 6.036; p ≤ 0.026) (Table 5), confirming a tendency for the younger speakers to have a less syllable-timed rhythm (Figure 3).
Results for age groups.

Values of the metrics showing significant differences between two age groups. For all metrics, original (non transformed) values were used to build the diagrams.

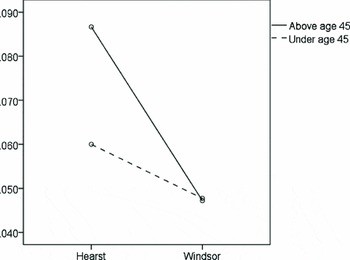
As previously mentioned, the only significant interaction between the external variables was that of ΔC (F (1, 16) = 11,349; p = 0.004), as presented in Figure 4. As evidenced here, ΔC values are considerably lower for the group of younger participants in Hearst than they are in the above age 45 group.
Interaction between variables, age and locality, for ΔC.

4.3. Effect of sex factor
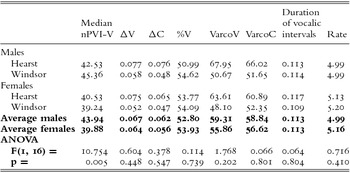
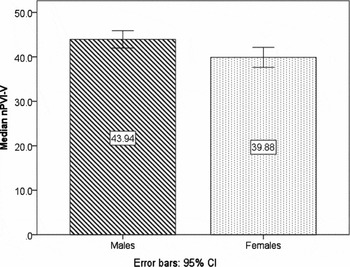
Tendencies observed in comparison of rhythm metrics for men with those of women in the overall data support the hypothesis of a more syllable-timed rhythmic pattern in women's speech, a pattern reflected in their lower nPVI-V and VarcoV values compared to those of men: 39.88 vs. 43.94 (nPVI-V); 55.86 vs. 59.31 (VarcoV) (Table 6). The other metrics also exhibit greater values for male speakers than for female speakers: 0.067 vs. 0.064 (ΔV); 0.062 vs. 0.056 (ΔC); 58.84 vs. 56.62 (VarcoC). This suggests a more complex phonotactic structure, which is a characteristic of less syllable-timed rhythm. Additionally, women articulate faster than men (5.16 syll/sec vs. 4.99 syll/sec, respectively) and produce vocalic intervals that are of similar duration compared to those of men (0.113 sec). Consequently, women have a higher %V value than men (53.93% vs. 52.80%, respectively). However, the only significant difference is that of nPVI-V (F (1, 16) = 10.754, p = 0.005) (Table 6, Figure 5).
Results for males and females.

Values of the metrics showing significant differences between males and females. For all metrics, original (non transformed) values were used to build this diagram.

4.4. Correlations between metrics and rate
To complete the examination of rhythm metrics, we correlated them with articulation rate (transformed values) because their interaction sometimes facilitates discrimination between rhythmic types (Arvaniti, Reference Arvaniti and Niebuhr2012b; Avanzi et al., Reference Avanzi, Obin, Bordal, Bardiaux, Quiuwu, Ding and Hirst2012; Obin et al., Reference Obin, Avanzi, Bordal, Bardiaux, Ma, Ding and Hirst2012). After correlating the transformed rate values with nPVI-V, ΔV, ΔC, %V, VarcoV, 1/VarcoC and log10(Interval durations), we found an interaction between rate and duration of vocalic intervals in both datasets (N = 12; r ≥ 0.830; p ≤ 0.001), with ΔV in Hearst (N = 12; r = 0.781; p = 0.003) and with ΔC in Windsor (N = 12; r = 0.850; p ≤ 0.001). Because the formula for transforming rate is based on a negative asymmetry observed in the data distribution and involves the subtraction of a given rate value from a constant, the results of the correlation tests are interpreted as an inverse dependence. That is, as the rate increases, the duration of the intervals decreases. Accordingly, ΔV values decrease in Hearst, while ΔC values decrease in Windsor. Furthermore, in Hearst, consonantal intervals are not affected by rate (N = 12; r = 0.193; p = 0.548), and in Windsor, rate does not interact with vocalic intervals (N = 12; r = 0.447; p = 0.145). The other metrics do not demonstrate a correlation with rate (transformed), which is expected given that they are normalized for rate.
Similar correlations were found in social groups. For example, rate is correlated with ΔV in the above age 45 group (N = 12; r = 0.606; p = 0.000) and in females (N = 12; r = 0.652; p = 0.022). Again, the dependence observed is inverse such that as rate increases, duration of vocalic intervals decreases.
5. Discussion and conclusion
The current article addressed phonetic rhythm in spontaneous French spoken in Canada in majority and minority contact settings (Hearst and Windsor corpora, respectively). The main purpose of this investigation was to determine if, in a minority setting, French is spoken with a less syllable-timed rhythmic pattern because of the influence of the stress-timed rhythm of English, the majority language with which it is in intense contact. We also examined social variation within each corpus separately and in both corpora together. Our working hypotheses with respect to social variation, based on our preliminary study, were that men and younger participants would have a less syllable-timed pattern than women and speakers above the age of 45, and that such differences would be even more pronounced in Windsor.
The series of rhythm metrics applied to test the hypotheses were nPVI-V, ΔV, ΔC, %V, VarcoV, and VarcoC; articulation rate was also examined. The results of the analysis partially confirm our hypotheses. Our main hypothesis regarding the tendency of OF in a minority setting to show an English-like rhythm was not confirmed; in fact, an opposite trend was statistically supported. Thus, a lesser value of the VarcoV metric in the Windsor corpus translates a lower amount of variability in duration of vocalic intervals in comparison with the Hearst dataset. Together with a higher %V, this corresponds to properties of languages having a syllable-timed rhythmic pattern. Moreover, ΔV, ΔC and VarcoC are lower in Windsor than in Hearst, which translates to a less complex phonotactic structure, another characteristic of syllable timing. However, while a higher nPVI-V value in the Windsor corpus appears to contradict this tendency and support our main hypothesis, it has no statistical significance. Articulation rate, unlike in previous studies (Avanzi et al., Reference Avanzi, Obin, Bordal, Bardiaux, Quiuwu, Ding and Hirst2012; Obin et al., Reference Obin, Avanzi, Bordal, Bardiaux, Ma, Ding and Hirst2012; Kaminskaïa, forthcoming), does not show any notable differences between the minority and majority settings, or between the social groups, in the current analysis.
Our results partially confirmed our hypotheses, based on our pilot study, for the social factors of age and sex. We found significant differences between age groups for nPVI-V, VarcoV and ΔC, with both metrics demonstrating higher values among younger speakers. Thus, this group has a less syllable-timed rhythmic pattern, consistent with our hypothesis that their generation's more intensive contact with English could shift their French prosody in such a direction. The values of the other metrics do not suggest clear age correlations, which may mean that phonotactic and syllabic structures are comparable between the groups. As for the social factor of sex, we found only one significant trend, with lower nPVI-V indices for female speakers reflecting a more syllable-timed rhythm.
While tendencies observed for age and sex groups are consistent with our previous findings, the tendency of the variety in a minority setting towards syllable-timed rhythm is rather unexpected. Nevertheless, it is not incompatible with effects of contact with English and an incomplete mastery of French phonological processes. For example, an incomplete mastery of the rules of schwa omission and consonant cluster simplification, and a less frequent realization of liaison can contribute to such a result. The same linguistic factors can also perhaps partially explain the differences between sex and age groups as higher values of ΔC and VarcoC found in a younger group can result from non-simplified consonantal clusters, while a higher %V can result from the non-omission of schwas.Footnote 12 Indeed, Poiré (Reference Poiré, Durand, Laks and Lyche2009: 173) observed in the same Windsor corpus that ‘younger speakers tend to [. . .] realize more and more’ schwas that are not found at the end of polysyllabic words. Moreover, the contexts of realized liaison are extremely limited in this population.
The more syllable-timed rhythm pattern in women, suggested by all metrics but confirmed only for nPVI-V, is difficult to explain according to Labovian principles (Labov, Reference Labov1990) in terms of either women's preference for standard over vernacular variants, or for incoming forms, in the absence of evidence either for stable social stratification of rhythm patterns or for a change in progress towards an incoming rhythm pattern. However, this finding may perhaps be partially explained in terms of these speakers’ orientation towards a more formal and standard pronunciation, which relates again to the realization of the schwa and liaison and to vowel quality in Canadian French. Under such an explanation, their lower values of vocalic intervals could result from a more standardized pronunciation with a lower frequency of vernacular variants such as diphthongs and lengthened pretonic vowels, in addition to a higher rate of realization of liaison, which breaks sequences of vowels. Indeed, as observed by Poiré et al. (Reference Poiré, Kaminskaïa and Tremblay2010) in text readings by Windsor speakers, women realize liaison more frequently than men. A closer examination of these phonetic and phonological variables would of course be necessary in order to confirm the explanation we propose here.
One of the primary objectives of this study was to assess potential language contact effects on rhythm, drawing on the findings of previous studies, such as Thomas and Carter (Reference Thomas and Carter2006), Cumming (Reference Cumming2011), Obin et al. (Reference Obin, Avanzi, Bordal, Bardiaux, Ma, Ding and Hirst2012), and Avanzi et al. (Reference Avanzi, Obin, Bordal, Bardiaux, Quiuwu, Ding and Hirst2012), that showed how rhythm metrics can shed light on prosodic consequences of language and dialect contact. As we pointed out in the introduction to this article, sociolinguistic studies (Mougeon and Beniak Reference Mougeon and Beniak1991; Mougeon et al. Reference Mougeon, Nadasdi and Rehner2005, among others) have shown that French in a minority context in Ontario exhibits a number of lexical and morpho-syntactic transfer and convergence effects due to contact with English, in addition to internal processes of grammatical restructuring due to reduced frequency of French language use. A pilot study by Tennant (Reference Tennant, Marnieau and Nadasdi2011) had shown that Franco-Ontarian speakers in a minority setting whose use of French outside of the formal school setting was restricted patterned more closely with Anglophone learners of L2 French in terms of rhythm, with higher nPVI-V values reflecting a less syllable-timed rhythm, than with speakers from a majority setting for whom contexts of everyday French use were not subject to such restriction. It should also be noted that Taylor (Reference Taylor2011) obtained an average nPVI-V of 46.1 for spontaneous speech of intermediate and advanced level Canadian Anglophone L2 learners, reflecting only a slight tendency toward a less syllable-timed rhythm than that of native speakers. This result would support the view that English effects on French rhythm can be expected to be minimal, and that the prosodic characteristics that make a minority Franco-Ontarian accent, or an English Canadian accent in French, different from the accent of a Franco-Ontarian from a majority Francophone setting, are to be sought in other suprasegmental parameters, such as intonation patterns, tonal alignment, etc. (cf. Tremblay, Reference Tremblay2007; Kaminskaïa, Reference Kaminskaïa2013).
Our analysis offered the first approach to phonetic rhythm in French spoken in Ontario in two different settings applying multiple rhythm metrics. The examination of the realization of the schwa and liaison in the Hearst dataset will add to the observed tendencies between the varieties and the social groups. A detailed analysis of phonotactics will also shed light on the results of correlation tests, according to which Windsor data exhibit an inverse dependence between rate and ΔC, while Hearst data exhibit such independence between rate and ΔV.
Timing being only one of the aspects of phonetic rhythm, in order to gain a deeper understanding of rhythm in the varieties considered, future research should consider phonetic and phonological characteristics capable of influencing variation in rhythm, such as the nature of secondary stress and placement as well as the lengthening of the penultimate syllable (see Boudreault, Reference Boudreault, Léon, Faure and Rigault1970; Cichocki, Reference Cichocki, Dubois and Boudreau1997; Robinson, Reference Robinson and Léon1968; Walker, Reference Walker1984). Furthermore, the contribution of prosodic hierarchy to rhythmic patterns must also be studied by addressing final lengthening and distribution of interval durations across stress groups vs. intonational phrases.
APPENDIX: ANOVA RESULTS
Tests of Between-Subjects Effects Dependent Variable: Transformed rate

Tests of Between-Subjects Effects Dependent Variable: Transformed Duration of Vocalic Intervals

Tests of Between-Subjects Effects Dependent Variable: Median nPVI-V

Tests of Between-Subjects Effects Dependent Variable: ΔV

Tests of Between-Subjects Effects Dependent Variable: ΔC

Tests of Between-Subjects Effects Dependent Variable: %V

Tests of Between-Subjects Effects Dependent Variable: VarcoV

Tests of Between-Subjects Effects Dependent Variable: Transformed VarcoC