The 2006 election will best be remembered for returning Democrats to power in both the U.S. Senate and the House of Representatives. By almost any metric, November 7 was a bad day for the Republicans. After 12 years of Republican majorities, the Democrats picked up 31 seats in the House and six in the Senate. While significant GOP losses were expected, the results on Election Day were essentially the best case scenario for the Democrats.
While the overall story of the “thumping”1
is a familiar one, the role of Latinos was somewhat overlooked in the coverage of the Democratic victories. While post-election coverage did include—for the second election in a row—some debate over the Latino vote, this was often confused by discussions that featured a lack of historical perspective and an uncritical reliance on conventional wisdoms.2For instance, some media accounts reported that Bush received 44% of the Latino vote in 2004 (see Leal et al. 2005 for analysis), others repeated the notion that Latinos are swing voters (see discussion in this essay), and some used the misleading metaphor of the “sleeping giant” to describe the Latino vote (see Montoya 1999 for discussion).
In 2006, Latinos were both actors and objects in the campaign. As actors, many Latinos played proactive roles as voters, activists, and political candidates. While there was no dramatic single storyline—Latinos did not determine the shift in party control, nor were they central to the overall campaign narrative—the election showed signs of continued growth in Latino political participation and representation. A record number of Latinos voted, and an unprecedented number of Latinos now sit in the Senate and House. As objects, some campaigns featured an anti-immigrant rhetoric that many observers saw as a reaction to Latino population increases. However, there are indicators that immigration was not a major public concern in comparison to other key issues of the day. Although immigration reform was prominently featured in some campaigns, it appeared that victory more often went to comprehensive reform advocates. Furthermore, the nativist-style rhetoric of some candidates did nothing to build on the Latino outreach initiated by George W. Bush and Karl Rove.
In this article we will therefore discuss the multiple dimensions in which Latinos played a role in the recent midterm elections. More specifically, we will address the following questions: (1) how did Latinos vote, and how did this compare to the Latino vote in recent elections; (2) are Latinos swing voters; (3) were Latino voters responsible for the new Democratic congressional majorities; (4) did Latinos make descriptive representational gains in congressional and state offices; (5) what was the effect of the immigration issue in congressional contests; (6) what does 2006 teach us about the Latino vote and the immigration issue; and (7) what are the implications for the upcoming 2008 elections?
The 2006 Results
After the 2004 election, the most significant electoral controversy was the level of Latino support for George W. Bush. Extensive analysis concluded that President Bush received 39–40% of the Latino vote. Initially, the National Election Pool (NEP) claimed 44%, the Los Angeles Times exit poll showed 45%, and the William C. Velasquez Institute (WCVI) indicated a much lower 31.4%. The standard statistic has become 40%, although the occasional journalist will still quote the 44% figure (see Leal et al. 2005 for discussion).
The primary Latino storyline of 2006 was summarized by an Associated Press headline: “Dems Recapture Big Part of Hispanic Vote” (Ohlemacher 2007). It noted that exit polls showed about 70% of Latino voters supported Democratic congressional candidates and 29% supported Republicans. This would be an approximate 11 percentage point drop—and a 28% drop—from Latino support for Bush in 2004. An eight-state exit poll conducted by the WCVI similarly found that 69.6% of Latinos voted for a Democratic candidate for Congress and 26% voted for a Republican candidate.3
According to the Pew Hispanic Center, the 2006 NEP showed that Hispanics voted 69% for Democrats and 30% for Republicans. In 2004, the likely vote was 58% for Kerry and 40% for Bush. This shows a 10 point drop over two years, and the corresponding drop for Anglos (non-Hispanic whites) and African Americans were six points and three points, respectively. The report noted that “The 2004–2006 comparison suggests that something distinctive occurred among Latino voters this year that rewarded the Democrats and punished the Republicans.”
However, it is important to emphasize that the Latino vote has long been overwhelmingly Democratic (for example, see the book series on the role of Latinos in presidential elections from 1988 to 2000 by de la Garza and DeSipio). We might therefore view the 2004 results as comparable to the 1984 results, i.e., anomalous patterns that reflect unique factors rather than permanent partisan shifts. Perhaps 2006 was more of a reversion to the mean for Latinos than a reaction to specific events.
However, comparing 2004 and 2006 is like comparing manzanas y naranjas. A presidential election is very different than a midterm election; the former primarily features a unified national campaign, while the latter scatters attention across hundreds of local campaigns with varied emphases. In addition, the focus of 2004 was President Bush, who was from a state with a significant Hispanic population and had cultivated positive relations with Latinos during his governorship.
To compare apples with apples, the Wall Street Journal contrasted this 29% in 2006 with the corresponding figure of 37% in the 2002 midterm elections—an eight percentage point decline. The Pew Hispanic Center (2006, 2) also noted the four-year change for Anglos and African Americans—nine points and zero points, respectively. This shows that while Latinos exhibited the largest drop in comparison to 2004, the percentage point change for Anglos and Latinos from 2002 to 2006 was about the same. The report noted that “The 2002/2006 comparison suggests that Latino voters this year did not behave distinctively but rather reflected a broader political trend that was evident among whites” (2). However, we might note that the percentage drop in the GOP vote was larger for Latinos (22%) than for Anglos (16%), as the baseline was smaller for the former in 2002 (37 vs. 57%).
In terms of voter turnout, the NEP indicated that Latinos were 8% of the electorate in 2006. In 2004, the NEP estimated that Latinos were 8.4% of the electorate (Pew 2006). This does not appear to reflect any surge in Latino participation in reaction to the immigration issue or any other issue. Other evidence arguing against a Latino surge is found at the state level. For instance, according to the Office of the Texas Secretary of State, 21% of eligible voters statewide in November of 2006 were Latino, which is the same figure from January of that year (Castillo 2006).
Estimates based on the November, 2006 Current Population Survey (CPS) are somewhat different. The Pew Hispanic Center (2007) reported that Latinos cast 5.8% of all votes, which was a slight increase over the 5.3% in 2002. Such gains were possibly driven by demographics, as Latinos were responsible for about half of U.S. population growth during this time.
While these data show that Latinos were slightly more likely to be registered and vote in 2006 than in 2002, this was also the case for Anglos. Overall, 13% of all Latinos voted in 2006, compared to 39% of Anglos and 27% of African Americans. This represents no increase for the latter, a one-point increase for Latinos, and a two-point increase for Anglos. In absolute terms, an additional 800,000 Latinos voted in 2006 than in 2002; the comparable figure was 5.6 million for Anglos and 400,000 for African Americans.
Nevertheless, across the decades, there is a clearly visible growth in the number of Latino voters. According to the Tomás Rivera Policy Institute,4
the total has increased from 2.5 million in 1980 to 3.7 million in 1988 to 4.9 million in 1996 to 7.6 million in 2004—and with an estimated 9.3 million Latino voters in 2008. These numbers are difficult for any political party to ignore and underlie much of the recent attention paid to the Latino electorate. Nevertheless, they are not sufficient to influence most national elections, and some of the recent gains in descriptive representation came from Latino candidates who won in states where winning the Latino vote is not enough to ensure victory—such as New Jersey, Colorado, and Florida.A. Regional Results
Despite the overall drop in Hispanic support for the GOP, it is important to note that some Republican candidates did relatively well. As Ohlemacher (2007) reported, Senator Jon Kyl (R-AZ) received 41% of the Latino vote and Nevada GOP gubernatorial candidate Jim Gibbons received 37%. Such results are problematic for Democrats because the party hopes to capture the southwest region in future elections. With a “solid southwest,” the Democrats could be less concerned about the Republican's “solid South,” which is not likely to become more competitive in the foreseeable future (see Hayes and McKee 2008).
Scarpinato (2006) found similar dynamics in Arizona. For example, almost half of Latino voters supported an “official English” ballot initiative and a measure that would prevent unauthorized immigrants from accessing some state government services. This was reminiscent of the 2004 election, when about half of Latino voters supported Arizona Proposition 200, which would require proof of citizenship to vote and restrict access to some government benefits.
The Pew Hispanic Center (2006, 3) also found that a few other Republican statewide candidates did much better than the average GOP House candidate. For instance, 39% of Latinos in California voted for Governor Arnold Schwarzenegger and 44% of Hispanics in Texas voted for Senator Kay Bailey Hutchison.
Ayón (2006) contrasted the victory of Brian Bilbray in California's Fiftieth Congressional District with two elections in Arizona. After the resignation of Randall “Duke” Cunningham, Bilbray won a special election in June and later won the November election. A lobbyist for the Federation for American Immigration Reform (FAIR) and a former U.S. Representative, Bilbray “returned to Washington touting the immigration issue as a counter to voter concerns about corruption and unease over the war in Iraq—just as House leaders were deciding how to respond to the Senate's comprehensive, bipartisan immigration reform bill” (2).
However, this strategy paid fewer dividends for Republican candidates in Arizona, where immigration was a hot-button issue. In the Fifth and Eighth Congressional Districts, two Democrats who supported comprehensive reform defeated incumbent J.D. Hayworth and open-seat candidate Randy Graf, respectively. Graf was a former state legislator and “self proclaimed border ‘Minuteman’” (Ayón 2) and Hayworth was focused on unauthorized immigration5
“Unauthorized” is the term used in Department of Homeland Security (DHS) publications. For instance, see: www.dhs.gov/xlibrary/assets/statistics/publications/ill_pe_2006.pdf.
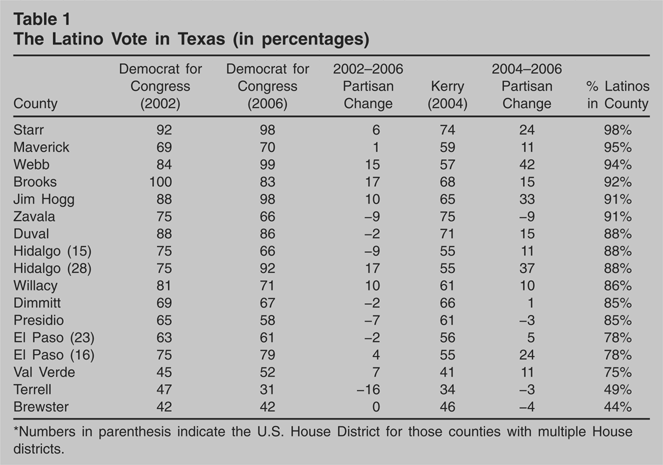
We also examine electoral returns in heavily-Latino Texas counties in 2006, 2004, and 2002. This shows strong support for Democratic candidates, especially in comparison to President Bush's performance in those same counties in 2004. Official voting results in Table 1 show that President Bush did better in 2004 than the local Republican candidates for Congress in 11 out of the 15 most populous Latino counties. For instance, George Bush won 40% of the vote in Maverick County in 2004, which is 95% Latino, but Republicans won only 29% of the congressional vote in 2006. The local Democrats did better than John Kerry in all but four of the counties. For example, John Kerry won 59% of the vote in Maverick County in 2004, but 70% of the vote went to the Democratic Party in 2006. Comparing such returns can be problematic, as the lack of a contested election or a credible challenger will affect party vote results. Nevertheless, the lack of a challenger can itself indicate weakness in the region. In general, by any measure, the data show that the majority-Latino counties are strongly (but not always overwhelmingly) Democratic.
The Latino Vote in Texas (in percentages)

B. Data from Pre-Election Surveys
We now turn to polling data on Latino voter preferences and public opinion during the 2006 campaign. Our data are derived from three surveys taken throughout 2006 by the Latino Policy Coalition (LPC).6
The LPC is a national non-partisan non-profit consortium of the leading Latino research organizations in the United States. It includes, among other groups, the Tomás Rivera Policy Institute, Latino Issues Forum, William C. Velasquez Institute, National Association of Latino Elected Officials, and the National Institute for Latino Policy. Each survey was conducted using its own sampling frame and respondents were chosen through a random digit dialing sample from the 22 states with the densest Latino populations. The data were then weighted according to the demographic and geographic characteristics of the sample.
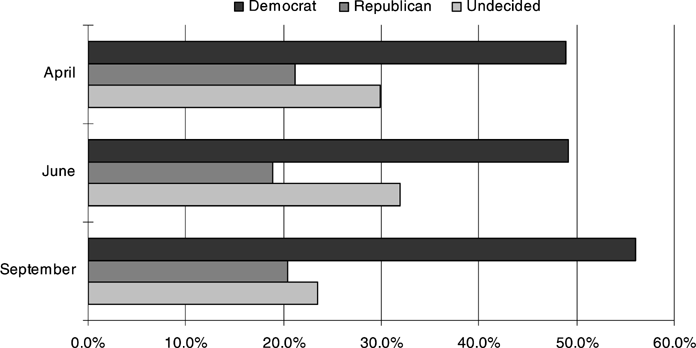
Figure 1 provides Latino party preferences across the three surveys. During the campaign, Democrats remained the clear favorite among Latinos. In addition, undecided Latinos appear to begin breaking for the Democrats in the final survey before the election.

U.S. House of Representatives Vote Preference Among Latinos, 2006
Source: Latino Policy Coalition Surveys, April, June, September 2006.
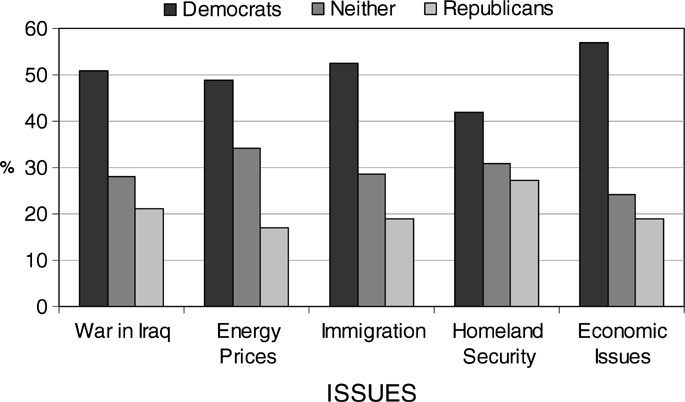
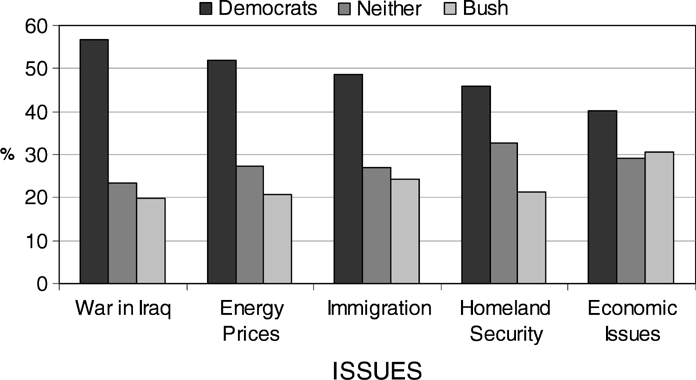
Figure 2 is drawn from a battery of questions asking respondents to choose whether the Democrats in Congress, the Republicans in Congress, or neither would do a better job of handling five policy issues: the war in Iraq, energy prices, immigration policy, homeland security, and the economy. Figure 3 is drawn from a parallel question that asked the respondent to choose between the Democrats in Congress and President Bush.

Who Would Do a Better Job of Handling This Issue: Republicans in Congress or the Democrats in Congress?
Source: Latino Policy Coalition Survey, September 2006.

Who Would Do a Better Job of Handling This Issue: George Bush or the Democrats in Congress?
Source: Latino Policy Coalition Survey, September 2006.
These data illustrate that Latinos strongly believed that Democrats in Congress would do a better job of handling each issue than would Republicans in Congress. While the difference is smallest for homeland security, even there the Democrats are given a double-digit advantage. Similarly, Latinos were also more trusting of Democrats in Congress than President Bush, although Bush received higher marks than congressional Republicans for some issues and lower marks for others.
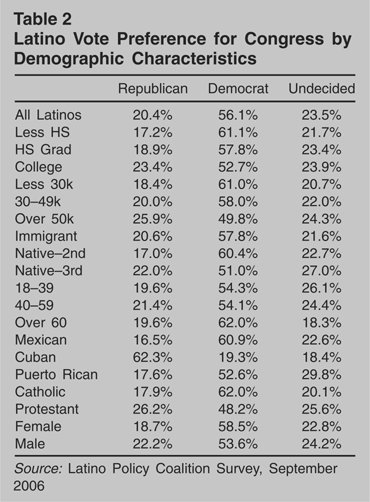
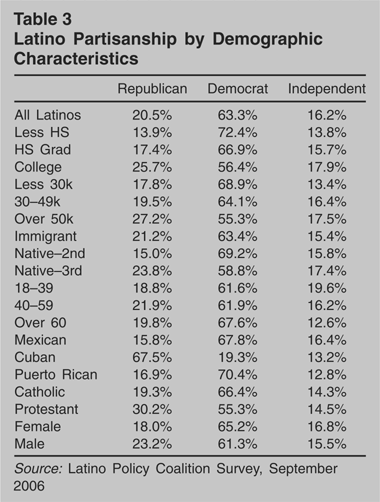
Tables 2 and 3 break down Latino voter preferences and partisanship, respectively, in September according to various demographic characteristics. Consistent with past surveys, Democratic candidates enjoy strong support among Latinos. Overall, 56.1% of Latinos preferred Democrats, 20.4% Republicans, while 23.5% were undecided. While there is some demographic variation in support for congressional Democrats, only one group expresses majority support for congressional Republicans—Cuban Americans. Over 62% of this national-origin group preferred congressional Republicans, and there were just slightly more Democratic voters than undecideds. This conforms to previous understandings of Cuban Americans, who are particularly concerned with U.S. Castro policy and are a traditionally strong Republican constituency.
Latino Vote Preference for Congress by Demographic Characteristics

Latino Partisanship by Demographic Characteristics

An additional important division is religion. Catholics are the least supportive of congressional Republicans—with a fifth of this population undecided, only 17.9% of Catholics supported congressional Republicans. Support for congressional Republicans is higher among Protestant respondents (26.2%), although Democrats still win the plurality. Prior analysis has pointed out that a “religion gap” has emerged as a key dividing line in the Latino vote (Leal 2007; Lee and Pachon 2007). Our data suggest this gap in the Latino electorate continued into the 2006 congressional elections and may therefore be a lasting feature.
We also see some socio-economic status (SES) differences. The college educated (23.4%) and those earning over $50,000 per year (25.9%) expressed support for Republican congressional candidates higher than the Latino average. The table also indicates a gender difference, with Latinas approximately five percentage points more supportive of Democrats than Latinos.
The above findings are largely paralleled in Table 3, which asks about partisanship in September: 63.3% of Latino respondents identified as Democrats, 20.5% as Republicans, and 16.2% as independents. Again, while no demographic except for Cuban Americans are over 50% Republican, the categories with the strongest (although still minority) GOP identification are Protestants (30.2%), those with a college education (25.7%), and those who earn over $50,000 per year (25.9%). While the existence of such differences is slightly encouraging to Republicans in this disappointing election year, the share of the Latino population that is well educated, high earning, or Protestant is not very large. While the GOP may be able to attract some of these voters, the Democrats should continue to win the clear majority of Latinos for the foreseeable future.
Are Latinos Swing Voters?
In recent years, a number of media stories include discussion of Latinos as swing voters. According to a Wall Street Journal editorial, the GOP in 2006 managed to alienate a “fast-growing block of Latino swing voters” (Wall Street Journal 2006). An Associated Press article (Ohlemacher 2007) said that the complex results “suggest that Latinos could be important swing voters in the 2008 presidential election.” The same story included the following quote from Bush consultant Lionel Sosa: “But the fact is the Latino is becoming more of a swing voter—no longer voting the Democratic Party line, but not calling themselves Republicans, either.” Another observer went so far as to call Latinos “the country's ultimate swing voters” (Lovato 2007).
According to this argument, rather than being committed to any particular party, many Latinos are willing to support either major party depending on which is doing the most for the Latino community or promising the most to promote the interests of the Latino community. As construed, Latino voters are therefore genuine retrospective and/or prospective voters. This depiction has gained widespread popularity and acceptance, and it is often seen in media accounts and activists' statements.
There is nothing inherently problematic with the use of the term “swing voters” to describe a segment of the U.S. electorate. Swing voters can either scrutinize the candidates for the best offer or be easily swayed by rhetorical appeals. The key question is how accurately the term captures the political behavior of Latinos. Have Latinos often switched their partisan allegiances and voted for candidates who happen to be the highest bidder in a given election? As revealed once again in the 2006 midterm election, the answer is no.
The strong majority of Latino voters have consistently identified with one party or the other—Cuban Americans largely vote Republican, and non-Cuban Latinos largely support Democrats (see, among others, de la Garza et al. 1992; Barreto et al. 2002; de la Garza and Cortina 2007). Despite the occasional election with higher than average (but never majority) Latino support for a GOP candidate—such as Ronald Reagan and George W. Bush—the fact remains that traditional voting patters will likely continue without a major shift in party policy positions. The 2006 midterm elections also provides further evidence that contradicts the portrayal of Latino voters as swing voters. The majority of Latino voters stayed with the Democratic Party, and while the Latino vote for the GOP declined in comparison to 2004, this was also the case for Anglos and African Americans (as noted above). If Latinos are to be called swing voters, then so should other important segments of the electorate.
Obviously, some of the Latino electorate could possess the kind of characteristics that make them genuine swing voters. Most, however, are not swing voters. A majority of Latino voters have been as partisan in voting as members of other voting blocs (Welch and Sigelman 1993; Barreto et al. 2002; de la Garza et al. 1992; de la Garza 2004; DeSipio 1996; Graves and Lee 2000; de la Garza and Cortina 2007). While the partisan loyalties of Latinos are not as firm as those of African Americans, Jewish Americans, and white Evangelical voters (Fowler et al. 2004; Lee and Pachon 2007), such high levels of party support are the exception and not the rule.
Another theory is that some Latino voters may find their political loyalty pulled in different directions as they consider different policy issues. For example, they may prefer a liberal approach to such issues as the economy, health care, and education, but they may also take more conservative positions on what are commonly known as moral issues, such as same-sex marriage and abortion. Such conservatism is often used to suggest that a growing number of Latinos will switch their partisan affiliation to the GOP—or become sufficiently uncomfortable with both parties that they identify as independents and are thereby more likely to change their vote across elections. This might be another basis for seeing Latinos as swing voters, but there is little evidence that supports this line of contention.
Many surveys of Latinos have demonstrated that moral issues do not rank higher than economic and other social issues as the most important issue facing the nation or the Latino community (see, among others, Barreto et al. 2002). As in the case of African-American voters, concerns about moral issues are outweighed—at least for the majority of the electorate—by more immediate concerns, such as the economy, foreign policy, healthcare, and education. This should not come as a surprise, given that Latinos are still disproportionately socially and economically disadvantaged. Those who do prioritize social issues are likely already supporters of the GOP. In sum, there is little reason to believe that moral issues would cause significant swings in Latino voter behavior.
In fact, there is little evidence that Latinos have behaved as swing voters. According to Roberto Suro, Latinos “are not swing voters in the way that white middle-class men have been for the past 20 years, like the Reagan Democrats” (Ohlemacher 2007). Thus, it should be clear that the portrayal of Latino voters as swing voters is largely a myth. The emergence and promotion of that myth is a different issue. Historically, Latino voters were largely ignored. Due to both the real and potential growth of their numbers, Latino voters are the object of growing political attention (de la Garza and Cortina 2007). To continue that momentum and avoid being ignored again, some Latino leaders want to remind political parties and candidates not to take the Latino vote for granted; if these leaders claim that Latinos are swing voters, it encourages politicians and parties to continue to work hard to win the hearts of Latino voters. While this may serve a political purpose, it does not help scholars or the general public to understand the Latino electorate.
Some pundits, journalists, and political consultants may repeat the myth for professional reasons. It would produce much more interest, as well as create suspense, if a substantial share of the Latino electorate was said to frequently switch its support for political parties and candidates. Such a portrayal would help generate more demand for those who provide interpretation of, commentary about, and outreach to the Latino electorate.
In addition, others may not be well informed about Latino politics and are simply repeating a plausible-sounding claim made by others. Over time, journalists, commentators, and consultants will hopefully become more judicious in their use of broad generalizations about the Latino electorate as more information and research becomes available.
Latino Elected Officials
The 2006 elections saw some Latino representational gains at the national and state levels (WCVI 2006). In the U.S. Senate, New Jersey voters elected Robert Menendez, a Democrat and Cuban American who had been earlier appointed to the position by Governor John Corzine. This raised the total number of Latino senators to three: two Democrats and one Republican. In the House, New Jersey state representative Albio Sires won the seat vacated by Menendez. Furthermore, Representative Henry Bonilla (R) was defeated by former U.S. Representative Ciro Rodriguez in a district that was redrawn in response to a Supreme Court redistricting case. With Bonilla's defeat, the Republicans lost their only non-Cuban Latino member of the House. The election therefore increased the total number of Latinos in the House to 23—20 Democrats and three Republicans.
At the state legislative level, there was relatively little change. In lower chambers, net Latino representation increased by two to 180. In upper chambers, net Latino representation declined by one to 59. An analysis of lower chamber results shows that most gains were in the new destination states; according to NALEO Educational Fund Executive Director Arturo Vargas, “Latinos in states with emerging communities are writing the next chapter of our political history” (WCVI 2006). Latinos also won statewide offices in New Mexico, Idaho, and Oregon.
Was Immigration a Critical Issue?
Contrary to some media and pundit expectations, the issue of immigration did not appear to play an important role in the 2006 midterm elections. According to a national pre-election survey conducted by the Tarrance Group for the Manhattan Institute, immigration turned out to be neither “a top vote determining issue” nor “a top turnout motivator” (Goeas and Nienaber 2006). As several surveys revealed, immigration—although salient—never registered as more important than such issues as the war in Iraq and the economy in the minds of Latinos and non-Latinos alike (Fletcher and Cohen 2006; Ohlemacher 2007). This suggests that any efforts to mobilize the electorate around that issue likely failed.
Noticing the public's increased anxiety over the issue of immigration, especially unauthorized immigration, some Republicans thought the issue might help preserve their majorities in Congress (Ayón 2006). However, there is little evidence that this helped vulnerable GOP candidates. For example, according to a Wall Street Journal editorial after the election, Senator Rick Santorum “spent the summer trying to link Mexican immigrants to the Iraq War. By the end of the campaign, he was accusing anyone who favored comprehensive immigration reform of being soft on terrorism” (Wall Street Journal 2006). In addition, some candidates who emphasized the unauthorized immigration issue lost House campaigns, including incumbent J.D. Hayworth (R-AZ) and Jim Hostettler (R-IN)—the latter in a district that only voted 38% for John Kerry in 2004. As Dorval and LaRue (2006) found in an analysis of congressional races on Immigration2006.org, “very few toss up races were won by Republican candidates who attempted to exploit immigration as a voter motivator.”
Why, then, did the seemingly hot-button immigration issue fail to serve as a wedge issue? For one, the public did not see immigration as one of the most important issues. According to the pre-election survey mentioned above, only 11% of respondents said immigration was the most important issue in their congressional vote (Goeas and Nienaber 2006). While the survey found that GOP candidates were closing the gaps in the week before the election, “these gains are certainly not being made by making harsh criticisms about the dangers of illegal immigration and amnesty” (Goeas and Nienaber 2006). A Washington Post analysis of NEP exit poll data found that “fewer than one in three cited [immigration] as extremely important in influencing their decision, and they only narrowly favored Republican candidates” (Fletcher and Cohen 2006). Of the six issue questions in the NEP—the war in Iraq, terrorism, the economy, illegal immigration, values issues, and corruption in government—immigration received the lowest percentage of “extremely important” responses (30%) and the fifth lowest of “extremely” and “very” important responses (62%). In addition, voters seemed to support comprehensive immigration reform as opposed to other alternatives. According to the NEP exit poll, given the choice between a path to legalization and deportation for illegal immigrants, 57% favored the former (and 61% of these respondents voted for Democrats).
If the issue of immigration did not help the Republicans, did it hurt them? It is not difficult to find suggestions that GOP anti-immigration themes alienated Latino voters. In an editorial after the 2006 election, the Wall Street Journal wrote “So much for the Lou Dobbs election strategy” (Wall Street Journal 2006). Calling anti-immigration the “fool's gold of American politics,” the editorial noted that “Republicans on Tuesday managed both to lose their majority in Congress and alienate a fast-growing bloc of Latino swing voters.” According to an article in La Opinión, “el perdedor fue el Partido Republicano [the loser was the Republicans Party]” because Latinos cared about immigration while non-Latinos did not (Marrero 2006). The article further noted that some experts were comparing the Latino reaction to anti-immigration rhetoric to that of Latinos in California after Proposition 187, which saw significant long-term electoral benefits for the Democrats. A Los Angeles Times article by Watanabe and Gaouette (2006) led with, “Anger over anti-immigration rhetoric helped fuel a shift in the Latino vote to Democrats, damaging Republican hopes of luring this fast-growing population into its fold, Latino activists and political analysts said Thursday.” It also mentioned “national polls that showed the Latino vote helped Democrats recapture Congress.” According to Pollster Sergio Bendixon (Altan 2006), the GOP “basically threw away much of the support they had accumulated with Hispanic voters.”
Is there any evidence in support of such claims? Election Day results showed that some Democrats favoring comprehensive reform defeated hard-line Republicans in contests where Republicans previously fared well, such as the governorship in Colorado and House races in Arizona. Nevertheless, some of the claims are probably half-true at best. The Los Angeles Times article (Watanabe and Gaouette 2006) also reported that polls did not show Latinos prioritizing the immigration issue; rather, Latinos ranked education and the economy higher. Furthermore, pro-immigrant activist groups reported difficultly meeting fundraising goals, and the Latino share of the California vote has not changed since 1998 (about 12%). According to Ohlemacher (2007), the new Latino National Survey (LNS)7
For more information on the LNS, see http://depts.washington.edu/uwiser/LNS.shtml.
More generally, despite assumptions that Latinos highly prioritize immigration, Latino issue priorities largely track those of Anglos (although Latinos typically take more liberal policy positions), and immigration is rarely placed highly on open-ended survey questions about issue priorities. We might therefore exercise caution and not assume that immigration drove the Latino vote—especially when Latino declining support for Republicans paralleled declining Anglo support. Perhaps this election—for all constituencies—had more to do with Iraq and corruption than immigration. The somewhat stronger GOP decline among Latinos than Anglos may just reflect a reversion to the mean at the end of the Bush years. The storyline that Latinos are swing voters who particularly care about immigration and helped the Democrats win congressional majorities in 2006 in response to GOP tactics has a certain neatness, simplicity, and appeal, but the evidence is lacking on all counts.
Did Latinos Put the Democrats Over the Top?
In recent elections it has become fashionable to talk about the potential power of the Latino vote. While few doubt the Latino vote will become more important as a growing number of Latinos register to vote (DeSipio and de la Garza 2002; Ramos 2004), the reality is that Latinos are unlikely to determine many national election results in the foreseeable future. This is because the Electoral College system does not easily translate national population growth into political power.
This is shown by de la Garza and DeSipio's book series. The editors and contributors note that important factors include where Latino voters are located, the unity of the Latino vote, and the voting patterns of non-Latino populations. In close elections in key battleground states (such as Florida), Latinos have the potential to exercise some influence. However, most Latinos live in so-called “red” or “blue” states, and while there is significant population growth in the “new destination states,” the number of Latino voters is relatively small outside of the southwestern states, Florida, Chicago, and parts of the northeast. If a presidential election margin is wide, or the Electoral College outcome is determined by states with relatively few Latinos, then expectations that population will correlate with power will be disappointed.
Why did Latinos vote largely for congressional Democrats in 2006? First, we must be wary about looking for ethnic-specific explanations for voting fluctuations. As noted previously, Latino and Anglo support for parties and politicians are not unrelated. Latino support is higher for those politicians also popular with Anglos (Ronald Reagan and George W. Bush), while Latino support declines for those candidates who did relatively poorly among Anglos (Bush in 1992, Dole in 1996). While many Latino voters did abandon the GOP in 2006 (or at least the congressional wing of the party), the Republicans also lost support from other segments of the electorate, mainly moderate and ideologically less committed voters (Pew Hispanic Center 2007). It should not therefore come as a surprise that some Latinos who supported George W. Bush in 2004 also voted for Democratic candidates in the midterm election of 2006, as this was the case for some Anglos and African Americans. Perhaps Latinos also wanted to express their displeasure with the current administration and Congress. There is also the well-known phenomenon of midterm losses for presidents (e.g., Campbell 1991, 1987), so perhaps Latinos were just one element in this familiar story.
This does not mean the immigration issue was irrelevant, but it may have played a different role than is usually imagined. For instance, it is possible that moderates of all races and ethnicities were unhappy with the shrill tone of many of the (largely Republican) candidates campaigning on immigration themes. Polls provide little evidence that the general public or Latinos voted primarily on the immigration issue, but some voters may not have prioritized immigration as a policy issue per se but were concerned with how it was discussed.
Did the well-publicized immigrant rallies in the spring of 2006 play a role? According to Castillo (2006), the enthusiasm evident in the rallies proved difficult to convert into electoral activism. Even organizers admitted to registering only 150,000 Latino voters by the eve of the election, far short of the one million promised by some. While naturalizations are increasing, largely in reaction to anti-immigrant sentiment, there are still about eight million eligible legal residents nationwide who have not applied. As Texas State Senator Gonzalo Barrientos noted, “When you see thousands of people in the streets, it may give a false expectation … How many of those are actual citizens or naturalized citizens eligible to vote?”
The Pew Hispanic Center (2006, 4–5) found that Latino voters were unlikely to have affected many congressional races. For instance, of the 75 House races where the winner received no more than 55% of the vote, Latinos constituted 10% or more of the electorate in only 12 races. GOP candidates won eight and Democrats won four of these seats. Of those four, one saw a Republican incumbent defeated and the other three saw Democrats winning open seats with a retiring Republican incumbent. In other words, it is possible that Latinos contributed to a net gain of four Democratic seats out of the 31 gained by the Democrats. Furthermore, there was no partisan change in the control of the 60 House districts where Latinos were 30% or more of eligible voters. It is also unlikely that Latino voters contributed to the Democratic pickup of six Senate seats, as most of the states in question had very small (between 1.5 and 5.4%) Latino electorates.
Conclusions
What did 2006 teach us about the Latino vote? While Latino support for Republicans did drop in comparison to both 2004 (11 points) and 2002 (eight points), this paralleled a growth in Anglo support for Democrats. While Anglo voting for the GOP declined from 2004 to 2006 (by six points) and from 2002 to 2006 (by nine points), the Latino drop was the largest in percentage terms because the baseline was smaller: a 22% Latino drop vs. a 16% Anglo decline over the same four-year period. While potentially worrisome for the GOP, this is not an order of magnitude difference. It also suggests that, when seen in context, the Latino vote is not entirely sui generis. This is also reflected at the state level; generally popular candidates, such as Governor Arnold Schwarzenegger and Senator Kay Bailey Hutchison, were also able to win a significant share of Latino votes.
This suggests that Latinos are not swing voters. While a lack of information, perhaps in combination with professional incentives, may lead some journalists and consultants to make such claims, the reality is that Latino partisanship is generally stable. As seen over the last few decades, Cuban-Americans are primarily Republicans while non-Cubans are primarily Democrats. Any year-to-year variations are largely paralleled by the behavior of other electorates and therefore do not reflect a unique Latino dynamic. George W. Bush in 2004 and Ronald Reagan in 1984 did relatively well among Latinos, but they also did relatively well among Anglos. To see Latinos as swing voters is to view Latino political behavior out of context and ahistorically.
Was immigration a key issue in 2006? A number of GOP candidates who campaigned on “get tough” platforms either lost re-election bids or did not win their open seat contests, and the issue did not catch on and overtake issues like the war in Iraq or congressional corruption. On the other hand, the Democrats approached the immigration issue cautiously and did not emphasize it during the campaign. David Ayón (2006, 2) argued that candidates from both parties sent “mixed messages” on immigration and that the election produced no specific reform mandate. The Democrats did not include immigration reform among their “Six for '06” themes, and immigration was not part of Speaker Pelosi's agenda for the first 100 hours of Democratic control in 2007.
What are the electoral implications of 2006 for Latinos? While the election may have set back GOP efforts to woo Latinos, this is easier to imagine than to prove. Reporting on Democratic gains among Hispanics, the Wall Street Journal (Calmes and Rogers 2006) noted that “Since his days as Texas governor, Mr. Bush and his political strategist, Karl Rove, had envisioned building a stronger long-term Republican coalition by adding Hispanics. The hard line taken by some congressional Republicans on immigration may have damaged that goal.” On the other hand, it is difficult to know how successful such efforts could ultimately have been without substantial changes in GOP domestic policy positions (see Alvarez and García-Bedolla 2003).
In addition, some have argued that Bush's outreach to Latinos was a “ricochet pander” (Cottle 2000) primarily meant to reassure moderate Anglos about GOP tolerance. However, when some Republican candidates in 2006 deviated from the Latino outreach script, it may have called into question whether the GOP had truly changed (see also Philpot 2007). The party could have suffered a “ricochet anti-pander” among moderate and independent voters that may linger into the 2008 election.
How did the election affect the prospects for immigration reform? Columnist Ruben Navarrette, Jr., (2006) argued that Democrats are not likely to take decisive action on immigration reform because they fear it might lose them votes in 2008, because of pressure from labor unions opposed to guest worker programs, and because Democrats “take Latino voters for granted anyway.” As noted previously, while 57% of the NEP respondents favored legalization, 38% favored deportation.8
These were the only two policy options provided by the question.
What are the implications of the 2006 midterm elections for the 2008 presidential election? While many thought that immigration would be the key issue in 2006, this did not turn out to be the case. Instead, the war in Iraq, the war on terror, and congressional corruption appeared to overwhelm other issues. It is therefore possible that the declining economy and foreign affairs may overshadow the immigration issue in 2008. However, rather than speculate on how specific issues and candidates might affect the Latino vote, we might do better to consider the Latino vote in broader perspective. In 1999, before the George W. Bush era, 58% of Latino registered voters identified as Democrats and 25% called themselves Republicans. In late 2007, near the end of the era, 57% identified as Democrats and 23% as Republicans (Taylor and Fry 2007). There is little swing in these numbers. Instead, they suggest that Latinos will once again support the Democratic ticket—more so than Anglos, although not as strongly as African Americans. To the degree that there is variability in the Latino vote, it may well reflect the factors that affect all voters.
Author Bios
David L. Leal is associate professor of government at the University of Texas at Austin. His primary academic interest is Latino politics, and his work explores a variety of questions involving public opinion, political behavior, and public policy. He has published over 40 journal articles and book chapters and is the co-editor of Immigration Policy and Security (forthcoming, Routledge) and Latino Politics (2006, University of Virginia Press).
Stephen A. Nuño is a doctoral candidate in political science at the University of California, Irvine, and research associate at the Leavey Center for the Study of Los Angeles at Loyola Marymount University. His dissertation, “The Influence of Co-Ethnic Partisan Recruitment on Latino Vote Choice,” examines the interactive effect between partisanship and ethnicity on partisan efforts to mobilize Latinos.
Jongho Lee is assistant professor of political science at Western Illinois University. His current research interests include ethnic and racial politics, the politics of immigration, public opinion, and political psychology. He has published articles on Latino political behavior in the American Journal of Political Science, American Politics Research, PS: Political Science and Politics, and Social Science Quarterly.
Rodolfo O. de la Garza is the Eaton Professor of Administrative Law and Municipal Science at Columbia University and vice president of the Tomás Rivera Policy Institute. He is the author or editor of 18 books and numerous professional articles on Latino politics. A former vice president of the American Political Science Association, he has twice been named as one the nation's 100 most influential Hispanics by Hispanic Business.